Bearish Pattern Weighs on XRP: Can Bulls Flip the Trend?

0
0

- XRP is trading at $1.38 after a 2% loss.
- The indicators suggest growing selling pressure.
Ripple’s XRP has been oscillating between red and green waves over the last few weeks. As the crypto market is highly volatile, the price movement is hard to predict in any direction. With XRP moving within a tight range, there is indecision between the buyers and the sellers.
The Ali chart shows XRP in a short-term downtrend, with consecutive lower candles indicating steady selling pressure. Currently, the TD Sequential 9 buy signal suggests that this selling phase may get exhausted, and it could be due for a bounce. It hints that sellers are losing strength, and a short-term relief move may be near.
At the time of writing, the asset is trading around $1.37, with a 2.14% loss in value. Moreover, the daily trading volume has surged by over 14.57%, reaching the $1.64 billion mark. The Coinglass data has reported that the XRP market has seen a $5.62 million in liquidations.
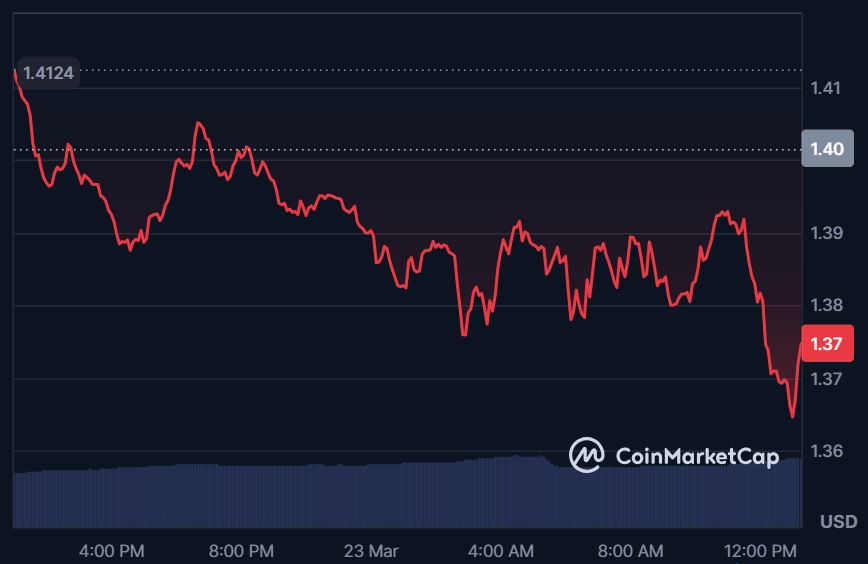
With the XRP bears in control, the price could slip to its support at the $1.34 level. If the downside sentiment is sustained, the death cross might take place, and send the price to retest a range below $1.30. Upon a reversal, the XRP bulls will head to the resistance at around $1.42. Further upside pressure could trigger the emergence of the golden cross, and the price may climb to its recent high above $1.46.
XRP Charts Flash Warning Signs for Downside Risk
The four-hour technical chart of XRP reports that the Moving Average Convergence Divergence line and signal line are found below the zero line, which shows its clear bearish phase. The price has been trending lower, with the sellers in control, and the momentum is staying weak.
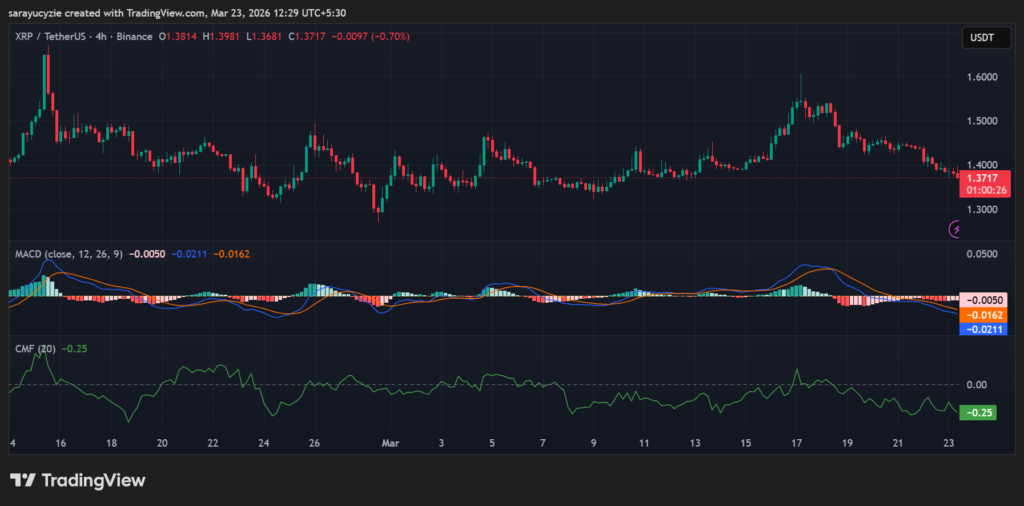
Besides, the money flow assessing indicator, the Chaikin Money Flow (CMF) value of -0.25, points to strong selling pressure. The capital is flowing out, which can keep the price under pressure. Notably, it may continue to move downside, unless the buyers step in to change the flow.
XRP’s daily Relative Strength Index (RSI) is at 26.89, deep in the oversold zone. The sellers have been in control, and the market is stretched on the downside. At these levels, a short-term bounce can happen, but the overall trend can stay weak unless momentum shifts.
Furthermore, the Bull Bear Power (BBP) reading of -0.0418 displays slight bearish pressure. But there is no strong momentum, with the market drifting lower rather than dropping hard. Unless the value moves even lower, this setup exhibits a mild sideways action.
Top Updated Crypto News
Saylor Signals New Bitcoin Buy as Strategy’s Bitcoin Holdings Fall Around 10%
0
0


 Administra todas tus criptomonedas, NFT y DeFi desde un solo lugar
Para comenzar, conecta de forma segura el portafolio que estés utilizando.


0
0

