Polkadot Price Prediction 2024-2030: A Bullish Pattern?

0
0


Key takeaways:
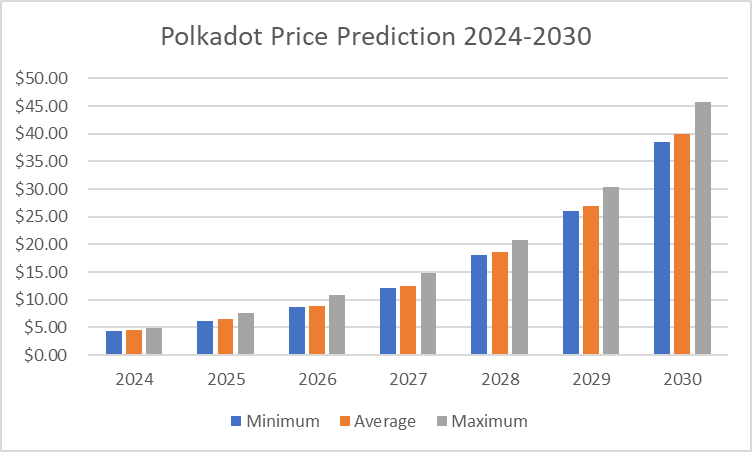
- Polkadot is predicted to reach a minimum and maximum value of $4.29 and $4.84, respectively in 2024.
- In 2027, the DOT price can reach a maximum price value of $14.83 with an average value of $12.52.
- The price of Polkadot is predicted to reach a maximum value of $45.80 in 2030.
Polkadot (DOT) has shown impressive growth and resilience in a volatile cryptocurrency market, supported by its strong multichain protocol architecture and investor confidence. A major contributor to this success is the Sinai Upgrade on its Acala Network, enhancing functionality and security.
With over 32 million transactions validated in October 2024 by the Polkadot Relay Chain, the network demonstrates significant activity and utility. A notable increase in unique wallets further signals growing user adoption and engagement, strengthening Polkadot’s position as a leading blockchain platform.
Will DOT reach new heights soon? Let’s get into the Polkadot price prediction for 2024-2030.
Overview
| Cryptocurrency | Polkadot |
| Token | DOT |
| Price | $3.79 |
| Market Cap | $5.74B |
| Trading Volume | $130.65M |
| Circulating Supply | 1.51B DOT |
| All-time High | $55.00 Nov 4, 2021 |
| All-time Low | $2.69 Aug 19, 2020 |
| 24-hour High | $3.83 |
| 24-hour Low | $3.67 |
Polkadot Price Prediction: Technical Analysis
| Price Prediction | $ 3.65 (-3.52%) |
| Volatility | 3.69% |
| 50-Day SMA | $ 4.29 |
| 14-Day RSI | 35.86 |
| Sentiment | Bearish |
| Fear & Greed Index | 69 (Greed) |
| Green Days | 13/30 (43%) |
| 200-Day SMA | $ 5.61 |
Polkadot price analysis: DOT sees notable breakout and bullish momentum
Key takeaways
- Polkadot (DOT) demonstrates significant market momentum. Its current price is $5.78, and it showcased a robust intraday gain of 5.06%.
- DOT’s daily chart shows potential for further gains, testing the psychological level around $6.00 if it breaches the $5.871 resistance.
- DOT is above crucial EMAs, indicating a bullish trend with immediate resistance near the recent high of $5.73.
Polkadot’s price analysis on November 18 shows that DOT demonstrated significant market momentum following a decisive breakout in its 4-hour and daily trading charts. With a current price of $5.78, DOT showcases a robust intraday gain of 5.06%. This upward movement reflects growing investor confidence and an enthusiastic response to recent network activities and broader cryptocurrency market trends. As new accounts burgeon — spiking to 5,188 daily — Polkadot’s appeal appears to escalate, affirming its resilience and growing presence in the digital asset space.
Polkadot daily chart technical analysis: DOT faces resistance at $6.0
Polkadot (DOT) has displayed notable market strength, evidenced by its recent price action on the daily chart. This upward movement is captured within the Keltner Channel, where the price challenges the upper boundary at $5.871. The push towards this resistance highlights the bullish sentiment currently driving the market. Additionally, the Moving Average Convergence Divergence (MACD) supports this bullish outlook, with the histogram expanding positively, suggesting continued upward momentum.

Examining support and resistance levels provides a deeper insight into potential market behavior. The current support, established by the KC Lower at $3.914, seems robust as the price has rebounded from lower levels in recent weeks. Meanwhile, the KC Basis line at $4.892 acts as a mid-point within the channel and could serve as a pivot in case of short-term pullbacks. On the resistance side, if DOT can sustainably breach the $5.871 upper Keltner Channel line, it could pave the way for further gains, potentially testing the next psychological level around $6.00.
The Relative Strength Index (RSI) at 65.73 indicates a strong buying interest without veering into the overbought territory, which could allow more room for price appreciation before any significant pullback occurs. This sentiment is bolstered by the increasing MACD values and the positive signal line crossover, reflecting growing market enthusiasm for DOT. This technical setup suggests that if DOT maintains its position above the crucial KC Basis and continues to press against upper resistance levels, the current bullish trend could extend, making it a pivotal asset to watch in the ongoing market cycle.
DOT 4-hour chart analysis: DOT teases upward movement, climbing above crucial moving averages
The Polkadot (DOT) market on the 4-hour chart shows a price of $5.833 after experiencing a slight dip amidst an overall bullish trend observed since early November. The 20, 50, 100, and 200 EMAs are stacked in ascending order, reflecting a bullish market setup where shorter-term averages are above longer-term averages. The price hovering above these EMAs supports a generally positive outlook for DOT in the short term.

Examining the Stochastic RSI, the value is at 44.46, suggesting that the asset is neither overbought nor the oversold territory, which could imply a stabilization phase following recent gains. This moderation in the Stochastic RSI might lead to potential consolidation or slight retracement, especially if buyers take a breather before pushing the price further. The presence of a high near $5.73 and the current price’s proximity to this point shows that DOT is testing a crucial resistance level, which, if breached, could open the way for higher price levels.
Looking ahead, the support levels to watch are around $5.248 and $4.917, where the 100 and 200 EMAs lie, respectively. These levels could serve as critical junctures for DOT, providing a rebound platform in the event of price pullbacks. On the upside, the immediate resistance is near the recent high of $5.73. A definitive break above this resistance could validate the ongoing bullish sentiment and drive prices toward the $6.00 psychological mark, aligning with historical resistance levels and setting a new short-term target for bullish traders.
What to expect from Polkadot price analysis
Polkadot’s recent performance reveals a clear bullish trend. After overcoming a downward trajectory that marked its summer activity, DOT’s price began to climb in late October. This positive shift corresponds with a breakout from a descending channel, identifiable on the 3-day chart. The upper boundary of this channel, formerly acting as resistance around $4.15 to $4.50, now serves as a critical support zone, fostering the potential for further upward movements. Resistance near the $6.10 mark could soon give way, setting the stage for a target range of $8.80 to $9.00, highlighting an enticing possible upside of 103.83%.
Polkadot Technical Indicators: Levels And Action
Daily Simple Moving Average (SMA)
| Period | Value ($) | Action |
| SMA 3 | $ 4.00 | SELL |
| SMA 5 | $ 4.07 | SELL |
| SMA 10 | $ 4.04 | SELL |
| SMA 21 | $ 4.26 | SELL |
| SMA 50 | $ 4.29 | SELL |
| SMA 100 | $ 4.48 | SELL |
| SMA 200 | $ 5.61 | SELL |
Daily Exponential Moving Average (EMA)
| Period | Value ($) | Action |
| EMA 3 | $ 4.18 | SELL |
| EMA 5 | $ 4.21 | SELL |
| EMA 10 | $ 4.23 | SELL |
| EMA 21 | $ 4.26 | SELL |
| EMA 50 | $4.39 | SELL |
| EMA 100 | $ 4.79 | SELL |
| EMA 200 | $5.44 | SELL |
What to expect from Polkadot price analysis: Will DOT hit the $22 target?
Polkadot’s price structure suggests that a breakout could be imminent, with technical indicators pointing towards a potential bullish reversal. The daily and 4-hour charts both reflect consolidation within a tight range, a common precursor to breakout moves. If DOT manages to break above the $4.14 resistance level, it could begin a rally toward higher levels. The first target would be $5.00, with further resistance near $7.00, and ultimately, a long-term target of $22 if bullish momentum accelerates.
However, if DOT fails to maintain support at $3.69, it may see further downside. A breakdown below this level could expose the price to a decline toward the $3.50 and $3.00 support zones.
Is Polkadot a good investment?
Investing in Polkadot offers advantages for those interested in advanced blockchain solutions. Its multi-chain framework enables interoperability and scalability through its innovative relay chain and parachain architecture, improving transaction efficiency. The platform’s para-chain slot auction system allows democratic participation, and holding DOT tokens grants governance rights, giving investors a voice in the network’s future. These features make Polkadot a strategic addition for investors looking to capitalize on cutting-edge blockchain technology and the potential for future digital transformation.
Will Polkadot recover?
Polkadot (DOT) shows signs of recovery with a recent upward trend. If positive market conditions continue, Polkadot has the potential for further recovery.
Will Polkadot reach $10?
Yes, Pollkadot is projected to reach up to $10 by 2026 according to the long-term predictions.
Will Polkadot reach $100?
Reaching $100 for Polkadot (DOT) is highly ambitious and unlikely in the near term due to its current price level in the year 2030 is $45.80.
Does Polkadot have a good long-term future?
Based on the recent upward movement of DOT, Polkadot has a promising long-term future.
Recent news/opinion on Polkadot
- Polkadot announces Kylix Finance integration to enable multi-chain DeFi with Ethereum and Solana, launching new apps on Polkadot.
- Polkadot ecosystem dashboard goes live on Token Terminal
Polkadot Price Prediction November 2024
For November 2024, Polkadot (DOT) is expected to exhibit a range of price movements. The potential low is $3.77, while the average price might be around $4.41. On the higher end, DOT could reach up to $8.22.
| Month | Potential Low | Potential Average | Potential High |
| November | $3.77 | $4.41 | $8.22 |
Polkadot Price Prediction 2024
By 2024, DOT is expected to have a minimum value of $4.29 and a maximum value of $4.84. The coin’s average value could be around $4.50.
| Polkadot Price Prediction | Potential Low | Potential Average | Potential High |
| 2024 | $4.29 | $4.50 | $4.84 |
Polkadot Price Predictions 2025-2030
| Year | Minimum Price | Average Price | Maximum Price |
| 2025 | $6.25 | $6.47 | $7.59 |
| 2026 | $8.64 | $8.96 | $10.90 |
| 2027 | $12.16 | $12.52 | $14.83 |
| 2028 | $18.05 | $18.55 | $20.85 |
| 2029 | $26.03 | $26.95 | $30.43 |
| 2030 | $38.58 | $39.93 | $45.80 |
Polkadot price prediction 2025
According to the Polkadot price forecast for 2025, DOT could reach a maximum price of $7.59, a minimum price of $6.25 in 2025, and an average forecast price of $6.47.
Polkadot price prediction 2026
The price of Polkadot is predicted to reach a minimum value of $8.64 in 2026. Per expert analysis, DOT token could reach a maximum value of $10.90, and an average trading price of $8.96.
Polkadot price prediction 2027
Per the DOT price prediction for 2027, Polkadot is predicted to reach a minimum price level of $12.16, a maximum price of $14.83, and an average trading price of $12.52.
Polkadot price prediction 2028
The price of Polkadot is predicted to reach a minimum value of $18.05 in 2028. Traders can anticipate a maximum value of $20.85 and an average trading price of $18.55.
Polkadot price prediction 2029
According to the Polkadot price prediction for 2029, DOT could reach a maximum price of $30.43, a minimum price of $26.03 in 2025, and an average forecast price of $26.95.
Polkadot price prediction 2030
In 2030, the price of Polkadot is predicted to reach a minimum level of $38.58. Should positive market sentiment persist, DOT can attain a maximum price of $45.80 and an average trading price of $39.93.
Polkadot market price prediction: Analysts’ DOT price forecast
| Firm Name | 2024 | 2025 |
| Gov.Capital | $6.68 | $15.53 |
| DigitalCoinPrice | $8.29 | $9.71 |
| Coincodex | $6.37 | $14.40 |
Cryptopolitan’s Polkadot (DOT) Price Prediction
Per Cryptopolitan’s DOT price forecast, the coin’s price is projected to trend upward, reaching as high as $5 in 2025, and making an attempt to reclaim $30 by 2030.
Polkadot historic price sentiment
- Looking at the Polkadot price action over the past years, we can see that its price has been heavy since the beginning of 2021. After spending most of the second half of 2020 trading around $4-$5, the price broke above the previous all-time high of $7 on December 29 and quickly reached the Polkadot price projection of $10.
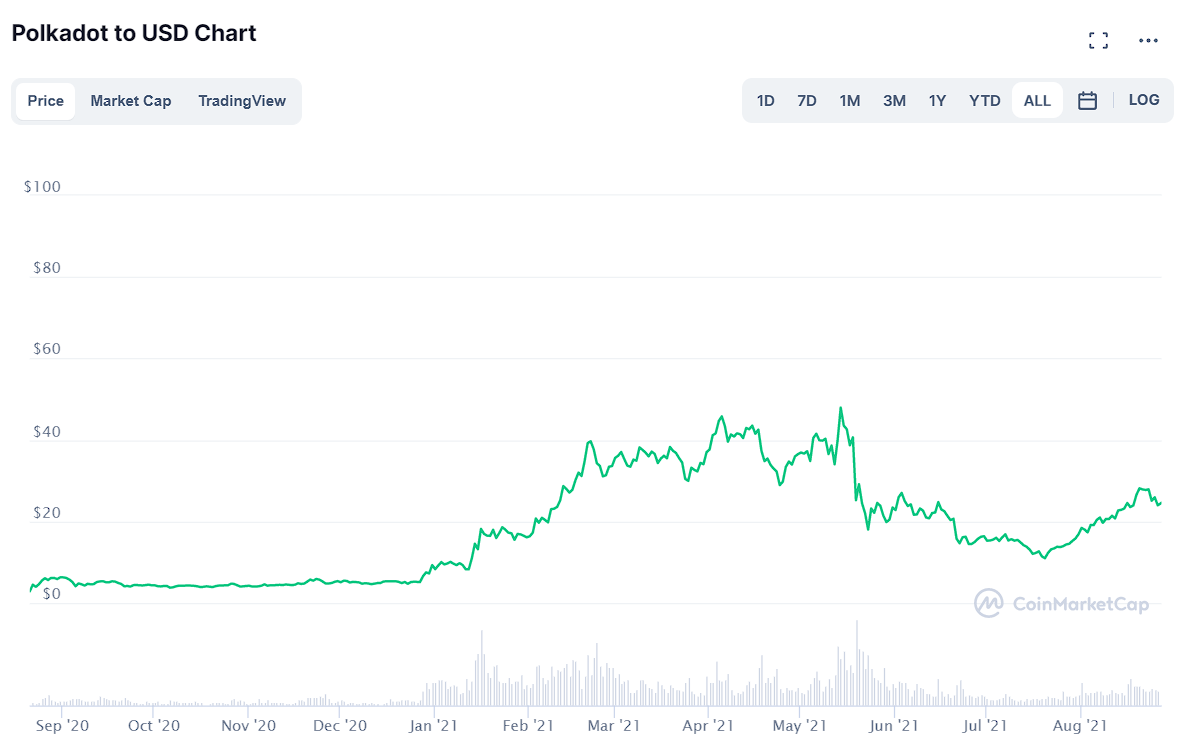
Historical price of Polkadot by Coinmarketcap
- This Polkadot prediction allowed more crypto bulls to jump into the bullish trend, leading to another push after a retest of the $7 mark as support.
- On January 16, the DOT reached the highest day price of just over $19. From there, the bullish momentum paused for several days, and the Polkadot price consolidated for more than a week with an average Polkadot price prediction of around $17.
- At the same time, the DOT price increased for many analysts, creating more interest in the Polkadot ecosystem. Polkadot’s forecast frequently mentioned the $40 mark as the next target for the following weeks.
- This Polkadot price prediction was later reached as the crypto rallied further with the Bitcoin price in February and eventually peaked around the maximum price of $42.
0
0


 한 곳에서 모든 암호화폐, NFT 및 DeFi 를 관리하세요
시작하는 데 사용하는 포트폴리오를 안전하게 연결하세요.