Stellar (XLM) Up 6% This Week, but Bearish Divergence Suggests a Reversal Ahead

0
0

Stellar’s XLM token has climbed 6% over the past week as the broader crypto market shows signs of recovery. At press time, the altcoin trades at $0.28.
However, a key momentum indicator is flashing warning signals, suggesting the rally may be short-lived. Should XLM holders brace for decline?
XLM Struggles to Hold Gains
A bearish divergence has emerged with XLM’s Chaikin Money Flow (CMF), indicating weakening buying pressure despite the recent price increase. While XLM’s price has climbed in the past week, its CMF has fallen, remaining below the zero line at -0.10 at press time.
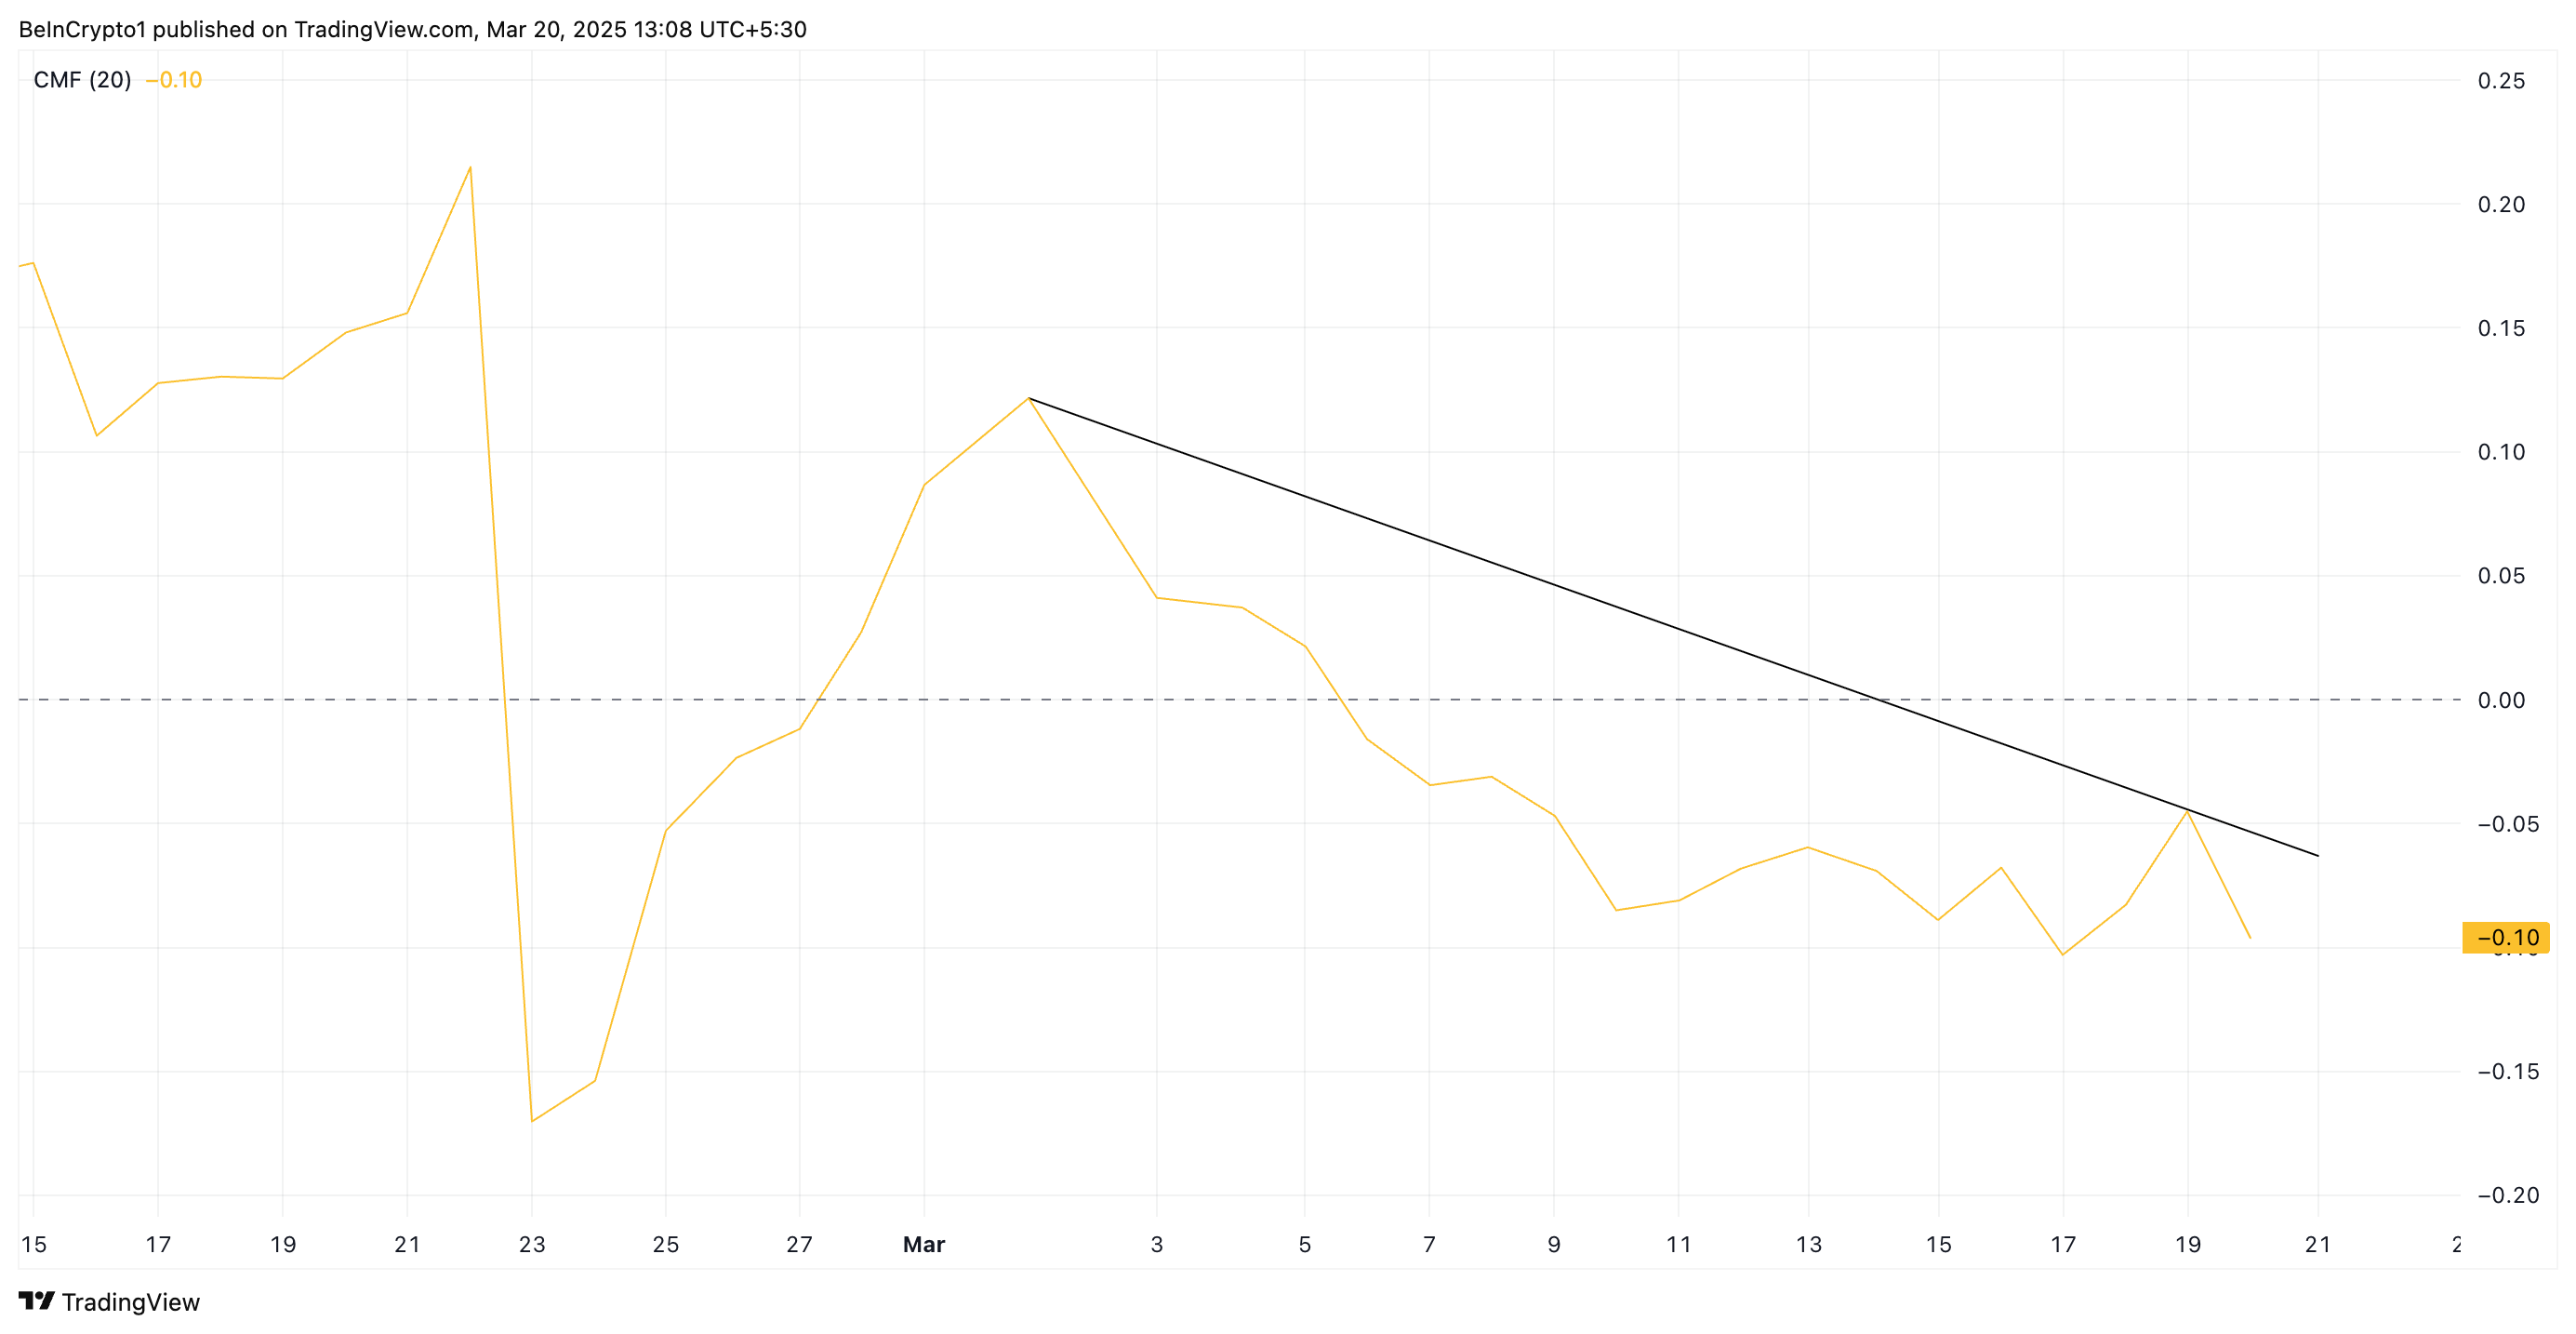 XLM CMF. Source: TradingView
This trend occurs when an asset’s price rises while its CMF declines, signaling that fewer investors are supporting the rally with actual capital inflows. As a result, the uptrend may be unsustainable, increasing the risk of a reversal.
If the divergence persists, XLM’s selling pressure could build up, increasing the likelihood of a price reversal or correction in the near term.
Moreover, XLM’s funding rate has flipped negative for the first time in six days, highlighting the growing bearish bias against the altcoin. At press time, the figure is -0.0018%.
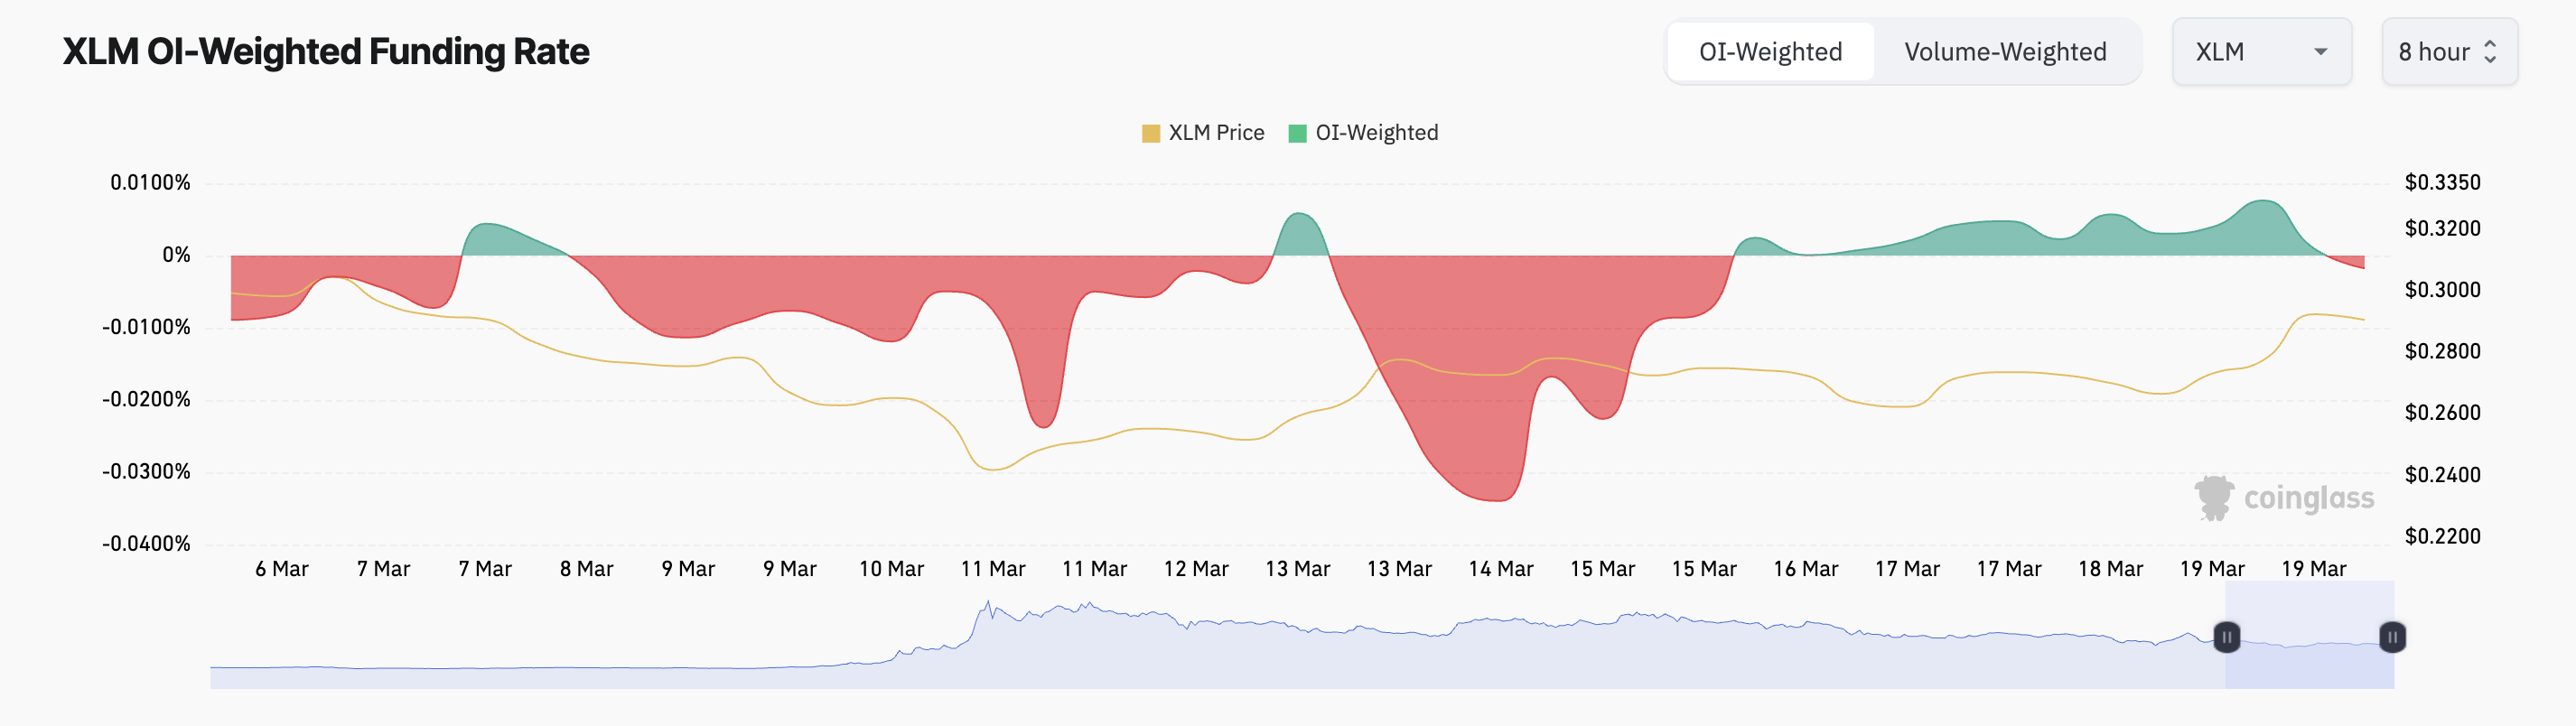 XLM Funding Rate. Source: Coinglass
The funding rate is a periodic fee exchanged between long and short traders in perpetual futures contracts, reflecting market sentiment. When it turns negative, short positions are dominant, indicating bearish sentiment as traders increasingly bet on a price decline.
As more traders bet on XLM’s price decline, demand will continue to weaken, and downward pressure on its price will increase.
XLM Down Over 50% Since November—Is a Reversal on the Horizon?
On the daily chart, XLM trades within a descending parallel channel. It has remained within this bearish channel since reaching a three-year peak of $0.63 last November. Now trading at $0.28, the altcoin’s price has since plunged 55%.
With strengthening bearish pressure, XLM risks falling below the channel’s lower trendline. If this happens, the altcoin could trade at $0.23.
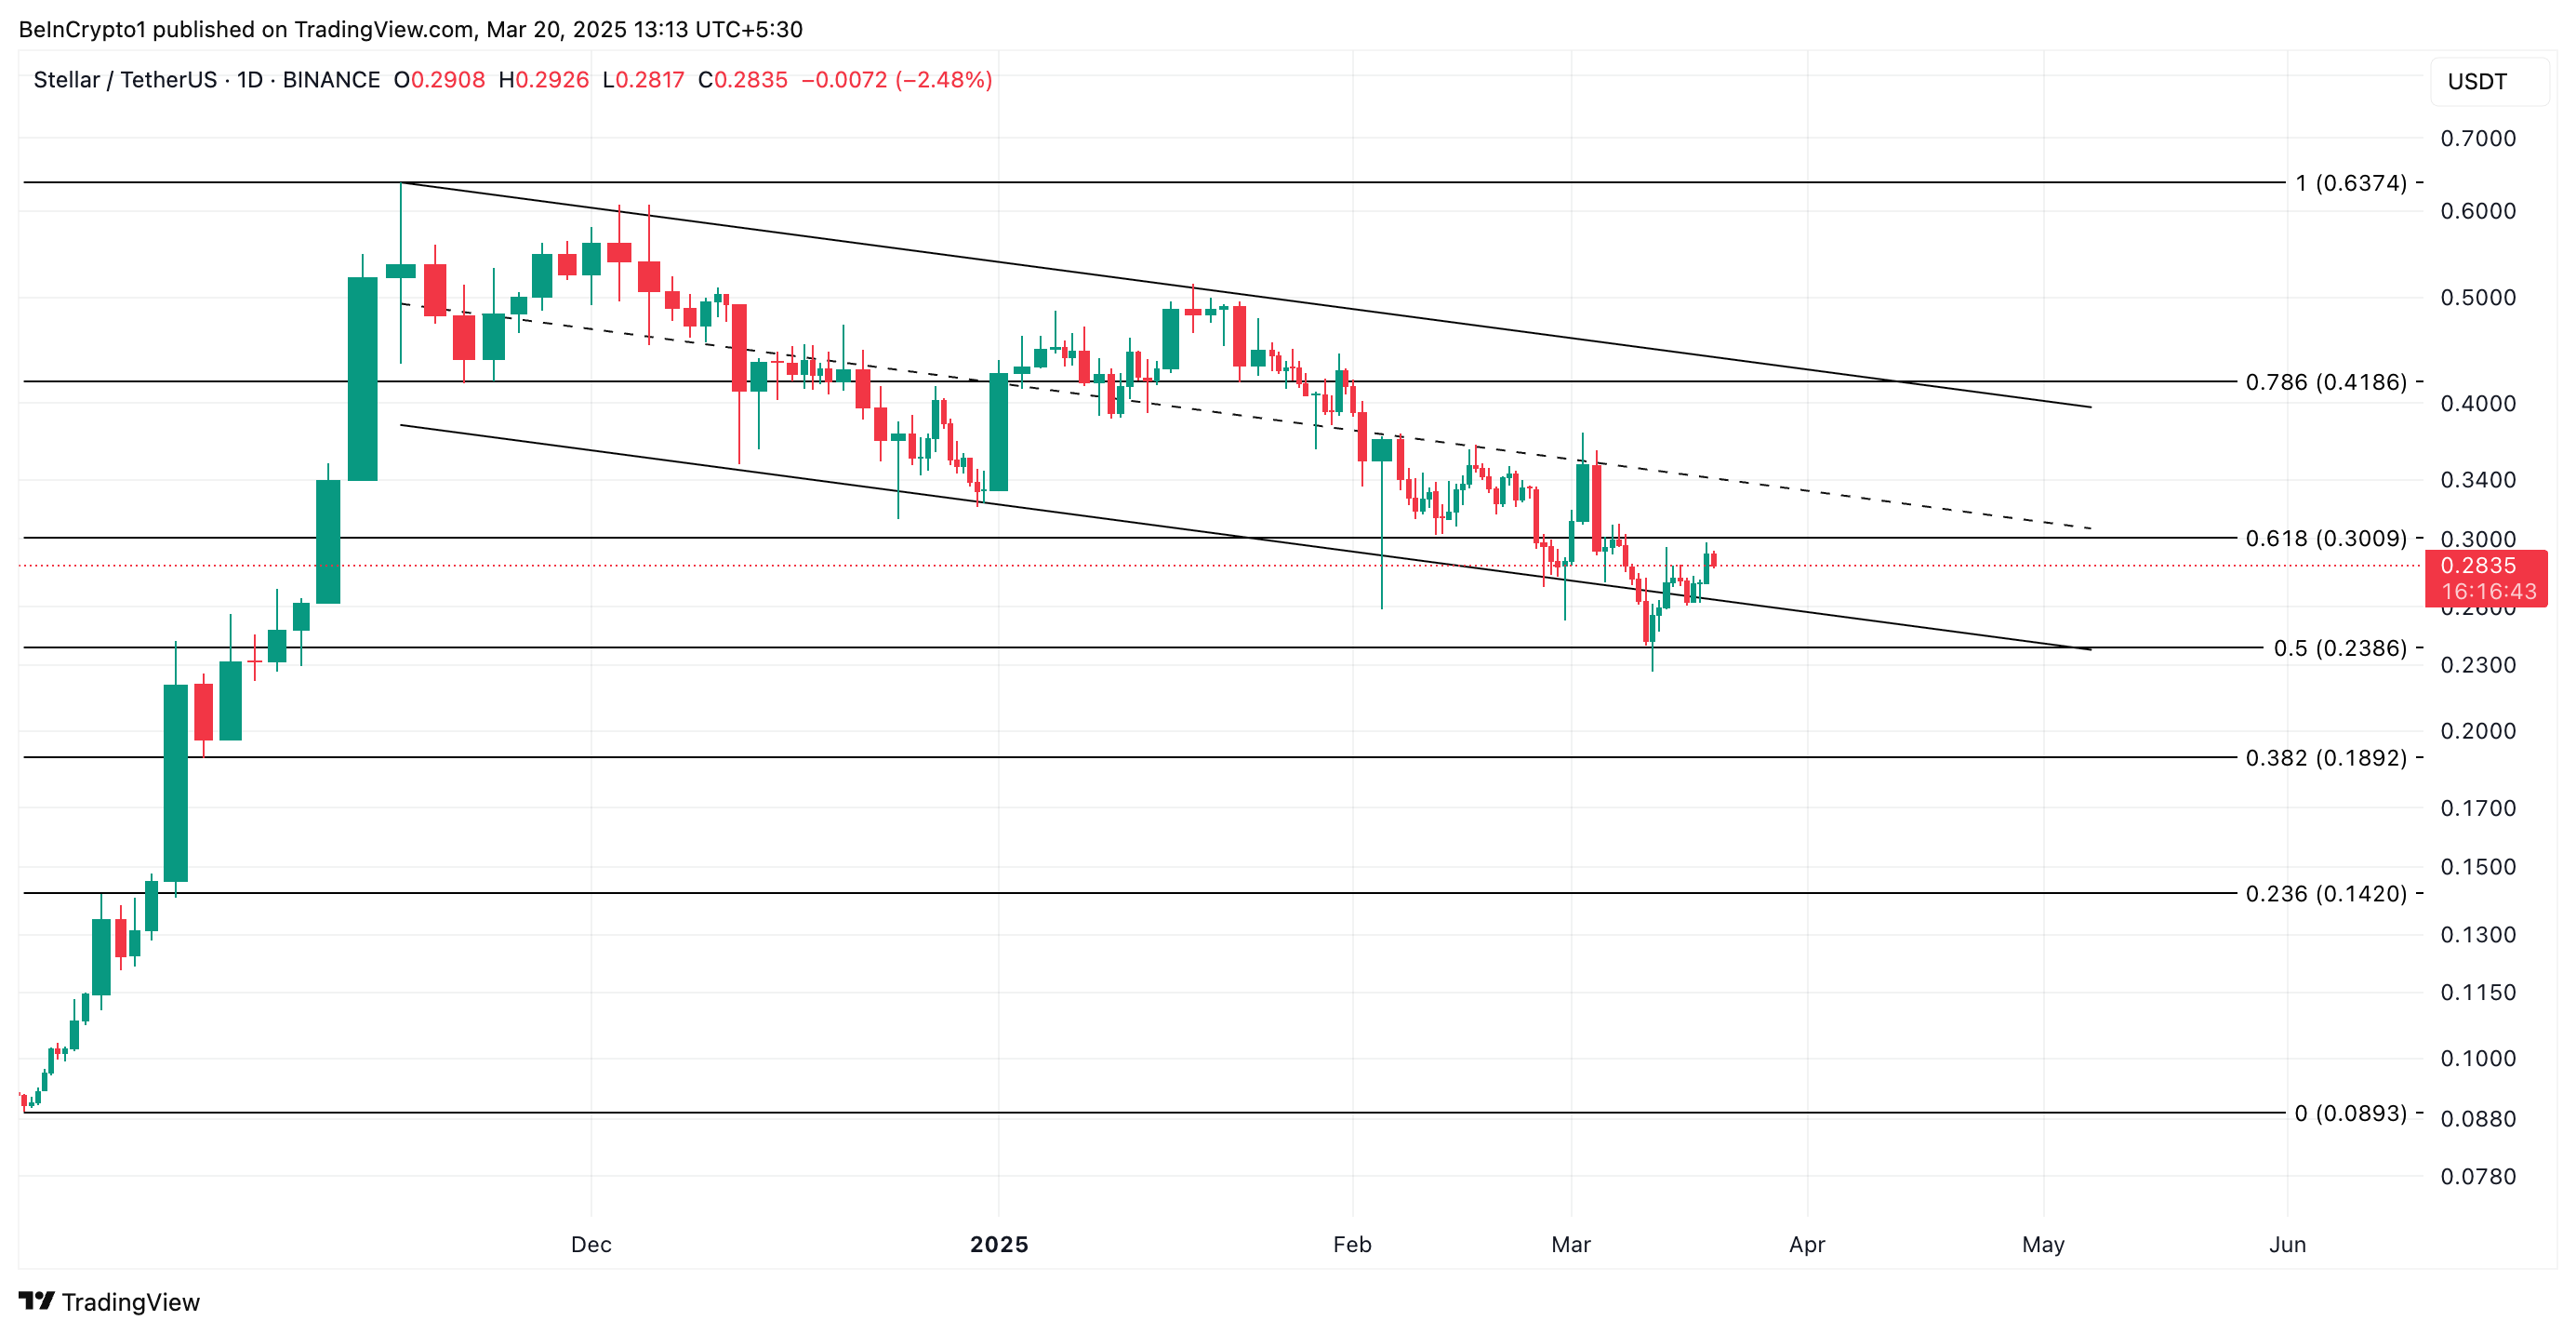 XLM Price Analysis. Source: TradingView
Conversely, if XLM accumulation resumes, its price could rally past the resistance at $0.30. If succesful, it could attempt to reach $0.41.
0
0


 한 곳에서 모든 암호화폐, NFT 및 DeFi 를 관리하세요
시작하는 데 사용하는 포트폴리오를 안전하게 연결하세요.