Pi Network Price Prediction 2026–2032: Will Pi Recover or Crash?

0
0

Key Takeaways:
- Pi price faces volatility around $0.2.
- Our Pi network price prediction anticipates the Pi price to reach a maximum level of $0.3444 by 2026.
- In 2032, the Pi price prediction expects Pi to reach a maximum level of $3.19.
Pi Network is a social crypto and developer ecosystem focused on mass accessibility and real-world use, founded by Stanford PhDs Dr. Nicolas Kokkalis and Dr. Chengdiao Fan. As 2026 begins, Pi has transitioned from a long-running experiment into a live Layer-1 blockchain with open transfers, exchange liquidity, and a growing app ecosystem. In the past year 2025, Pi hit an all-time high near $2.98 after Open Mainnet launched, then fell to a low around $0.1585 in October as large token unlocks increased supply, leaving the price in the low-$0.20 range.
Despite the volatility, 2025 marked major progress: Open Mainnet went live, exchange listings expanded, Pi Network Ventures launched a $100 million ecosystem fund, AI-powered KYC scaled up, and developer activity grew through hackathons, Testnet DEX and AMM tools, Map of Pi 2.0, and broader merchant adoption, signaling a shift from speculation toward real usage.
In this Pi Network price prediction, we discuss these developments with major technical levels and the model of exponential supply of Pi that is in decline to determine whether 2026–2032 favors a sustained recovery or further downside.
Overview
| Cryptocurrency | Pi Network |
| Ticker Symbol | Pi |
| Price | $0.2052 |
| Price Change 24h | +0.45% |
| Market Cap | $1.71B |
| Circulating Supply | 8.37B PI |
| Trading Volume 24h | $7.96M |
| All-Time High | $2.98, Feb 26, 2025 |
| All-Time Low | $0.1585, Oct 11, 2025 |
Pi Network Price Prediction: Technical Analysis
| Metric | Value |
| Current Price | $0.2052 |
| Price Prediction | $ 0.1524 (-25.10%) |
| Fear & Greed Index | 20 (Extreme Fear) |
| Sentiment | Bearish |
| Volatility | 4.89% (Medium) |
| Green Days | 11/30 (37%) |
| 50-Day SMA | $ 0.2278 |
| 200-Day SMA | No Data |
| 14-Day RSI | 42.19 (Neutral) |
Pi Price Analysis
TL;DR Breakdown:
- Pi is trading around $0.2049 and $0.2052, slightly up over the last 24 hours, and holding above the $0.20 level.
- The daily RSI (14) is 43.25, still below 50, while MACD is still below zero, showing momentum is improving slowly, but buyers are not strong yet.
- Support is around $0.2042 and $0.200. Resistance is around $0.2056, then $0.206–$0.207, then $0.215 and $0.22.
As of January 2, 2026, Pi Network is trading sideways today, with price holding in a tight range just above the $0.20 level as buyers and sellers stay evenly matched. Pi is holding near $0.205, with a market cap around $1.71B and 24-hour volume near $7.96M, which is still light and shows limited conviction. The market looks calm, with Pi stabilizing rather than starting a clear upward move.
Pi Network 1-day price chart analysis
The 1-day chart shows small-bodied candles, showing consolidation rather than a strong move in either direction. Price is basically just above the mid-$0.2052 area with no clear follow-through from buyers or sellers.
The RSI (14) is 43.25, with its signal line near 40.96, which keeps momentum below the neutral 50 mark and suggests buyers are still cautious. Selling pressure isn’t aggressive, but RSI needs to push back toward the high-40s/50 area to show stronger demand.
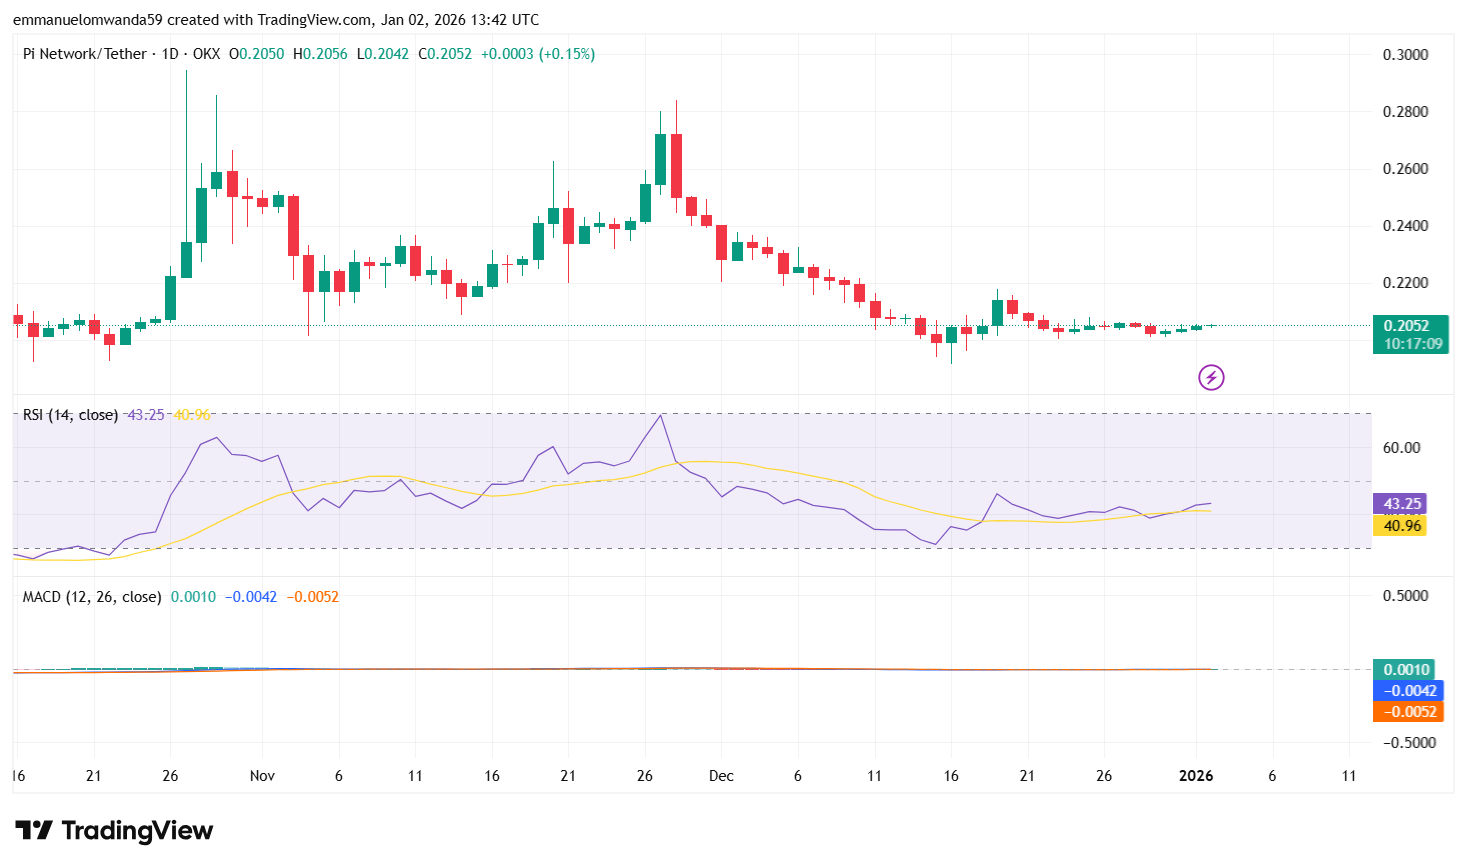
On the MACD (12, 26), the histogram is +0.0010, while the MACD line is −0.0042 and the signal line is −0.0052. Both lines being below zero means the broader trend is still bearish, but the positive histogram shows the downside pressure is easing and the market is trying to stabilize. Support is around $0.204 and then $0.200, while resistance is near $0.206 and $0.210.
Pi/USD 4-Hour Price Analysis
On the 4-hour chart, Pi is trading around $0.2051 and is slightly higher on the session, with the latest candle showing O $0.2049, H $0.2053, L $0.2048, C $0.2051. Price action is still tight, but it’s slowly grinding upward from the late-December dip, with candles holding above the mid-$0.20 area instead of slipping back under it.
The RSI (14) is 59.42, with its signal line near 53.00, which keeps momentum above 50 and shows buyers have more control than earlier in the week. It’s not an aggressive rally, but it does suggest the market is leaning slightly positive on this timeframe.
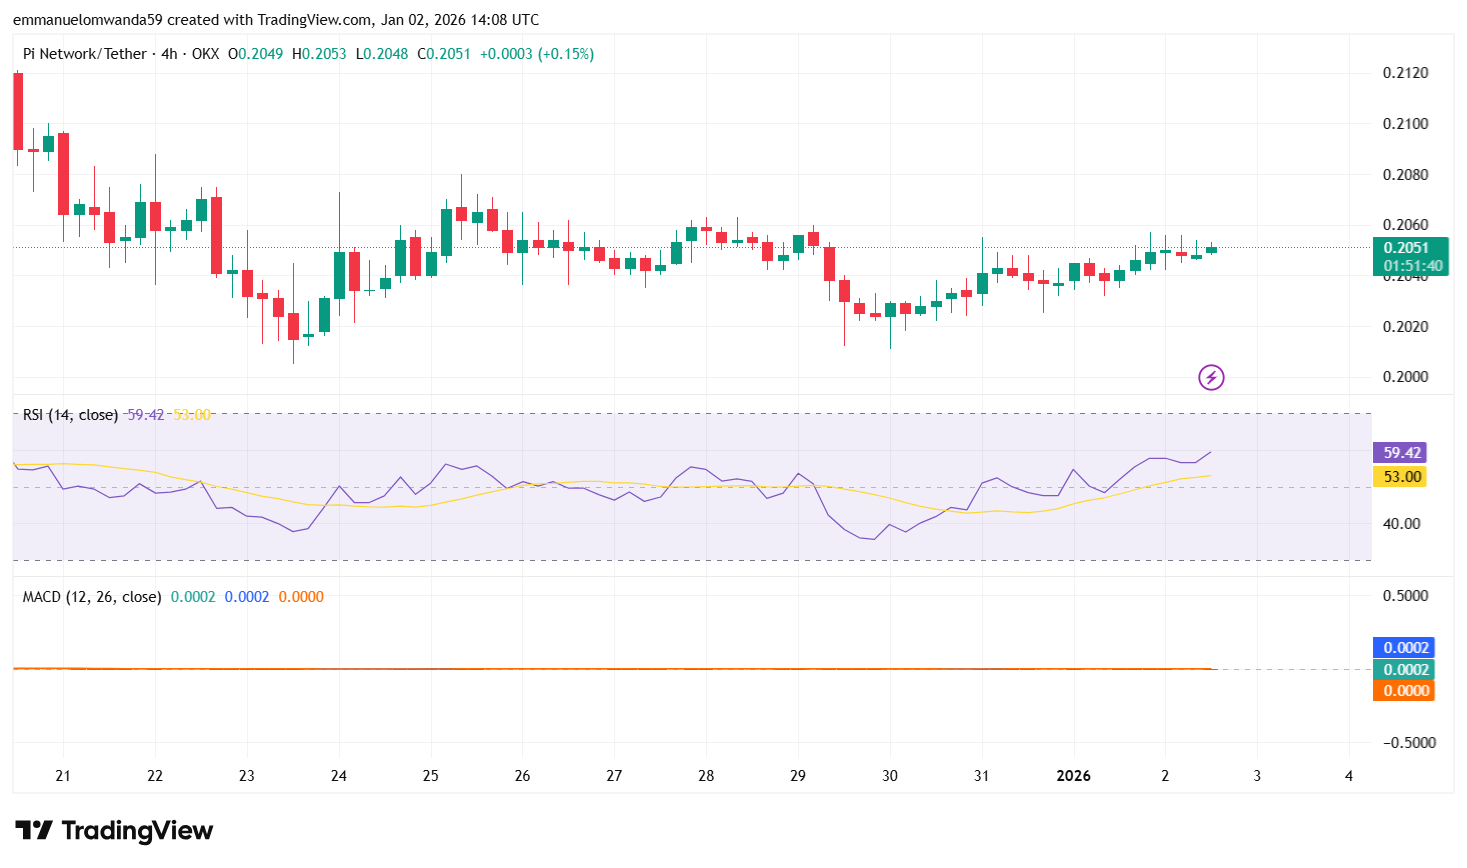
On the MACD (12, 26), the values are MACD 0.0002, signal 0.0000, and histogram 0.0002. Because these readings are at or just above the zero line, it means bearish pressure has faded, and momentum is mildly positive, but the numbers are small, so the move is still weak and could stay range-bound. Support is around $0.204 and $0.202, while resistance is near $0.206 and $0.208.
Pi Network Price Prediction: Levels and Action
Daily Simple Moving Average (SMA)
| Period | Value | Action |
| SMA 3 | $0.2707 | SELL |
| SMA 5 | $0.2354 | SELL |
| SMA 10 | $0.2207 | SELL |
| SMA 21 | $0.2157 | SELL |
| SMA 50 | $0.2278 | SELL |
| SMA 100 | $0.2377 | SELL |
Daily Exponential Moving Average (EMA)
| Period | Value | Action |
| EMA 3 | $0.2112 | SELL |
| EMA 5 | $0.2185 | SELL |
| EMA 10 | $0.2396 | SELL |
| EMA 21 | $0.2782 | SELL |
| EMA 50 | $0.3429 | SELL |
| EMA 100 | $0.4387 | SELL |
What to expect from the Pi price analysis next?
If Pi keeps holding the $0.20 support, the most likely move is more sideways trading with small bounces toward the $0.206–$0.21 resistance area. If it drops and closes clearly below $0.20, the downside risk increases, and the price could slide toward the next lower zone before buyers step back in.
Is Pi a Good Investment?
The Pi Network is expected to remain within the price range, and further downside remains likely unless it breaks and holds above the $0.3610 resistance level with rising volume. Traders should watch for a potential test of lower support zones if current trends persist. A reversal would require the RSI to climb above 50 and the MACD to cross bullishly, neither of which has happened yet. In the short term, caution dominates the market outlook for Pi.
Why is PI’s price down today?
PI is slightly up because supply pressure is easing: today’s large unlock is among the last big daily releases before unlocks drop, and some PI has moved off exchanges, reducing immediate sell pressure in a thin market. On the chart, a mild technical rebound (MACD turning up and RSI still not overbought) is helping, but unclear roadmap sentiment is still limiting a stronger move.
Will Pi Price Reach $5?
At the current pace of development and given its total PI supply circulating supply of over 8 billion PI, Pi Network’s value is unlikely to reach $5 in the near term. Multiple technical quantitative indicators and fundamental factors, such as delayed mainnet launch and maximum supply constraints, suggest that Pi’s price may fluctuate within lower ranges before any major uptrend. A $5 target would require sustained adoption, significant on-chain activity, and strong market demand that is not yet present.
Will Pi Reach $10?
Reaching $10 would represent a massive increase in Pi’s market cap, something that is not expected soon under current crypto market conditions. Analysts suggest that even optimistic forecasts place this milestone more than a decade away, if at all. Investors should treat such projections as speculative investment advice and conduct their own research before making investment decisions, as Pi remains a high-risk asset with uncertain long-term value.
Recent Pi News/Opinions
Pi Network’s Core Team published a 2025 recap highlighting milestones such as February’s Open Network launch, AI integrations, and ongoing KYC progress.
Pi Price Prediction January 2026
In January 2026, the price of Pi is expected to be at around a minimum of $0.204. Pi price can reach a maximum of $0.2214 with the average price of $0.2153 in USD.
| Pi Price Prediction | Potential Low | Potential Average | Potential High |
| Pi Price Prediction January 2026 | $0.204 | $0.2153 | $0.2214 |
Pi Price Prediction 2026
The price of 1 Pi is expected to reach a minimum level of $0.2047 in 2026. The PI price can reach a maximum level of $0.3444 with the average cost of $0.2746 throughout 2026.
| Pi Price Prediction | Potential Low ($) | Potential Average ($) | Potential High ($) |
| Pi Price Prediction 2026 | $0.2047 | $0.2746 | $0.3444 |
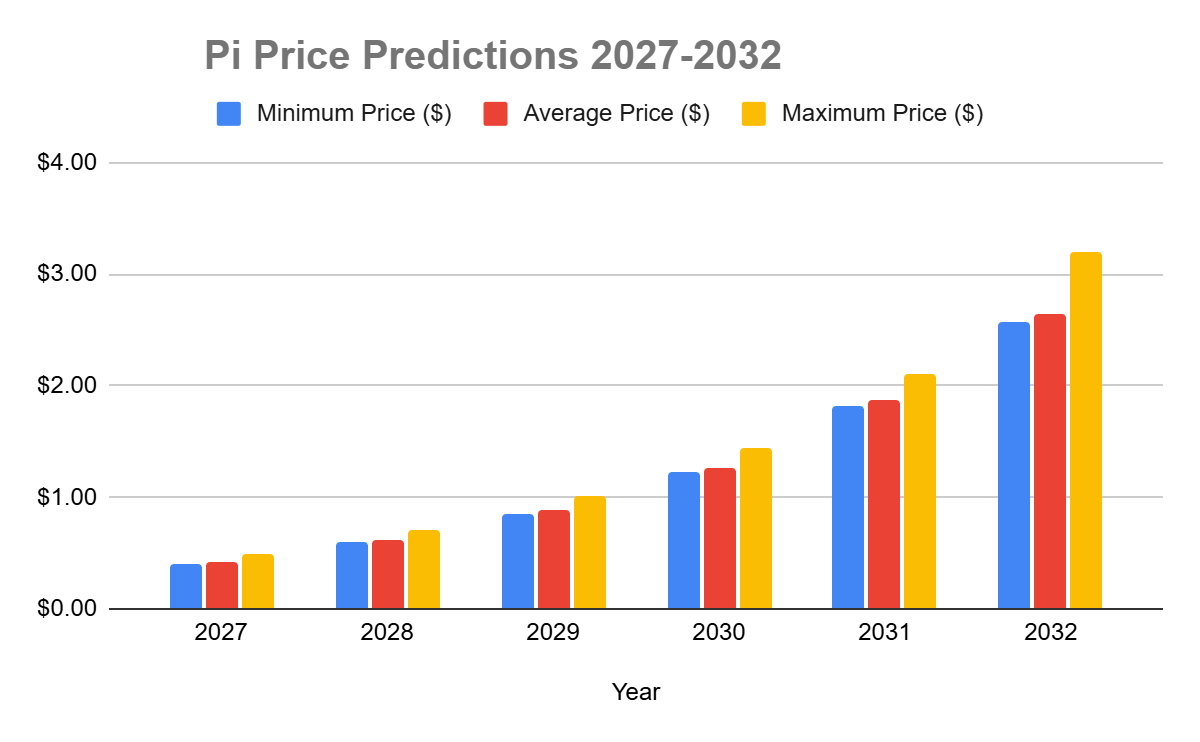
Pi Price Predictions 2027-2032
| Year | Minimum Price ($) | Average Price ($) | Maximum Price ($) |
| 2027 | $0.4097 | $0.4245 | $0.4969 |
| 2028 | $0.5938 | $0.6108 | $0.7022 |
| 2029 | $0.8544 | $0.8789 | $1.02 |
| 2030 | $1.23 | $1.26 | $1.45 |
| 2031 | $1.81 | $1.87 | $2.10 |
| 2032 | $2.57 | $2.64 | $3.19 |
Pi Price Prediction 2027
Pi price is forecast to reach a lowest possible level of $0.4097 in 2027. The PI price could reach a maximum possible level of $0.4969 with the average forecast price of $0.4245.
Pi Price Prediction 2028
In 2028, the price of Pi is predicted to reach a minimum level of $0.5938. The PI price can reach a maximum level of $0.7022 with the average trading price of $0.6108.
Pi Price Prediction 2029
The price of Pi is predicted to reach a minimum level of $0.8544 in 2029. The Pi price can reach a maximum level of $1.02 with the average cost of $0.8789 throughout 2029.
Pi Price Prediction 2030
The Pi price is forecast to reach a lowest possible level of $1.23 by 2030. The PI price could reach a maximum possible level of $1.45, with the average forecast price of $1.26.
Pi Price Prediction 2031
In 2031, the price of Pi is forecasted to be at around a minimum value of $1.81. The Pi price value can reach a maximum of $2.10, with the average trading value of $1.87 in USD.
Pi Price Prediction 2032
In 2032, the price of Pi is expected to reach a minimum price value of $2.57. The PI price can reach a maximum price value of $3.19, with the average value of $2.64.
Pi Network Price Prediction: Analysts’ Pi Price Forecast
| Firm Name | 2026 | 2027 |
| Coincodex | $0.2847 | $0.2847 |
| DigitalCoinPrice | $0.2114 | $1.23 |
| Changelly | $0.2137 | $2.30 |
Cryptopolitan’s Pi Price Prediction
At Cryptopolitan, we remain constructively bullish on Pi’s long-term outlook, despite weak short-term momentum. Investors are keenly watching the Pi Network market to discern potential movements in its future price trends and analyse shifts in Pi Network’s price, seeking independent professional consultation for informed decisions.
In 2026, Pi’s price is forecast to reach a low of $0.2047. The PI price could reach a maximum possible level of $0.3444, with the average forecast price of $0.2746.
Pi Historic Price Sentiment
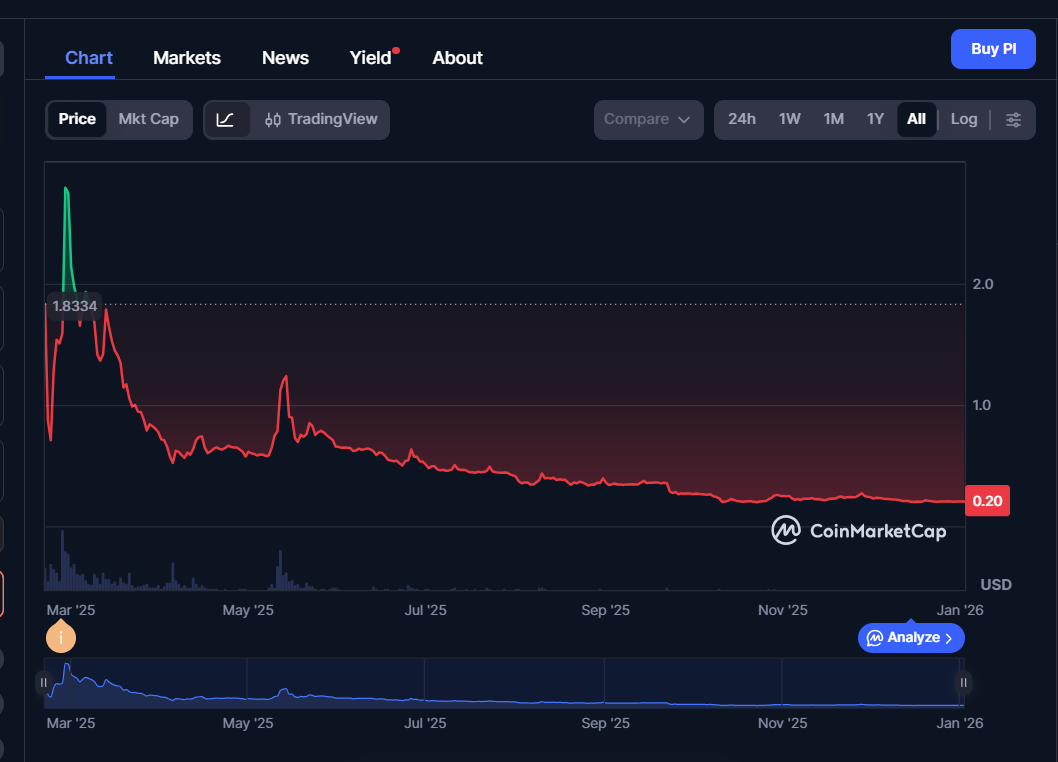
- Pi Network launched in 2019 with a mobile mining model. During these years, it operated in a closed network with no official market price, as tokens couldn’t be traded externally.
- In 2023, the token was still largely unlisted on major exchanges. Price remained speculative, often appearing in unofficial markets with wide variances.
- By early 2024, the first signs of market traction were still limited. Prices ranged between $0.60 and $1.00 over-the-counter or in the sandbox.
- In February 2025, official market traction began. Pi hit its all-time high (ATH) of $2.98 on February 26 after initial listings or increased public speculation.
- In March 2025, the price dropped significantly when Pi Network had an unstable phase after the expiration of its final KYC verification deadline. Traded between $1.85 and $0.90, gradually declining through the month.
- In April 2025, Pi Network hit its all-time low (ATL) of $0.4012 on April 5. Prices ranged between $0.40 and $0.65, showing weak recovery momentum.
- In May 2025, the Pi Network surged toward $1.67 but failed to maintain its buying demand. This resulted in a significant downward pressure toward $0.75 by the end of the month.
- In June, Pi showed a sideways-to-bullish movement, with the potential to break above $0.66 and target $0.72.
- At the start of July 2025, Pi Network faced high volatility as massive token unlocks triggered strong selling pressure, keeping prices around the $0.458–$0.50 range.
- On July 19, 2025, PIUSDT declined slightly to $0.4412, reflecting short-term bearish pressure.
- On July 26, 2025, PIUSDT continued to hover under pressure around $0.4409, staying within a tight trading range as momentum remained subdued.
- for August 2, 2025. Pi traded at $0.3496, still under pressure and at its all-time low.
- On August 6, 2025, Pi Network traded at around $0.3410, showing moderate consolidation with weak momentum and limited price movement.
- On August 9th, Pi/USDT went up from its early August low of $0.3766 and traded around $0.4103.
- August 17th, 2025, the Pi Network (PI) traded at $0.387, showing slight movement between support at $0.383 and resistance at $0.390.
- On August 21, Pi Network (PI) traded near $0.366, showing a modest 1.39% gain as buyers attempted a short-term recovery.
- On September 2, 2025, Pi network traded around $0.34, just above its past month’s August all-time low of $0.3304.
- On September 22, 2025, Pi crashed to a new all-time low (ATL) of $0.2234, marking a –92% drop from its February ATH and reflecting heavy sell-side pressure from token unlocks and weak demand.
- Pi rebounded slightly, to trade between $0.25 and $0.28 through late September, though resistance at $0.30 continued to hold firmly.
- At the start of October 2025, Pi trades at $0.2718, but is still struggling under bearish sentiment as buyers attempt to defend support above $0.26 while momentum indicators suggest only a weak recovery.
- On October 11, 2025, Pi Network hit a new all-time low of $0.1585, reflecting the peak of a prolonged market crash and severe selling pressure.
- On October 15, 2025, Pi Network (PI) stabilized slightly, trading around $0.1884, as short-term buyers stepped in following the sharp October 11 crash.
- On October 28, 2025, PI attempted a short rebound toward $0.238, but failed to hold gains, slipping back below the 20-day moving average.
- As of the start of November 2025, Pi Network traded at approximately $0.247, still below key resistance at $0.26, as traders remain cautious ahead of the upcoming 120 million token unlock expected in November.
- As of November 15, Pi network traded at $0.223. This rise for 1 day was driven by technical breakout signals, whale accumulation, and ongoing ecosystem updates.
- As of November 30, 2025, Pi Network traded around $0.243, consolidating above the $0.24 support zone while still below the $0.26 resistance heading into month-end.
- As of December 1, 2025, Pi Network had dropped to about $0.226, as sellers reacted to December’s 190M PI token unlock overhang and a broader risk-off mood in the crypto market.
- As of December 16, 2025, Pi Network traded around $0.196, having broken below the psychological $0.20 support as ongoing token unlocks, legal uncertainty, and sustained bearish technical momentum kept strong downside pressure on the price.
- As of late December 2025, Pi Network traded in the low-$0.20 range around $0.205, moving sideways as selling pressure eased, but trading volume stayed light, and buyers remained cautious after the mid-month dip below $0.20.
- At the start of 2026, Pi continued to hover near the $0.20–$0.21 zone, showing early stabilization above the key $0.20 level, with the market still weighing ongoing supply unlocks against slower demand growth
0
0
 Beheer al jouw cryptovaluta, NFT en DeFi vanaf één plek
Verbind de portfolio die je gebruikt veilig om te beginnen.