
XRP Price Prediction: Can RLUSD's $1B Milestone Spark a Rally?

0
0

XRP has been around since 2012, built by Ripple Labs to move money across borders faster and cheaper than traditional banking rails, and it has spent years as one of the most talked about assets in crypto thanks to its long-running legal battles and its deep ties to real-world payment partnerships.
Today, XRP is trading around $1.36, down 2.2 percent over the last 24 hours, as traders digest a mix of chart action and fresh stablecoin news.
Despite the ups and downs, $XRP has remained a fixture among the top cryptocurrencies by market cap, and XRP Price Prediction looks at where it could head next.
Live Market Data
| Metric | Value |
| Price | $1.36 (-2.2%) |
| 24h Range | $1.34 to $1.43 |
| Market Cap | $85.554B |
| Fully Diluted Valuation | $136.333B |
| 24h Trading Volume | $2.029B |
| Circulating Supply | 62.745B |
| Total Supply | 99.986B |
| Max Supply | 100B |
Source: $XRP market cap data taken from Coingecko, data as of Aug 31, 2026. Figures may vary slightly across other tracking websites.
Exchange Volume
Binance leads $XRP futures volume by a wide margin at roughly $1.31B, with Bybit and MEXC close behind at $495.32M and $501.52M. 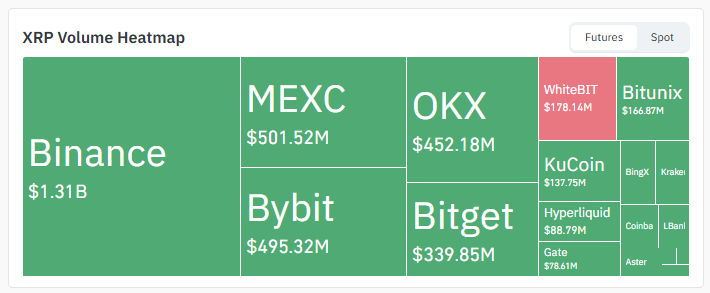
Source: Volume Heatmap Data Taken From Coinglass.
OKX and Bitget also carry solid volume at $452.18M and $339.85M, while WhiteBIT, Bitunix, KuCoin, Hyperliquid, and Gate round out a fairly broad spread of liquidity across both centralized and decentralized venues.
That kind of depth across so many exchanges usually means price discovery for XRP is efficient, and it gives more weight to the technical levels being watched in this XRP price prediction.
Liquidation Snapshot
Liquidation data over the past 24 hours shows $16.21M in total positions wiped out, with longs bearing the bigger share at $13.72M against $2.49M in shorts.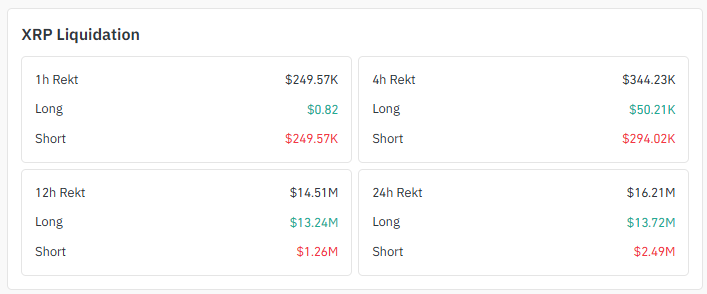
Source: Liquidation Data Taken From Coinglass.
The picture flips in the shorter term, though, with the 1-hour window showing $249.57K in liquidations that were almost entirely shorts, and the 4-hour window showing $294.02K in short liquidations against just $50.21K in longs.
That mix suggests a fast squeeze on short sellers recently even as longs have absorbed most of the pain across the full day, a detail worth watching closely as this XRP price prediction plays out over the coming sessions.
XRP New Today
RLUSD, Ripple's stablecoin built on the $XRP Ledger, just crossed a notable milestone this week, with its total supply passing $1 billion according to widely shared crypto tracking accounts. 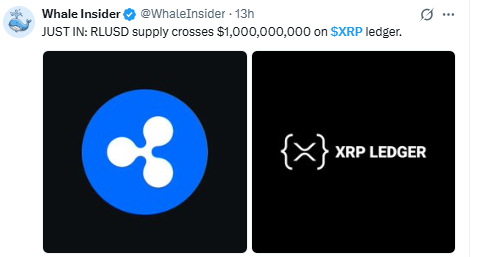
Source: Data Taken From @WhaleInsider, X Account.
Growth like this in a stablecoin tied directly to the XRP Ledger is often read as a sign of expanding real-world usage of the network beyond just speculative trading.
Older claims about specific bank partnerships have also bee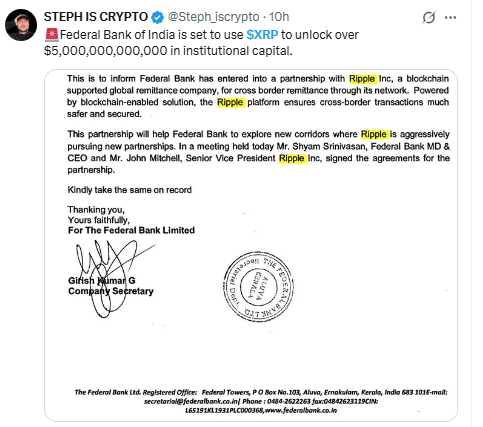
n recirculating on social media this week, most notably a widely shared post claiming Federal Bank of India would use XRP to unlock over $5 trillion in institutional capital.
Source: Data Taken From @Steph_iscrypto, X Account.
That letter is actually a real 2019 RippleNet partnership announcement being recycled years later with an added, unverified $5 trillion figure, so it is best treated as a disputed claim rather than fresh news unless confirmed directly by Ripple or the bank.
Key Takeaways
-
$XRP is trading near $1.36, sitting right on its 200 EMA after breaking a long-standing falling trendline and rallying sharply before getting rejected at resistance.
-
Price is now filling an FVG zone, and a bounce from the middle of this zone followed by a break above resistance could send $XRP toward $1.55 and higher.
-
A failed FVG bounce and a break of the support beneath it could send XRP back toward the $1.04 zone.
-
RLUSD supply on the XRP Ledger just crossed $1 billion, a milestone adding fresh attention to this XRP price prediction.
-
Liquidation data shows shorts getting hit hardest in the past hour, while longs have taken the bigger losses over the past 24 hours.
Technical Analysis
On the daily chart, XRP recently broke out of a long falling trendline and staged a sharp rally, only to get rejected at resistance and pull back. 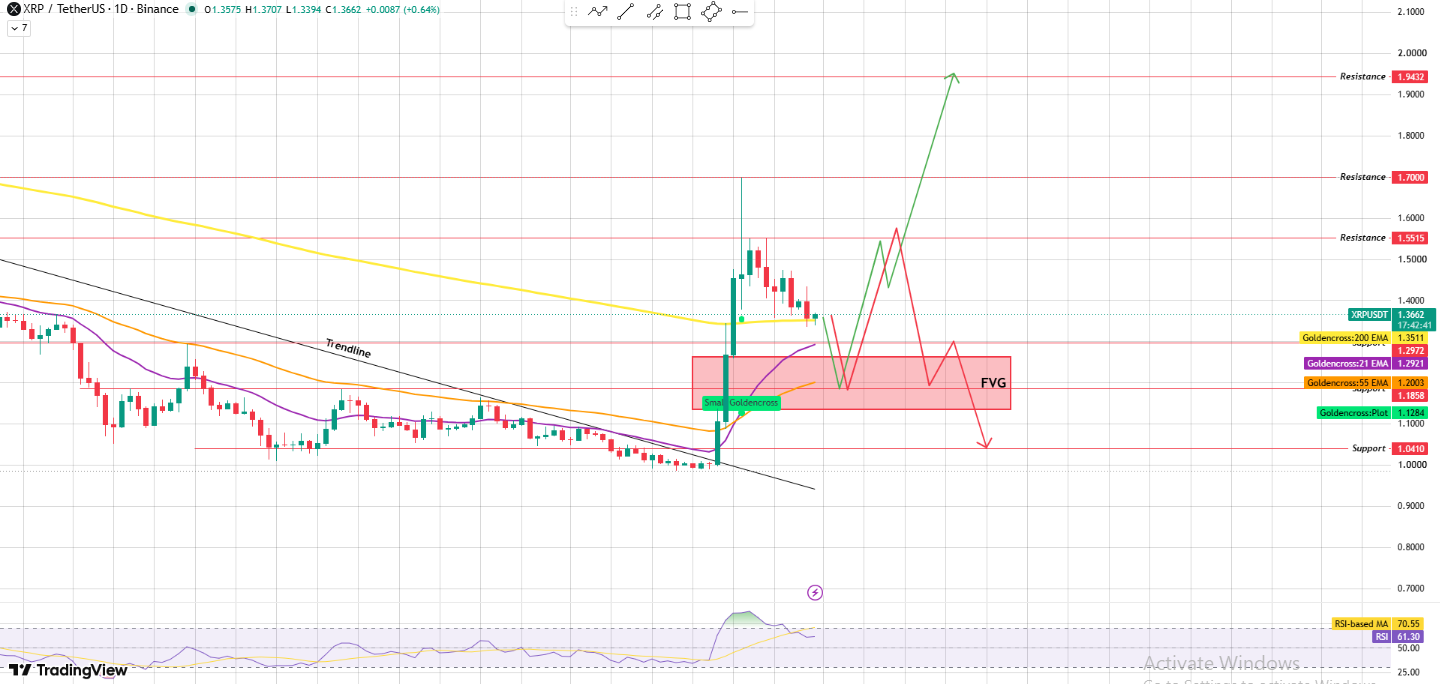
Source: Chart Taken From TradingView .
Price is now going to fill an FVG zone and is sitting almost exactly on its 200 EMA near $1.35.
RSI is reading 61.30, still below its own moving average of 70.55 after cooling from a recent spike, which fits a market that ran hot and is now working through a healthy digestion phase before its next real move.
FVG Zone in Focus
The FVG zone is the level to watch for this XRP price prediction. If the price bounces from the middle of this gap and then clears the $1.5515 resistance, the setup opens toward $1.7000 and then $1.9432 as the next level.
If the bounce fails to hold and the price breaks below the support at the bottom of the FVG instead, XRP could slide back toward the $1.0410 support, a level that lines up with where the earlier falling trendline breakout began.
200 EMA in Play
The 200 EMA near $1.3511 is doing a lot of work on this chart right now, since $XRP is sitting almost directly on top of it.
Holding above this average alongside the other short-term EMAs near $1.29 and $1.20 would keep the broader structure leaning bullish, while a clean break below could shift momentum back toward sellers in the near term.
This kind of EMA cluster is often where a lot of the real decision-making happens for any $XRP price prediction, since it tends to attract both buyers looking for a discount and sellers looking to defend a trend change.
EMA Levels
EMA | Value |
21 EMA | $1.2921 |
55 EMA | $1.2003 |
200 EMA | $1.3511 |
Support and Resistance Levels
Level Type | Price |
Resistance 3 | $1.9432 |
Resistance 2 | $1.7000 |
Resistance 1 | $1.5515 |
Current Price | $1.3662 |
Support 1 | $1.2972 |
Support | $1.1858 |
Support 3 | $1.0410 |
Bull, Base, and Bear Case
| Scenario | Level | Setup | Invalidation |
| Bull | $1.5515 to $1.9432 | FVG bounce holds, price clears $1.5515 resistance with volume | Rejection at $1.5515 and drop back into the FVG |
| Base | $1.0410 to $1.5515 | Price continues testing the FVG zone around the 200 EMA. | Break of either the FVG top or the $1.0410 support |
| Bear | Below $1.0410 | FVG bounce fails; support beneath the gap breaks. | Reclaim of $1,041.00 and the FVG structure |
Expert Opinion
Analysts following this XRP price prediction see the current setup as a fairly textbook pullback after a strong breakout.
The falling trendline break and rally were significant, and the current FVG test sitting right on the 200 EMA is viewed as a normal part of digesting that move rather than a red flag on its own.
The RLUSD supply milestone adds a genuine fundamental tailwind, but most technical voices still want to see a confirmed bounce and a clean break above $1.5515 before getting more confident about a run toward the higher resistance levels on this chart.
Glossary
Falling Trendline: A downward-sloping line connecting a series of lower highs, whose price breaking above can signal a potential trend shift.
FVG (Fair Value Gap): A zone on the chart where price moved so fast that it left a gap in normal trading activity, which price often returns to test before continuing its trend.
200 EMA: A 200-period exponential moving average, widely watched by traders as a marker of the longer-term trend direction.
RSI: Relative Strength Index, a momentum indicator measuring how fast and how much price has moved recently, typically read on a scale of 0 to 100.
Liquidation: The forced closing of a leveraged trading position when losses eat up a trader's margin, common in futures markets.
Support Level: A price zone where buying pressure has historically stepped in to slow or reverse a decline.
Resistance Level: A price zone where selling pressure has historically capped further gains.
Methodology
This XRP price prediction is built using the daily chart pattern, including the falling trendline breakout, the marked FVG zone, the EMA cluster, support and resistance levels, and RSI readings, combined with current exchange volume and liquidation data.
All price levels referenced are taken directly from the chart provided and are not extrapolated beyond what the pattern shows. Market sentiment context is drawn from recent public reporting on RLUSD supply growth on the XRP Ledger.
Disclaimer: This article is for informational purposes only and should not be treated as financial advice. Cryptocurrency markets are highly volatile, and prices can move sharply in either direction within short periods. Always do your own research and consult a qualified financial advisor before making any investment decisions.
0
0


 Gerencie todo seu criptograma, NFT e DeFi de um só lugar
Conecte com segurança o portfólio que você está usando para começar.


