
Bitcoin Volatility Hit A Rare Extreme — A Bigger Move Could Be Coming

0
0

Bitcoin has spent weeks going nowhere, trapped in a narrow band below $65,000. Yet the options market keeps pricing in a far bigger move than the spot chart has actually delivered, and that gap just widened to a level rarely seen.
The Gap Glassnode Flagged
Glassnode’s latest chart plots implied volatility against realized volatility for Bitcoin’s at-the-money options, and today’s reading sits right at the floor of both measures while the gap between them sits near a one-year high.
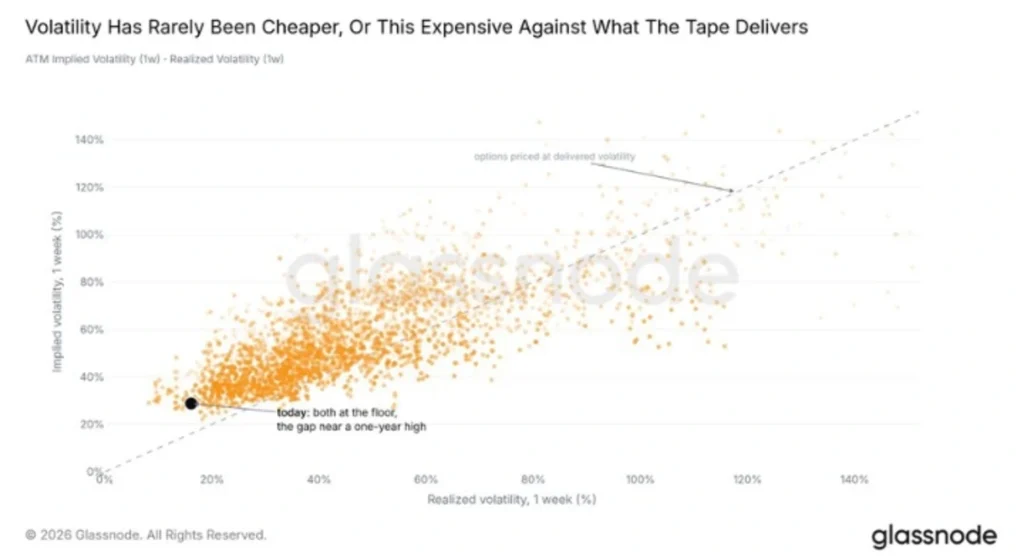
One-week implied volatility is running near 29%, against realized volatility of roughly 16%.
The 30-day picture tells a similar story: realized volatility has fallen to 21.80%, its lowest level since October 2025, while Volmex’s 30-day implied volatility index remains near 36%, Blockonomi reported.
Options traders are pricing in movement that simply hasn’t shown up yet.
Why This Makes Options More Expensive Than They Look
A quiet spot market usually pulls option premiums down with it, since low realized volatility normally signals calmer pricing ahead.
That hasn’t happened here. Implied volatility is set primarily by what the derivatives market expects going forward, not by how calm the recent past has been.
When implied volatility stays elevated while realized volatility drops, calls and puts remain pricey even though Bitcoin barely moves day to day.
That means anyone buying options right now needs a larger price swing just to break even, let alone turn a profit.
A Push-And-Pull That’s Shown Up Before
Bitcoin’s options market has flashed similar disconnects between quiet spot trading and elevated derivatives positioning throughout 2026.
Techgaged reported in April that Bitcoin’s rejection near $80,000 came alongside rising volatility and leverage levels reaching their highest point in months, a combination that tends to raise the odds of sharp moves in either direction.
A separate report in May noted that even a three-day selloff failed to meaningfully shift near-term volatility expectations, with large investors showing little appetite for extra hedging despite the pullback.
What Mean Reversion Usually Means For Bitcoin
Volatility tends to be mean-reverting. Extended stretches of calm have historically preceded sharper bursts of price movement once that calm finally breaks.
Bitcoin’s spot price has stayed unusually stable for weeks now, and both implied and realized volatility sit low by historical standards individually, even as the spread between the two widens toward its highest point in a year.
That combination has often marked a turning point rather than a stable equilibrium.
Where BTC Actually Sits
As of the latest CoinGecko reading on August 18, 2026 (15:00 UTC), Bitcoin trades at $64,790.60, up a modest 0.3% over the past 30 days.
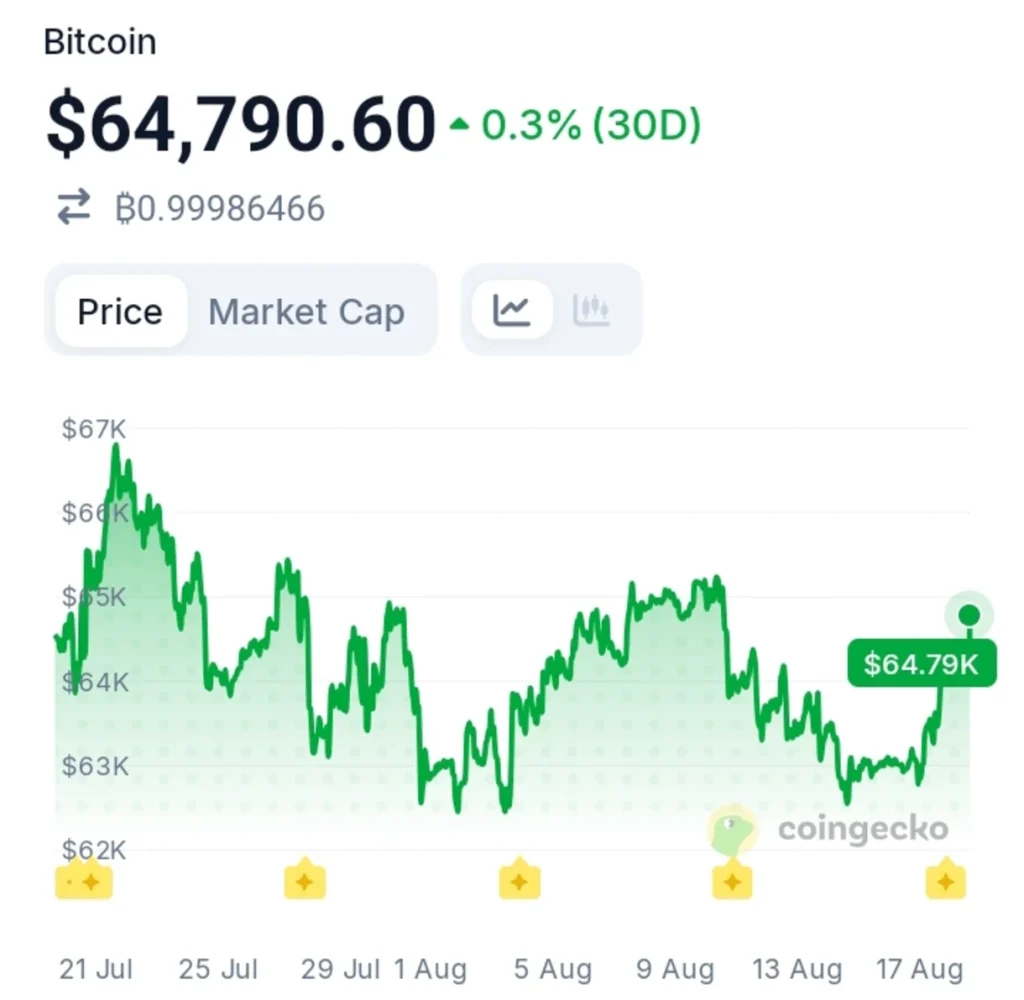
Price has spent the month oscillating between roughly $62,000 and $67,000, with the current level sitting comfortably in the middle of that range rather than near either extreme.
Whether this volatility gap finally closes with a sharp breakout, or whether options pricing keeps overestimating a move that never quite arrives, is the question the derivatives market is betting real money on.
Disclaimer:
This article is for informational purposes only and does not constitute financial, investment, or trading advice. The views expressed are based on publicly available data, market observations, and the author’s interpretation at the time of writing. Cryptocurrency markets are highly volatile and unpredictable, and past performance or current technical setups do not guarantee future results. Readers should conduct their own research and consult with a qualified financial advisor before making any investment decisions. TechGaged does not accept liability for any losses incurred based on the information presented.
The post Bitcoin Volatility Hit A Rare Extreme — A Bigger Move Could Be Coming appeared first on TechGaged.com.
0
0


 한 곳에서 모든 암호화폐, NFT 및 DeFi 를 관리하세요
시작하는 데 사용하는 포트폴리오를 안전하게 연결하세요.


