
Venice Price Prediction $VVV: Traders Bet Big After Short Squeeze

0
0

A quiet AI token just forced a wall of traders to eat their words in a single session.
Something shifted for Venice price prediction this week, and it wasn't a whitepaper update or a listing announcement. It was pain, the kind that shows up on a liquidation dashboard instead of a press release. Traders who bet against this coin got run over, and the chart is still shaking off the aftershock.
Venice Had Its Loudest Day in Weeks.
Venice didn't need a headline to move today. It needed shorts.
Turns out, the token that's been grinding sideways in a losing channel for over a month just broke out of it, and the wallets caught leaning the wrong way paid for it. Is this the start of something bigger for the Venice price prediction or just a squeeze burning itself out before the weekend?
We're not going to bury the lede here. Read on for the levels, the wallet data, and the part of this story most trackers are skipping entirely.
KEY TAKEAWAYS
Direction: Short-term momentum has turned bullish on a squeeze breakout. Long-term outlook depends on whether whale concentration and vesting unlocks stay quiet.
Why it moved: A brutal short liquidation wave combined with fresh Venice ecosystem news (Cluster Protocol integration, a $VVV community call, and the Lumara Film Festival) pushed VVV out of its descending channel.
Near-term range: Roughly $10.40 to $14.16 while the breakout on the chart holds.
Invalidation: A daily close back below $10.40 puts VVV right back inside the old channel and kills the bullish case.
Coin Overview
Metric | Value (as of Jul 21, 2026) |
Name / Ticker | Venice Token / VVV |
Blockchain | Base |
Contract Address | 0xacfE6019Ed1A7Dc6f7B508C02d1b04ec88cC21bf |
Price | $12.73 to $12.76 (+9.60% to +10.27% 24h) |
Market Cap | $603.83M (+10.29%) |
Fully Diluted Valuation (FDV) | $1.02B |
On-chain Market Cap (max supply basis) | $1,457,649,331.41 |
24h Volume | $29.26M (+116.58%) |
Vol/Mkt Cap (24h) | 4.73% |
Liquidity/Mkt Cap | 2.43% |
Circulating Supply | 47.39M VVV |
Total Supply | 80.63M VVV |
Max Total Supply (on-chain) | 114,415,175.15 VVV |
Holders | 139.61K (CoinMarketCap) / 139,750 (BaseScan) |
CertiK Rating | 4.2 / 5 |
All-Time High | $22.45 (-42.94% from here) |
All-Time Low | $0.5133 (+2,396.48% from here) |
Data pulled from live Venice Token market data and the Base blockchain explorer. VVV moves fast, so treat anything more than a few hours old as history, not gospel.
There's a gap worth flagging in that table already. CoinMarketCap lists total supply at 80.63M VVV with max supply left blank. The Venice Token contract page shows a hard max total supply of 114.4M VVV instead. That's a meaningful chunk of tokens that exist on paper but aren't circulating yet, and it matters more than most traders realize.
Technical Analysis: What's Actually Driving This Move
Quick terms before the chart talk. RSI, or Relative Strength Index, measures whether a coin is overbought or oversold on a 0 to 100 scale. EMA, or Exponential Moving Average, is a moving average that leans harder on recent price action. Invalidation is simply the level where a setup stops being valid.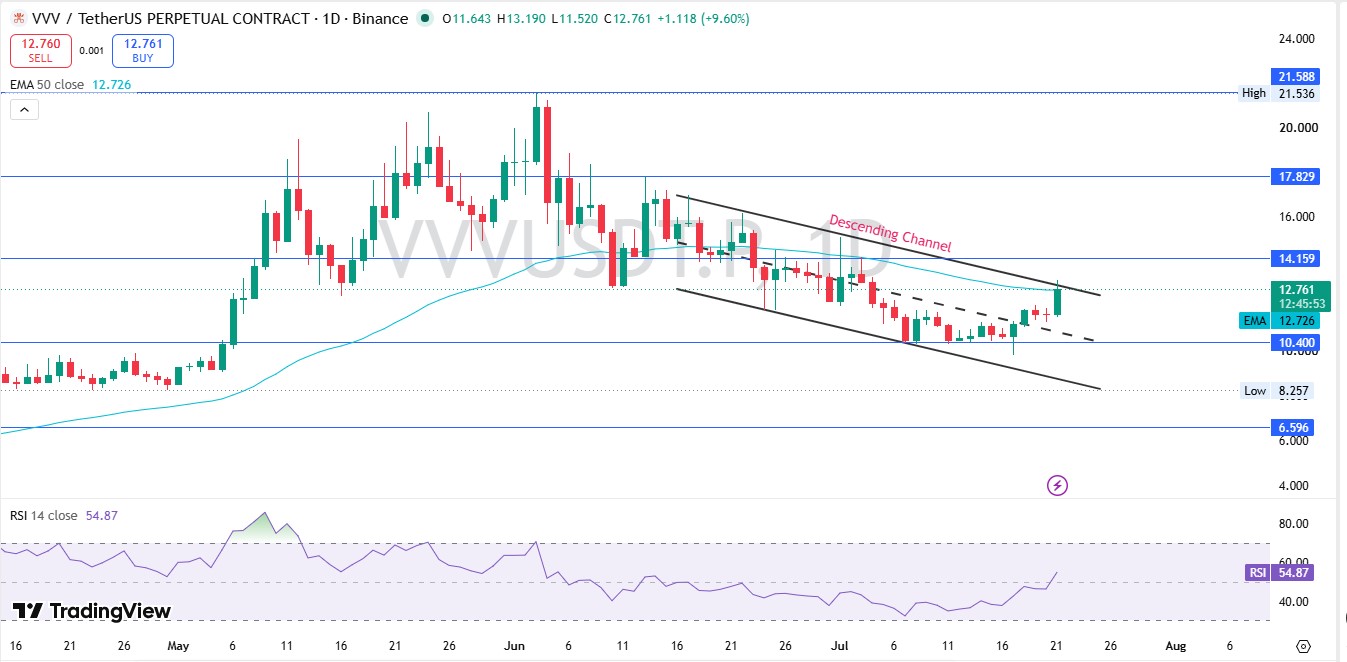
On the daily VVV price chart, VVV has spent over a month inside a clean descending channel, dropping from a June high near $19 down toward $10.40 support. And today, the candle finally punched through the top of that channel on a nearly ten percent green day.
That's not nothing.
RSI on the daily sits at 54.87. Neutral, not stretched. The 50-day EMA is at $12.726, and the price is now trading almost right on top of it, which is exactly where a token proves whether a breakout has legs or fades back inside the range.
Here's the thing: the horizontal level at $14.159 is the next real test. Above that sits $17.829, then the descending channel's upper boundary from the original breakdown near $19 to $21.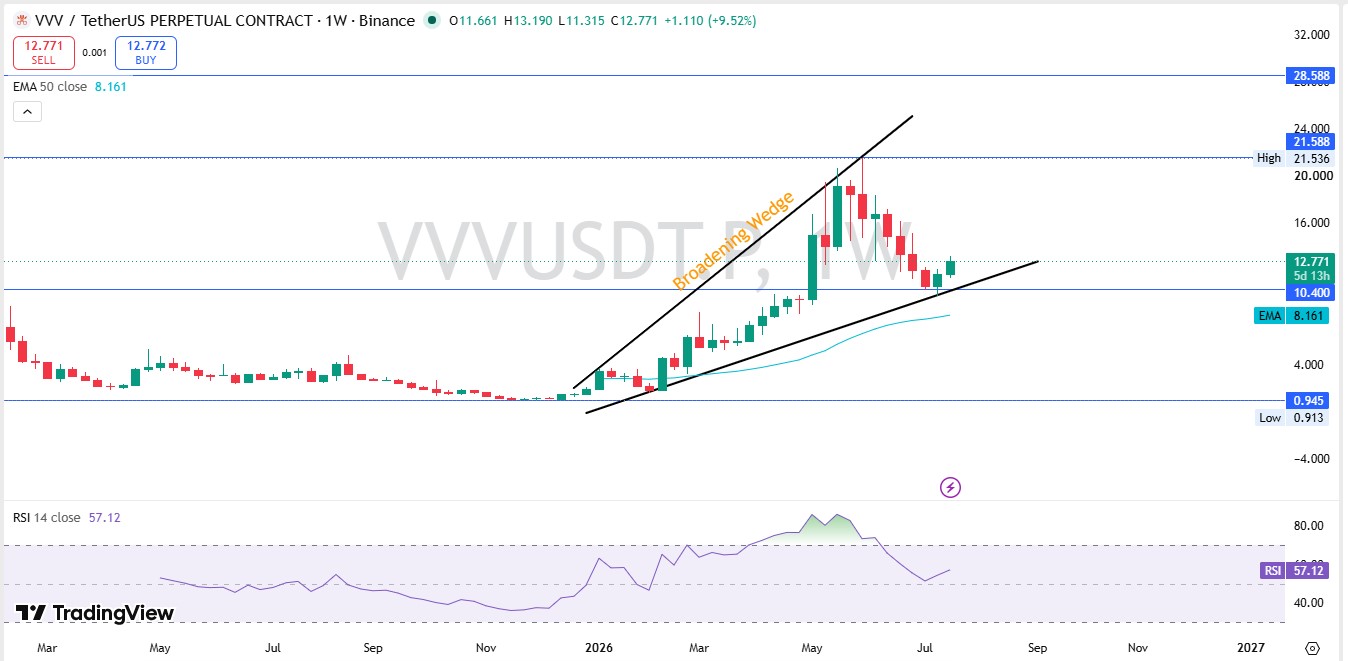
On the weekly chart, the picture is bigger and messier. VVV spent most of late 2025 near zero, then launched into a broadening wedge, a pattern where highs and lows spread further apart instead of narrowing, that carried it from under a dollar to an all-time high above $21.
Weekly RSI reads 57.12, ticking up from a recent dip. The weekly 50 EMA sits way down at $8.161, which tells you how far price ran above its own trend before the correction hit.
Key levels on the current chart structure:
Immediate resistance: $14.159, then $17.829, then the descending channel top near $19 to $21
Immediate support: $10.40, then the daily low at $8.257
Weekly wedge support: the rising trendline now tracking somewhere near $9 to $10
Weekly wedge resistance: already tested near the $21.588 all-time high
None of these levels are magic. They're just where price has reacted before, the same way traders watch old resistance turn into new support on setups across the wider altcoin market rotation, or the way a rejected level played out in the recent XRP resistance rejection.
Breaking Down the Short Squeeze
Here's where it gets interesting.
We pulled the Venice Token liquidation data expecting a rough split between longs and shorts. That's not what showed up.
Over the last 24 hours, $90.60K in total positions got liquidated. Of that, $87.81K came from short positions. Long liquidations were just $2.79K.
Zoom into the 12-hour window and it's even more lopsided. $88.96K liquidation total, with $87.11K of it coming from shorts alone.
Read that again.
Shorts got run over almost completely in a tight window. Every forced buyback to close a losing short adds fuel to the rally on its own, and that's exactly what a squeeze looks like from the outside. But squeezes burn out. Once the shorts are cleared, the extra push behind the move disappears with them.
The 1-hour window shows something different, though. Just $259.63 liquidation, and all of it is long. That's the market cooling, not accelerating, in the most recent hour of trading.
That's the mechanical story. Now the fundamental one.
Where the Volume Is Actually Coming From
We checked the Venice Token volume heatmap next, because that tells us whether real buyers are behind this or leverage is doing the heavy lifting.
Binance alone accounts for $31.23M. Bybit adds $8.72M, OKX brings $7.70M, and Hyperliquid contributes $5.12M on the derivatives side. Smaller venues among the wider crypto exchange rankings, including Bitget, MEXC, BingX, CoinEx, LBank, and Gate, each chips in between one and two million dollars.
And that spread across ten-plus venues, rather than one dominant exchange, is actually a healthier signal than a lot of small caps show during a squeeze. It suggests this isn't a single desk pushing prices around.
But spread liquidity doesn't mean deep liquidity. Liquidity sits at just 2.43% of market cap, thin enough that a coordinated sell can still move price hard in either direction.
Fundamentals: Why Venice Is Getting Attention Beyond the Chart
Venice isn't just another AI token riding a narrative wave. It's building a specific pitch: private AI, meaning prompts that never get stored and conversations that never leave the user's device.
That pitch picked up a real endorsement this week. Cluster Protocol, an orchestration layer for AI agents, announced it's building on Venice specifically to route sensitive workloads through what it calls verified private compute, with inference running inside sealed hardware enclaves and every response shipping cryptographic proof it stayed private.
Erik Voorhees, a well-known figure in the crypto industry, reposted Venice's own API pitch, essentially telling builders not to endanger their own users by skipping privacy-focused AI routing. That's not subtle, and it's not nothing either when a name with that kind of following amplifies it. Some of this attention also lines up with the wider question of why the crypto market is rallying this week, which has lifted risk appetite across small caps generally.
Venice also has a community call landing on Wednesday, July 22 at 3pm ET, hosted with Bankless and covering both $VVV and $DIEM tokenomics. Events like that tend to bring fresh eyes and fresh volume, for better or worse.
And there's Lumara, an independent film festival Venice is backing alongside MoonPay, offering up to $100K in awards with screenings planned in NYC theaters this fall. It's an unusual marketing angle for a crypto project, building a brand outside the usual crypto media bubble.
Now the Catch
A project with real partnerships and a genuine privacy pitch is still not the same thing as a token with balanced ownership.
We looked at the Venice Token holder data, and it's stark. Top 100 wallets control 98.11% of supply. Just 65 wallets, labeled whales and making up 0.05% of all holders, control 97.38% of the entire market cap. The Gini distribution score, a measure of inequality where 1.0 is total concentration in one hand, sits at 0.9997.
Sit with that for a second.
Some of that concentration has an explanation. The number one holder is the Venice sVVV staking contract itself, holding 29.81% of the supply, which is normal for a token with a staking mechanism. The number two wallet is a null or burn address holding 29.53%, tokens effectively out of circulation for good. Position five is a Sablier vesting contract holding 2.21%, meaning those tokens unlock gradually over time rather than dumping at once.
But that still leaves large, unlabeled wallets in the third and fourth spots holding 18.17% and 7.31%, respectively, worth roughly $265M and $107M combined. Those are not staking or vesting contracts. Those are addresses that can move.
That's the risk sitting underneath every green candle right now.
Tokenomics and Supply Risk
The circulating supply sits at 47.39M VVV against a total supply of 80.63M and an on-chain max of 114.4M. That gap between circulating and max supply is a real unlock risk, roughly 67M tokens worth of future dilution if all of it eventually reaches the market, the kind of gap that shows up often across new token launches and presales in this cycle.
FDV at $1.02B versus a $603.83M market cap tells the same story from a valuation angle. The market is already pricing in a large chunk of future supply, whether or not that supply shows up on a predictable schedule.
Vesting through Sablier does soften the blow somewhat since those unlocks stream gradually rather than cliff-dumping. Still, worth watching every time a large wallet outside the staking and vesting contracts starts moving.
Historical Context
VVV hit its all-time high of $22.45 and has fallen 42.94% from that peak to where it trades today. That's a serious drawdown, even with today's bounce factored in.
The all-time low was $0.5133. From there to today's price, VVV is up over 2,396%. That's the full arc in one sentence: a token that ran from under a dollar to over twenty, corrected hard, and is now trying to prove today's bounce is the start of a new leg rather than a dead cat bounce inside a longer downtrend. Runs like this often line up with stretches when capital rotates into altcoins, which can inflate small-cap volume fast in both directions.
Scenarios: Bull, Base, and Bear
Using the same bull-bear base case framework applied across major assets and echoing the kind of setup seen in the recent Solana bullish flip, here's how VVV's structure breaks down.
Scenario | Conditions | Target | Timeframe | Invalidation |
Bull Case | Squeeze momentum continues, Cluster Protocol integration and the Bankless call bring sustained attention, price clears $14.16 | $17.83 to $21.59 (retest of prior highs) | 2 to 6 weeks | Daily close below $10.40 |
Base Case | Price consolidates between the breakout zone and old resistance while volume normalizes | $10.40 to $14.16 range-bound | Days to a few weeks | Break of either boundary on strong volume |
Bear Case | Squeeze exhausts, large unlabeled whale wallets start distributing, thin liquidity gets tested | $8.26 to $9.50 (retest of channel lows) | Days to weeks if triggered | Recovery only if price reclaims $12.73 and holds |
The bear case isn't just a formality here. With liquidity under three percent of the market cap and 97% of the coin sitting in whale hands, one large wallet deciding to sell could undo today's entire move faster than it built.
What Would Actually Change This Thesis
Bullish confirmation: A daily close above $14.159 on rising volume, held for 48 hours.
Key support to watch: $10.40 on the daily, then $8.257 below that.
Hard invalidation: A daily close below $10.40, which drops VVV back inside the old descending channel.
Narrative risk: Any sign the Cluster Protocol integration stalls, or that large unlabeled wallets start moving in meaningful size, would undercut the bullish case fast. It's worth tracking the crypto events calendar for follow-up news around Wednesday's community call.
Venice Long-Term Outlook: The Honest Version
Long-term is genuinely hard to call here, and we're not going to pretend otherwise.
The privacy AI pitch is real. The Cluster Protocol partnership is real. The community call and the film festival marketing push show a team actively building attention outside the usual crypto echo chamber.
None of that offsets a Gini score of 0.9997 or the fact that two unlabeled wallets alone hold more than a quarter billion dollars in tokens.
We're not calling this the start of a new bull leg, and we're not calling it a dead squeeze either. What we can say plainly is that VVV right now is a momentum trade riding a real fundamental story, and anyone treating today's breakout as a guaranteed continuation is ignoring exactly the wallet data that makes this coin risky in the first place. For comparison against larger, more established assets, see our broader crypto price predictions coverage or check where Bitcoin heads next for the market's overall tone.
Disclaimer: This article is for informational purposes only and isn't financial advice. VVV is a low-liquidity, whale-concentrated token, and prices can swing sharply in both directions. Verify all figures independently before making any trading decision. Data sourced from CoinMarketCap, BaseScan, TradingView, and Coinglass as of July 21, 2026.
0
0

 Gérez tous vos cryptos, NFT et DeFi à partir d'un seul endroit.
Connectez de manière sécurisée le portefeuille que vous utilisez pour commencer.