
Bitcoin Reclaims $64,000: Next Key Breakout Level Identified

0
0


Bitcoin is holding above $64,000 after buyers repeatedly stepped in around a key support zone, putting the market within reach of a technical level that could determine whether the latest recovery develops into a more sustained move.
BTC was trading near $64,200 at the time of writing after reaching an intraday high above $65,300. A fresh Bitcoin technical analysis published on TradingView identifies $65,500–$65,800 as the immediate resistance area, with a confirmed move above it potentially strengthening Bitcoin’s short-term bullish structure.
The analysis, published by trader Setupsfx_, argues that Bitcoin’s recovery has been supported by repeated buying around $60,000–$62,000. BTC previously fell toward $57,500 before recovering above $60,000, while a subsequent pullback formed what the analyst describes as a possible higher low near $62,600.
That distinction matters. A rebound alone does not confirm a trend reversal, but a sequence of higher lows followed by a higher high can indicate that buyers are beginning to regain control of the market structure.
For Bitcoin, $65,800 is now the level that could provide that confirmation.
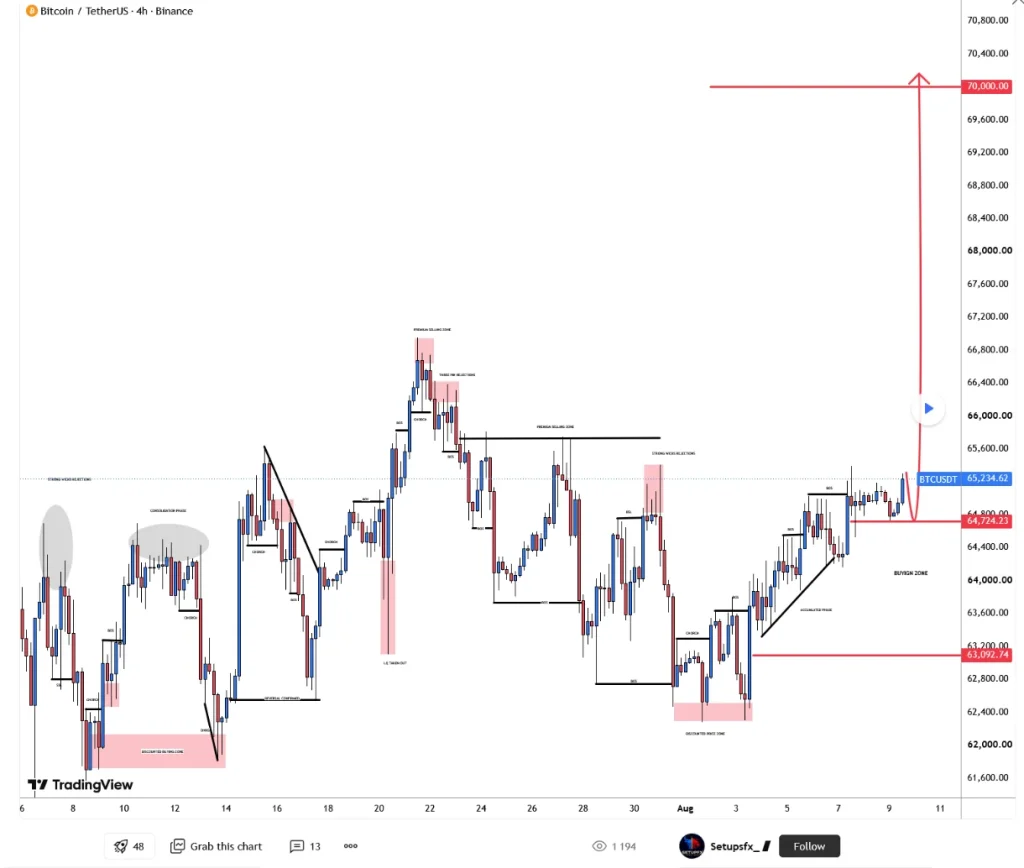
Bitcoin Buyers Have Repeatedly Defended the $60,000–$62,000 Zone
According to the TradingView setup, a confirmed four-hour close above $65,800 would establish a new short-term higher high. If the breakout holds, the analyst identifies $67,000 as the first major upside level, followed by resistance between $68,500 and $69,500.
A stronger move above $69,500 could bring $72,000 back into focus, while $78,000 is presented as an extended recovery objective.
Those levels are best viewed as conditional technical targets, not Bitcoin price forecasts. They depend on BTC first breaking resistance and then maintaining the former resistance area as support.
There is some supporting evidence beyond the price chart that Bitcoin has been experiencing accumulation during recent weakness.
TechGaged reported in July that long-term Bitcoin holders were absorbing available supply, according to Glassnode data. At the time, the on-chain analytics firm identified a divergence between institutional outflows and continued accumulation among longer-term holders.
That does not guarantee higher prices, but it provides additional context for the repeated buying pressure now visible around Bitcoin’s lower support zones.
The downside levels remain equally important.
The TradingView analysis places immediate support around $64,000–$64,500, followed by the more important $62,000–$62,600 region. A daily close below $62,000 would weaken the current setup, while a sustained break below $60,000 could expose the previous $57,500 low again.
In other words, the bullish case remains conditional: buyers have defended support, but they have not yet produced the breakout required to confirm a stronger recovery.
U.S. Inflation Data Could Decide Bitcoin’s Next Move
Technical levels are only part of the picture. Bitcoin is approaching resistance just as markets prepare for another important U.S. inflation reading.
The latest U.S. employment report from the Bureau of Labor Statistics showed that nonfarm payroll employment declined by 23,000 in July, while the unemployment rate remained at 4.1%.
The report also contained substantial downward revisions. May payroll growth was revised from 129,000 to 63,000, while June was revised from 57,000 to 20,000. Together, the two previous months were revised lower by 103,000 jobs.
A softer labor market can influence expectations for Federal Reserve policy because weaker economic conditions may reduce the case for maintaining restrictive monetary policy for longer.
That relationship is particularly relevant to Bitcoin. As TechGaged’s broader analysis of Bitcoin volatility and price drivers has detailed, BTC has become increasingly sensitive to inflation, Federal Reserve policy, global liquidity and institutional capital flows.
Attention now turns to the July U.S. Consumer Price Index report, scheduled for August 12, according to the Bureau of Labor Statistics.
The CPI release could influence expectations around the future path of U.S. interest rates and, by extension, sentiment across risk-sensitive markets.
For Bitcoin, the timing is notable.
BTC is already trading immediately below a technically important resistance zone. Softer-than-expected inflation could improve expectations for monetary conditions and provide a supportive backdrop for risk assets, while unexpectedly strong inflation could have the opposite effect.
That leaves Bitcoin approaching an unusually clear short-term test.
A sustained break above $65,800 would strengthen the technical recovery and shift attention toward $67,000 and the $68,500–$69,500 region. Failure to break through, particularly if followed by a loss of $62,000, would weaken the bullish structure and put the $60,000 support level back under pressure.
For now, buyers have successfully defended the lower end of Bitcoin’s recent range. The next question is whether they can do the same thing on the other side of the market — and turn resistance into support.
Disclaimer: This article is for informational purposes only and does not constitute financial, investment, or trading advice. The views expressed are based on publicly available data, market observations, and the author’s interpretation at the time of writing. Cryptocurrency markets are highly volatile and unpredictable, and past performance or current technical setups do not guarantee future results. Readers should conduct their own research and consult with a qualified financial advisor before making any investment decisions. TechGaged does not accept liability for any losses incurred based on the information presented.
The post Bitcoin Reclaims $64,000: Next Key Breakout Level Identified appeared first on TechGaged.com.
0
0

 Gestisci cripto, NFT e DeFi in un unico luogo
Connetti in sicurezza il portafoglio che usi per iniziare.


0
0