Gold Price Crash Below $4,500: Key Technical Levels to Watch

0
0
Gold prices suffered a dramatic gold price crash this week amid geopolitical tensions. The metal fell more than 10 percent to trade below 4500 dollars. This marks the biggest weekly drop since 1983. Although war rages and inflation climbs higher worldwide, the metal weakened sharply anyway. A surging dollar and margin calls triggered the gold market sell-off. Investors monitor key technical levels for any reversal or hint on where the market could be heading to.
Also Read: Global Flash PMIs Next Week: What Traders Should Watch
Gold Price Crash The Biggest Weekly Drop Since 1983

The gold price crash has delivered the biggest weekly gold drop since 1983. Prices tumbled more than 10 percent in just one week. This represents the sharpest single-week decline the metal has suffered in 43 years.
What makes this move particularly striking is how dramatically it diverges from earlier historical gold crashes. Those previous sell-offs were always driven by clear bearish fundamentals. In 1982 the Federal Reserve hiked rates aggressively to 20 percent to crush runaway inflation. In 2013 tapering signals from the Fed undermined gold’s appeal. Finally, in 2022 a fresh round of steep rate increases triggered widespread liquidation.
Today, as gold falls below 4500 dollars per ounce, the environment remains supportive. The war in Iran, higher inflation rates and oil conflicts could push investors to search a safe haven in the precious metal.
Despite all these classic bullish drivers, the gold market sell-off unfolded with unexpected intensity. Additionally, as reported by BlockNow, China has hoarded 371 billion dollars in gold reserves, while Wall Street institutions sold heavily to retail investors. This striking divergence only underscores the unusual pressures weighing on the market right now.
Also Read: Oil Inventories & EIA Report: U.S. Supply Outlook Amid Escalating Iran Tensions
Is the Gold Market Sell-Off a Buying Opportunity?
Many market participants now ask whether the sharp gold market sell-off presents a genuine buying opportunity despite the intense pressure. With gold falls below 4500 dollars following the gold price crash, technical analysts point to several key support zones.
Immediate levels to watch include around $4,400 to $4,450, where prior resistance may flip to support. Moreover, it is worth paying attention to Fibonacci areas near $4,360 and the broader $4,200 region tied to longer-term moving averages.
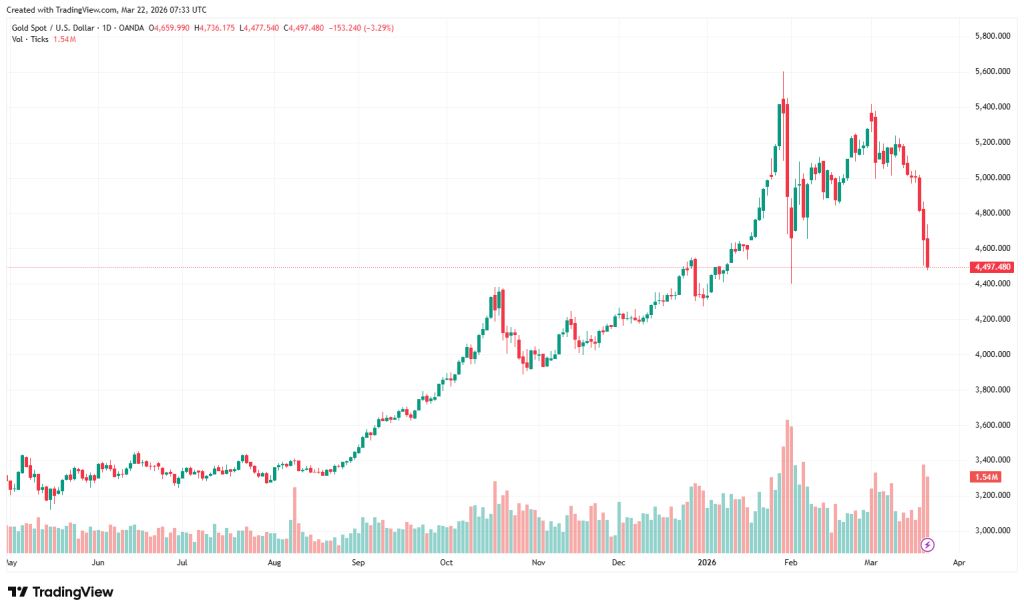
Source: TradingView
A hold above these thresholds would preserve the overall bullish structure amid persistent geopolitical risks and inflation. Historical patterns from historical gold crashes offer encouragement: after the severe 1982 drop, gold rallied roughly 50 percent within the following 12 months once technical selling exhausted itself.
Current dynamics, forced liquidations rather than fundamental rejection, suggest this dip could prove temporary. Investors who view the fundamentals as intact may see value in accumulating positions near these supports, positioning for an eventual recovery as pressures ease.
Also Read: MicroStrategy Bitcoin Purchase: Why Monday Matters for Investors
0
0

 Gestisci cripto, NFT e DeFi in un unico luogo
Connetti in sicurezza il portafoglio che usi per iniziare.

0
0

0
0

0
0

0
0