
Arbitrum Price Prediction September 2026: ARB Price Outlook Today

0
0
Somewhere between a slow bleed and a quiet comeback, Arbitrum has been sitting in a spot that's hard to read. The network keeps shipping, yet the token barely moves. Is the market simply waiting, or has something already shifted underneath?
What This Arbitrum Price Prediction Actually Covers
Any Arbitrum price prediction worth reading starts with what's real, not what's hoped for. ARB spent most of 2026 grinding inside a falling channel, and it's still there. But the volume behind recent candles tells a slightly different story. Here's the thing: sideways price action isn't dead price action.
Where Does ARB Price Stand Right Now
As of CoinMarketCap's latest data, taken around 08:56 UTC on August 27, 2026, ARB traded near $0.0922, up roughly 0.27% on the day. Market cap sat near $615.52M, and 24-hour volume ran near $65.29M, up 15.23%. That volume jump against a flat price is a small clue. The volume-to-market-cap ratio came in at 10.31%, healthy for a mid-cap token. The fully diluted valuation stood near $921.71M against roughly 6.67B ARB circulating.
Why Is ARB Price Moving Today
Turns out, the answer is more on-chain than a headline. $ARB has been pushing its programmable economy narrative, pairing perpetuals infrastructure like Variational.io with tokenized ETF growth that led every chain in 24-hour market cap gains, adding roughly $2.4 million.
Separately, ZeroDev is wiring AI agents into Arbitrum's settlement layer, a theme covered in wider AI token coverage. None of that hits trading instantly, but it feeds sentiment. The daily crypto news roundup adds more context here.
Arbitrum Daily Chart Analysis: Trend, Support and Resistance
The daily chart still shows a descending channel stretching back to February, with lower highs capping every rally since. A rounded top formed near $0.135 in May before trades slid back under the mid-channel line. 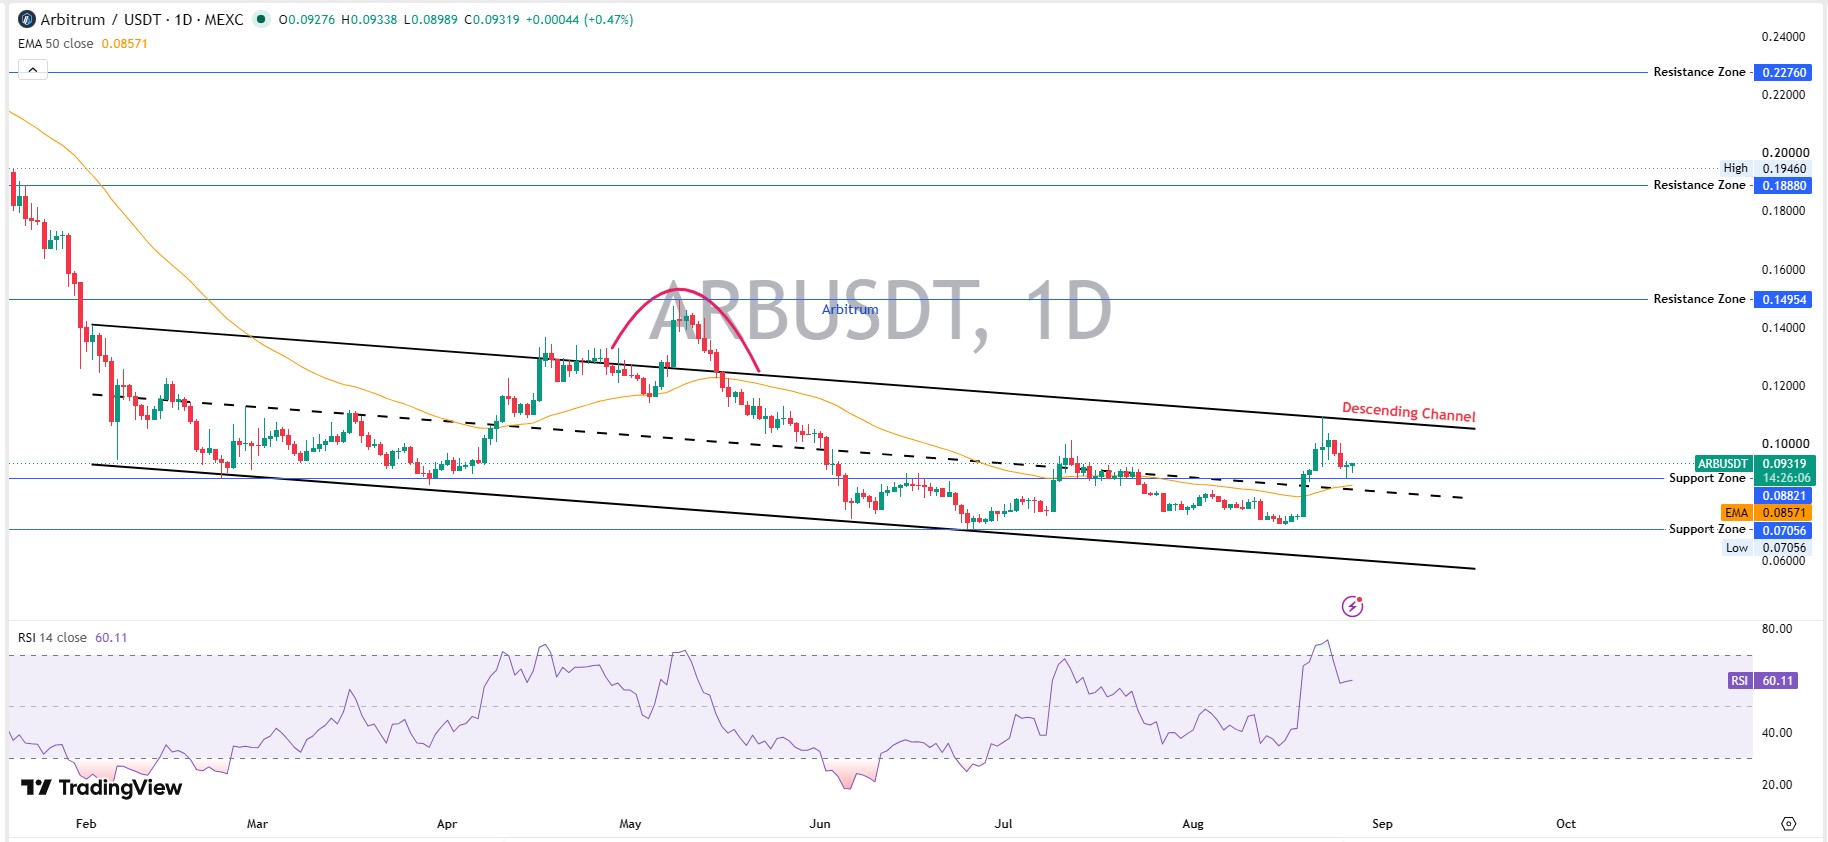
Right now $ARB tests resistance near $0.093 to $0.095, just above its 50-day EMA at $0.0857. RSI-14 reads 60.11, firm without being overbought.
Immediate support holds near $0.0882, with a deeper floor at $0.0706, the June low. Above trades, resistance stacks at $0.1495, then $0.1888, then $0.2276.
A trade above the channel's upper trendline, not a wick, would signal real trend change. Until then, this stays a range trade. Bullish momentum needs volume confirmation, not just a green candle.
On-Chain Data: Whale Concentration and Holder Distribution
Etherscan's holder data and the concentration numbers are worth sitting with. The top 100 wallets hold 77.09% of supply. 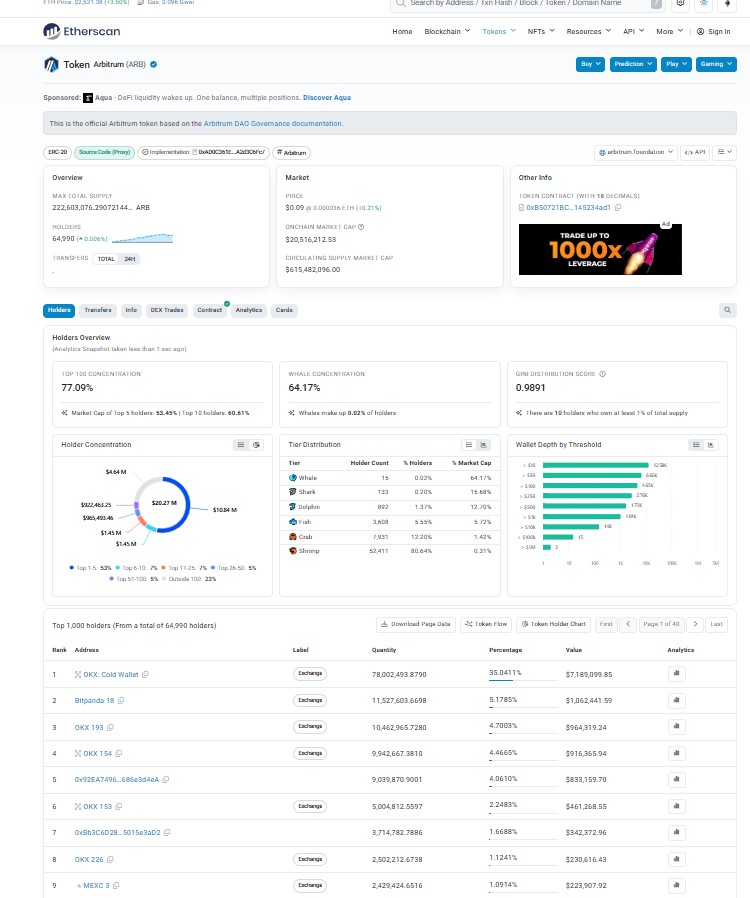
Whale wallets alone, just 0.02% of holders, control 64.17% of circulating ARB. The Gini score reads 0.9891, extremely concentrated. A single OKX cold wallet holds over 35% by itself. That's not automatically bearish, but large transfers can move price fast. Large exchange balances also tend to shift around new exchange listing news.
Arbitrum Liquidations and Exchange Volume Heatmap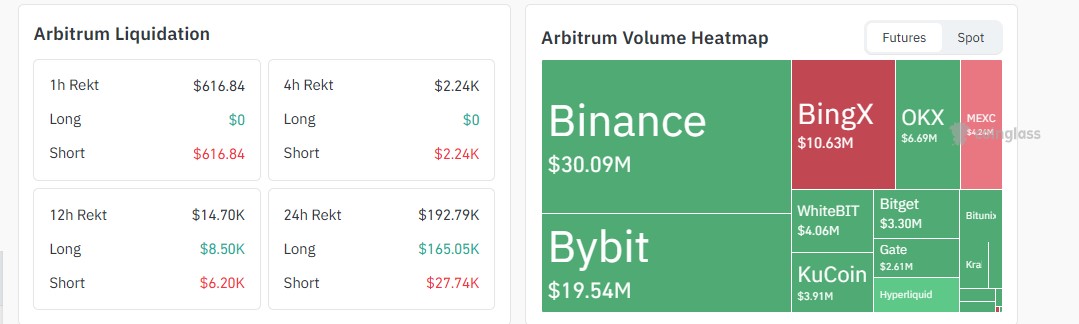
Coinglass data shows 24-hour liquidations near $192.79K, with longs losing $165.05K against $27.74K on the short side. Binance carried the largest share of spot volume at $30.09M, followed by Bybit near $19.54M and BingX around $10.63M. That spread suggests real demand, not one exchange pumping numbers.
Arbitrum as Leading Altcoin: Why $ARB Still Matters in the L2 Race
ARB remains one of the largest altcoin Layer 2 networks by ecosystem activity. It's not a memecoin story; it's an infrastructure one. The chain's push into tokenized real-world assets and AI-agent tooling separates it from purely speculative tokens. A related Arbitrum price prediction piece on RWA holder rallies goes deeper on fundamentals. For contrast, memecoin market coverage trades on hype alone.
Arbitrum Price Prediction: Bear, Base, and Bull Scenarios
Timeframe | Bear Case | Base Case | Bull Case | Probability | Invalidation |
7 Days | $0.082 | $0.093 | $0.102 | 30 / 45 / 25 | Below $0.0882 |
30 Days | $0.071 | $0.105 | $0.135 | 25 / 40 / 35 | Loses $0.0706 |
Early 2027 | $0.060 | $0.145 | $0.228 | 20 / 45 / 35 | Weekly channel break |
This table leans base-case in the near term, with the bull path opening only above the channel's upper trendline.
What Could Invalidate This Arbitrum Price Prediction
If ARB loses the $0.0706 low with strong volume, the base case collapses fast. And if whale wallets start moving supply onto exchanges, that's an early warning. But a clean weekly trade above $0.15 flips the outlook bullish, opening room toward the $0.19 to $0.23 band. A related ARB trendline breakout analysis dives deeper into that condition. Broader catalysts matter too, including regulatory headlines like the CLARITY Act developments moving through the Senate.
Conclusion: Arbitrum Price Prediction September 2026
Basically, ARB isn't broken; it's boxed in. The chart says range-bound, on-chain data says concentrated but stable, and the catalysts say builders haven't stopped. This Arbitrum price prediction leans cautiously constructive into early 2027, provided support near $0.088 and $0.070 keeps holding. Bulls need a real breakout, not a wick. Bears need a floor to break. Right now, neither has won.
Disclaimer
This article is for informational purposes only and does not constitute financial, investment, or trading advice. Cryptocurrency markets are highly volatile, and prices can move sharply in either direction. Always do your own research and consult a licensed financial advisor before making investment decisions.
0
0

 Gestisci cripto, NFT e DeFi in un unico luogo
Connetti in sicurezza il portafoglio che usi per iniziare.


