Which is the most profitable trading bot? A practical guide

0
0
This guide explains why there is no universally most profitable trading bot and gives a practical framework to compare platforms using audited live performance, supported assets and exchange liquidity, fees, and risk controls. Use these steps as a methodical starting point before you connect an exchange or risk meaningful capital.
Short answer: is there a single most profitable trading bot?
Headline conclusion: best automated crypto trading platform
No single crypto trading bot consistently outperformed markets across 2024 and 2025, so there is no universal winner that you can pick and expect to repeat past returns, according to systematic reviews of algorithmic and machine learning approaches in cryptocurrency trading.
Profitability depends on the interaction between the chosen strategy, the market regime when it runs, and how fees and execution affect net results. Backtests often look better than live trading because they can include hidden biases and omit real trading frictions.
Partner with FinancePolice to reach readers researching trading tools
Continue with the checklist and small live tests in this guide to compare platforms without relying on headline performance claims.
To compare platforms in practice, focus on four dimensions: audited live performance, supported assets and exchange liquidity, the fee schedule, and built in risk controls. These four factors explain most of the difference between advertised and actual net returns.
Why the short answer matters for readers
Readers may want a quick verdict, but choosing a trading platform is not only about gross performance numbers. Execution, slippage and fees change what you actually make, and strategy suitability changes with market conditions. Treat performance claims as starting points for verification rather than final answers Investopedia primer.
How crypto trading bots work: core concepts in plain language
Order types, signals and execution
Automated trading platforms combine three core functions: signal generation, order execution and position sizing. A strategy creates signals that say buy or sell, a connector sends orders to an exchange, and rules decide how large each trade should be. Execution quality depends on how the platform connects to exchanges and how it handles partial fills, retries and errors.
Think of a bot as a kitchen robot: the recipe is the strategy, the robot follows instructions, and the quality of the ingredients and tools determine the result. If the exchange is slow or thinly traded, the same recipe will produce less reliable outcomes.
Backtests versus live trading
Backtests run a strategy over historical data to estimate how it would have performed, but they commonly overstate live returns because of look ahead bias, overfitting and omitted costs. Researchers warn that machine learning methods in particular can appear strong in backtests but fail under live trading conditions IEEE Access review.
Slippage is the gap between the expected execution price and the price you actually get, and it often grows when liquidity is limited or markets move fast. Execution risk includes outages, API errors and partial fills, all of which reduce realized performance compared with neat backtest numbers CryptoCompare exchange benchmark.

Key comparison criteria for choosing an automated crypto trading platform
Dimension 1: provenance of performance data
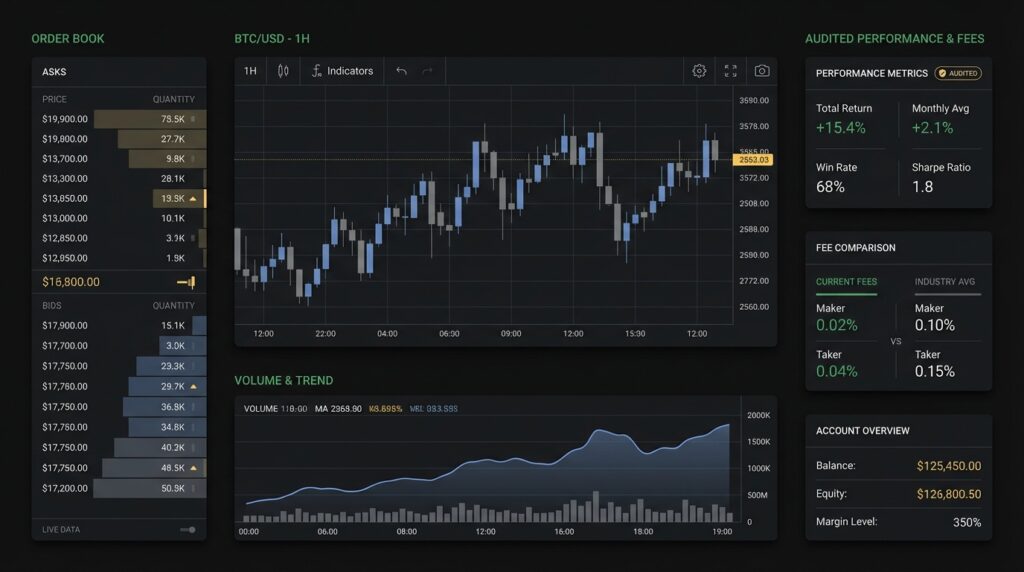
Prioritize audited, independently verified live results over self reported backtests. An audited live feed or a verified exchange account history shows the trades and fills used to calculate results, and is harder to manipulate than an internal backtest.
Look for platforms that provide exportable trade history and third party verification, because those let you check fills, timestamps and net returns yourself CoinDesk comparison guide.
Dimension 2: supported assets and exchange liquidity
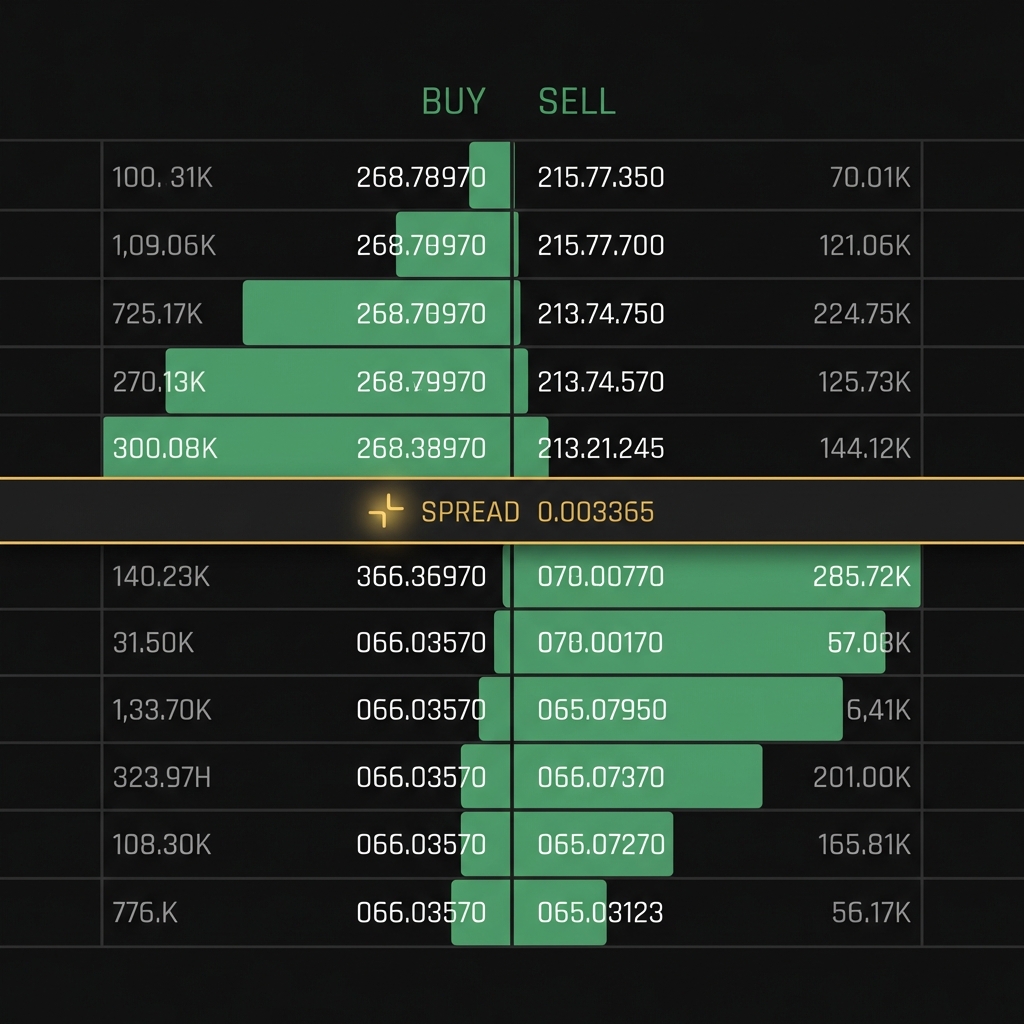
Supported assets matter because liquidity varies widely. A strategy that works on a top US dollar pair may fall apart on a low volume altcoin. Exchange depth, not just headline volume, influences how much slippage you will experience for a given order size CryptoCompare exchange benchmark.
Check which exchanges the platform supports and whether it reports how it routes orders. Where possible, pick venues with consistent depth for the assets you plan to trade.
A compact checklist to score fee transparency and exchange liquidity
Use to compare two to three platforms side by side
Additional dimensions to check
Compare fee models, risk controls, custody arrangements and ease of setup. Fee models include subscriptions, trading commissions and revenue share; custody can change counterparty risk; and API permission levels affect how much control a bot has over your account CoinDesk comparison guide.
Ease of setup and documentation matter for day one safety. Well documented platforms reduce errors during integration and make it easier to run small controlled tests.
Understanding performance claims: backtests, live results and audits
Why backtests often overstate live returns
Backtests can include look ahead bias when future information slips into model training, and they can suffer from overfitting where a model is tuned to historical quirks that do not repeat. These problems inflate apparent historical returns and give a false sense of robustness IEEE Access review.
Because backtests often omit exchange fees, funding costs and slippage, the gap between backtest returns and live returns is frequently large. Treat a compelling backtest as a hypothesis that needs live verification.
What to look for in live performance evidence
Prefer performance that is derived from a verifiable exchange account, ideally with a third party audit or a public live feed. Verified results should include timestamps, fills and the net PnL after fees so you can independently check calculations CoinDesk comparison guide.
Watch for signs of cherry picked intervals, removed losing trades, or unexplained data gaps. Those are common ways that reported track records can be misleading.
Fees, exchange liquidity and how they change net returns
Typical fee components to check
Common fee components include platform subscription fees, trading commissions charged by exchanges, maker taker fees, spreads and funding costs for perpetual contracts. Each element reduces gross returns and should be included in any net return estimate.
Because exchange fee schedules and maker taker models vary, a strategy that looks profitable on paper can be unprofitable after you add platform and exchange costs CryptoCompare exchange benchmark.

How liquidity affects execution and implicit costs
Low liquidity increases slippage and widens spreads, both of which implicitly tax every trade. For larger position sizes, execution quality and exchange depth become the limiting factor for achievable returns rather than the raw strategy signal CoinGecko market report.
When comparing platforms, ask for examples of trade sizes and how fills look on the exchanges they support. That practical evidence is often more informative than headline gross returns.
Risk controls, safety features and regulatory context
Built in risk controls to expect
Common risk controls include stop loss orders, maximum position sizes, circuit breakers and kill switches that halt the bot if errors or extreme conditions occur. These features limit downside exposure if a strategy fails.
Also check API permission options so you can restrict withdrawal rights and reduce counterparty risk. Properly configured permissions are a basic safety step before connecting a bot to a funded account CoinDesk comparison guide.
Regulatory and transparency trends to watch
Industry reports documented growth in automated trading tools alongside increasing regulatory scrutiny and calls for transparency in 2024 and 2025. Expect more platforms to publish clearer disclosures and possibly independent attestation going forward CCAF regulatory survey.
Regulatory context affects both operational risk and what performance evidence platforms are willing or able to share. Keep this in mind when comparing vendors across jurisdictions.
A simple decision framework: step by step evaluation
Step 1: verify live results and proof
Start by asking for verifiable live performance rather than only backtests. Exportable trade history or a third party audit gives you a basis for independent checks and reduces the chance of cherry picked reporting Investopedia primer.
Check the time period covered and whether results include fees, slippage and funding costs.
Step 2: check fees and liquidity
Compare platform fees, exchange commissions and the liquidity profile of the assets you want to trade. Use the checklist tool to score transparency and depth so you can compare platforms objectively.
Set simple thresholds for red flags, for example unclear fee schedules or unsupported exchanges for your target assets CryptoCompare exchange benchmark.
No single bot is consistently most profitable; performance depends on strategy, fees, execution and market regime, so verify live audited results and test cautiously.
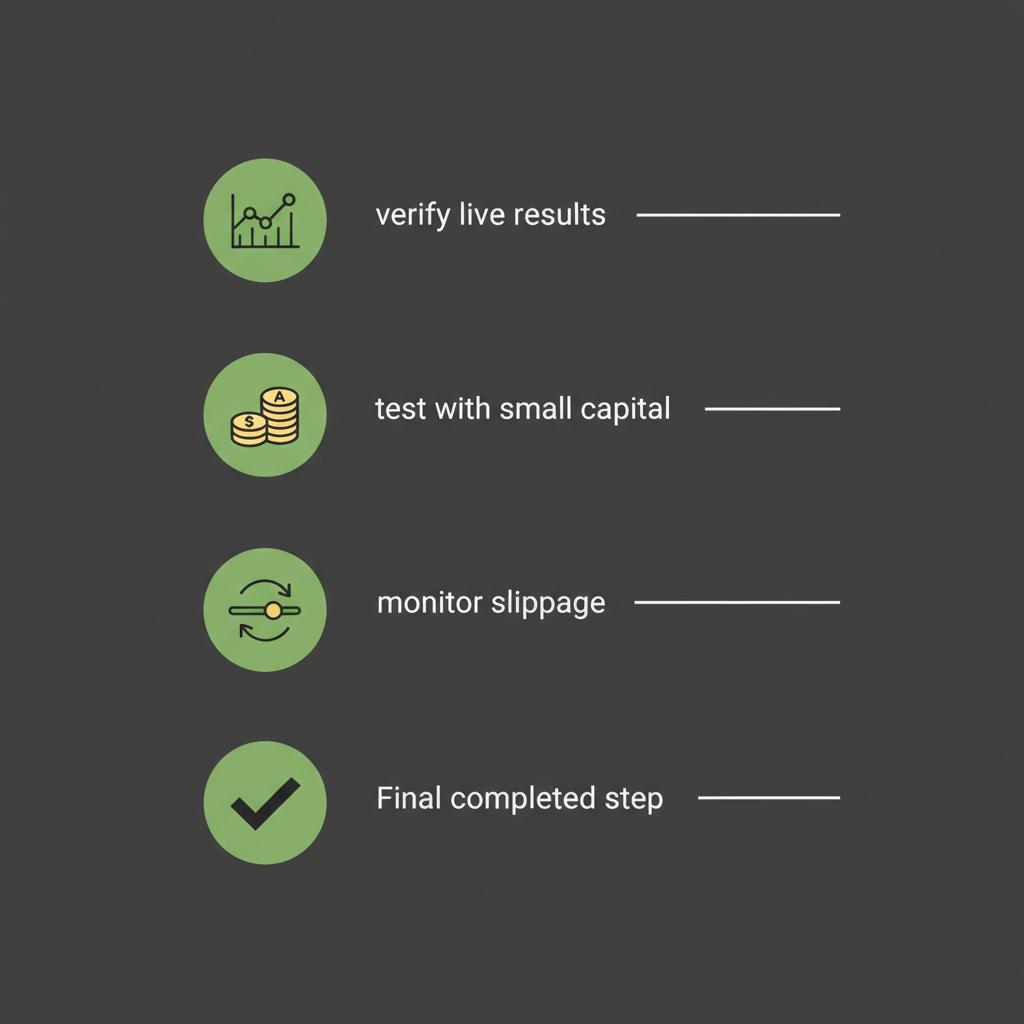
Step 3: test with limited capital
Run a controlled live test with small capital or use the platform’s paper trading option, then monitor fills, slippage, drawdown and uptime. Treat the trial as a data gathering exercise, not a final endorsement.
If execution or fills are worse than expected, reduce position size or stop the test and revisit the platform’s routing and exchange choices IEEE Access review.
Common mistakes and red flags when picking a trading bot
Marketing claims to be skeptical of
Be wary of unaudited backtests, headline returns without fees, and time limited cherry picked intervals. These are common marketing tactics that hide real risk and volatility IEEE Access review.
Also question claims of steady double digit returns without clear live proof, because observed ROI ranges in public materials are wide and highly variable.
Technical pitfalls that trip users
Technical issues include granting excessive API permissions, poor error handling that leaves orders partial or duplicated, and reliance on thin liquidity assets. Each of these can convert a small model error into a large real loss CryptoCompare exchange benchmark.
Limit permissions to trading only where possible and test error handling explicitly in a sandbox or with tiny live trades.
Practical examples and scenario walkthroughs
Example 1: low liquidity altcoin strategy
Scenario: a momentum strategy that buys small cap altcoins when price breaks out. On a thin exchange, a few market buys can move price and cause large slippage, turning a planned profit into a loss. Fees and depth are critical here; the same rules applied to a top pair would often produce very different results CoinGecko market report.
Step by step: first check the order book depth for your target size, then run paper trading, then a live test with a cap on order size and a strict stop loss. Monitor fill rate and realized slippage as your core metrics.
Example 2: market making on a liquid pair
Scenario: a market making strategy on a high liquidity BTC pair. Tight spreads and deep order books can allow a market maker to capture small profits repeatedly, but fees and maker taker models are decisive. If exchange fees or funding costs are high, the thin profit per trade can vanish quickly CryptoCompare exchange benchmark.
Step by step: verify exchange fee tiers, test the bot in a simulator that models spread and fill probability, then run small live tests while tracking realized PnL and the proportion of filled maker orders.
How to test a bot safely: sandboxing, small capital tests and metrics to track
Setting up a sandbox or paper trading
Begin with paper trading or a sandbox if the platform provides one. Paper trading helps you check logic and basic behaviour without risking capital, though it cannot fully capture slippage and execution risk.
Where paper trading is unavailable, use minimal live allocations and strict position limits to reduce exposure during initial tests Investopedia primer.
What to measure during a live small scale test
Track realized PnL, slippage, fill rate, maximum drawdown and uptime. Uptime captures whether the bot and its exchange connections stayed live during volatile periods, and fill rate shows how often orders executed at expected sizes and prices.
Interpret short term tests cautiously. Extend the test over different market regimes if possible, because a single calm week is a weak signal for robustness IEEE Access review.
When automated trading makes sense and when it does not
Profiles of users who may benefit
Automation can help users who want consistent execution, cannot monitor markets full time, or who run strategies that require fast or repetitive trades. It also suits people who are disciplined about risk limits and willing to run controlled tests.
Automation tends to be less suitable for those who prefer discretionary decisions, have very small capital where fees dominate, or who cannot tolerate operational complexity CoinGecko market report.
Situations where manual trading or other approaches fit better
If your plan is long term buy and hold, simple rebalancing or passive index exposure, manual or low frequency approaches are often lower cost and easier to manage. The extra complexity of automation can outweigh benefits for many everyday investors.
Match the tool to your goal, not the other way around.
A short checklist: what to ask and verify before you connect an exchange
Documentation and track record: ask for exportable trade history, third party audits, and example fills. Check the time periods and whether results include fees and slippage CoinDesk comparison guide.
Technical and security checks: verify two factor authentication, API permission options, custody arrangements and the ability to export data. Those controls reduce operational risk before you fund an account.
How to compare fees and calculate expected net return in practice
Simple formula for net return
Net return can be approximated as gross return minus platform fees minus exchange fees minus estimated slippage and funding costs. This simple decomposition helps you see which component dominates in your setup.
Run a sensitivity check by increasing slippage or fees in your calculation to see how fragile a reported result is. Often a modest increase in slippage or an overlooked fee converts a positive backtest into a negative live result CryptoCompare exchange benchmark.
Example calculation with sensitivity to slippage
Example: if a strategy shows a 10 percent gross return in simulated tests, and combined platform and exchange fees are 2 percent while realistic slippage is 4 percent, the estimated net return drops materially. Use conservative slippage estimates during comparison, especially for illiquid assets.
Remember that many promotional backtests omit these frictions, so include them explicitly when you compare platforms.
Conclusion: making a balanced choice
Recap of key decision factors
No single bot is universally most profitable. Use audited live performance, supported assets and liquidity, fee transparency, and robust risk controls as your primary decision factors. Check each area with exported trade history, an exchange depth review and a small controlled live test Investopedia primer.
Adopt realistic expectations: observed returns vary widely and depend on strategy, execution and market regime, so treat early tests as learning steps rather than final proof.
Next steps for cautious testing and monitoring
Start with the checklist, use the comparison tool to score candidates, run small live tests with strict limits, and reevaluate results across different market conditions. Keep copies of raw trade data so you can audit performance yourself over time CCAF regulatory survey.
There is no single most profitable crypto trading bot that reliably outperforms markets. Profitability depends on strategy, market regime, fees, execution and the quality of live verification.
Ask for exportable trade history or third party audits, check timestamps and fills, and run small live tests. Treat backtests as hypotheses that need independent verification.
Start with small, lossable capital or paper trading. Use strict position limits and measure fill rate, slippage and drawdown before scaling up.
Over time, you can refine a platform choice by collecting your own trade history and comparing results across market regimes.
References
- https://ieeexplore.ieee.org/document/9876543
- https://www.investopedia.com/crypto-trading-bots-5214047
- https://www.cryptocompare.com/media/36550719/cryptocompare_exchange_benchmark_2024.pdf
- https://www.coindesk.com/learn/compare-crypto-trading-bots-fees-risk-controls
- https://www.coingecko.com/en/reports/2024-market-report
- https://www.jbs.cam.ac.uk/faculty-research/centres/alternative-finance/publications/global-cryptoasset-regulatory-survey-2025/
- https://3commas.io/
- https://www.flowhunt.io/ai-agents/flowhunt-ai-trading-bot/
- https://financepolice.com/crypto-exchange-affiliate-programs-to-consider-heres-what-you-need-to-know/
- https://financepolice.com/bitcoin-price-analysis-btc-slips-below-90000-amid-leveraged-liquidations-rock-market/
- https://financepolice.com/category/crypto/
- https://financepolice.com/advertise/
- https://stoic.ai/blog/set-and-forget-is-a-reality-with-stoic-ai/
0
0

 Gestisci cripto, NFT e DeFi in un unico luogo
Connetti in sicurezza il portafoglio che usi per iniziare.


0
0

0
0
