Are Institutions Timing Bitcoin ETFs Using Tech Stocks?

0
0

Bitcoin (BTC) has dropped over 40% from its October 2025 high near $126,000, and institutional investors hold the key to recovery via Bitcoin ETFs. The answer may lie in a signal most traders overlook.
BeInCrypto’s proprietary BTC-NASDAQ correlation chart, combined with monthly spot ETF (exchange-traded fund) flow data, reveals a consistent pattern. When Bitcoin moves in sync with tech stocks (NASDAQ index), institutional money follows through ETFs. When that link breaks, the money dries up.
Why Wall Street Watches NASDAQ Before Buying Bitcoin ETFs
Bitcoin does not generate yield. It has no earnings reports, no dividends, and no cash flow metrics for traditional portfolio managers to model. For institutions allocating capital through spot Bitcoin ETFs, the asset sits inside the same risk bucket as technology stocks.
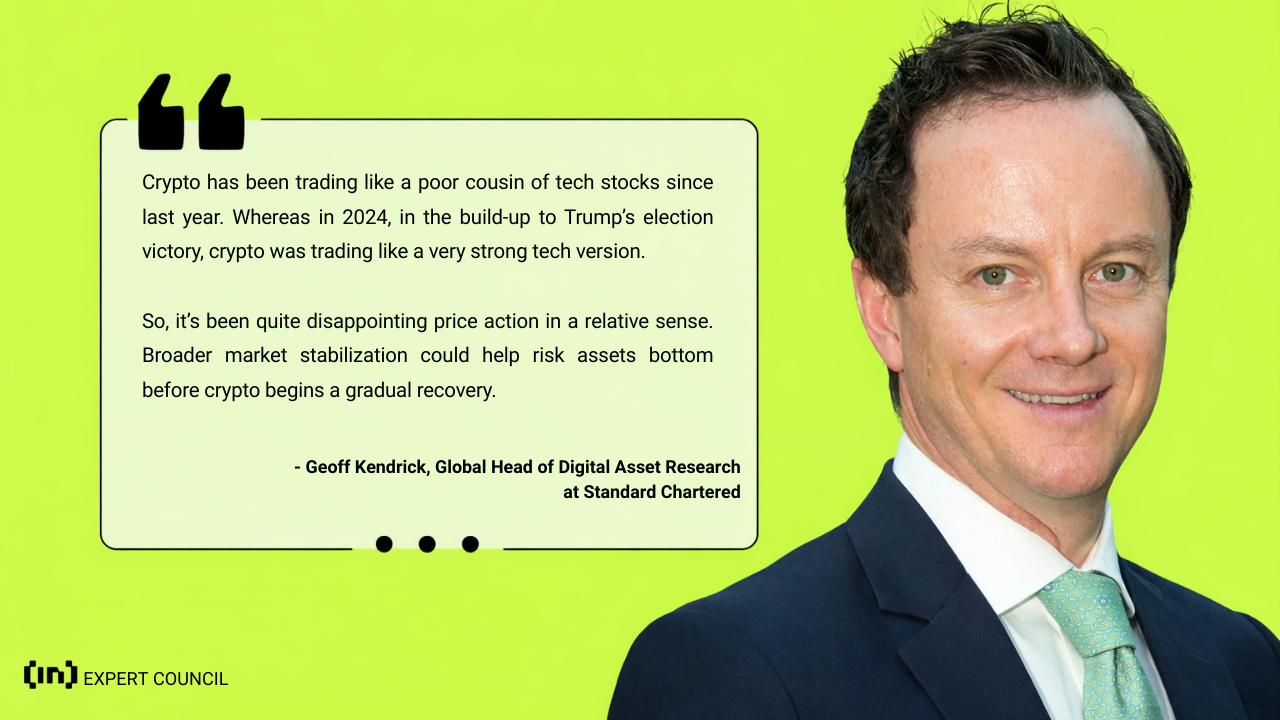
Geoff Kendrick, Global Head of Digital Asset Research at Standard Chartered, framed this relationship during a recent BeInCrypto Expert Council session. He noted that crypto traded like a strong version of tech in 2024 during the build-up to the US election. Since then, however, Bitcoin has behaved more like a weaker cousin of tech stocks, with disappointing relative price action. He also suggested BTC forming a base around $60,000, with even $50,000 being a possibility.
This framing explains why the NASDAQ correlation matters more than the S&P 500 or Dow Jones for Bitcoin. The NASDAQ Composite, widely considered a proxy for US technology stocks, possibly serves as the benchmark institutional desks watch before rotating into Bitcoin ETFs.
The same institutional desks managing tech allocations are usually the ones rotating capital into Bitcoin ETFs. Their risk models treat both assets as high-beta, growth-sensitive positions.
A Correlation Pattern Behind $90 Billion in Bitcoin ETF Flows
Data from SoSoValue shows that US spot Bitcoin ETFs now hold over $90 billion in total net assets. A month-by-month comparison of these flows against the BTC-NASDAQ correlation reveals a repeating pattern.
In late 2023, the correlation entered a sustained green phase around November. Within weeks, the first spot Bitcoin ETFs launched in January 2024, pulling in about $1.5 billion.
Want more token insights like this? Sign up for Editor Harsh Notariya’s Daily Crypto Newsletter here.
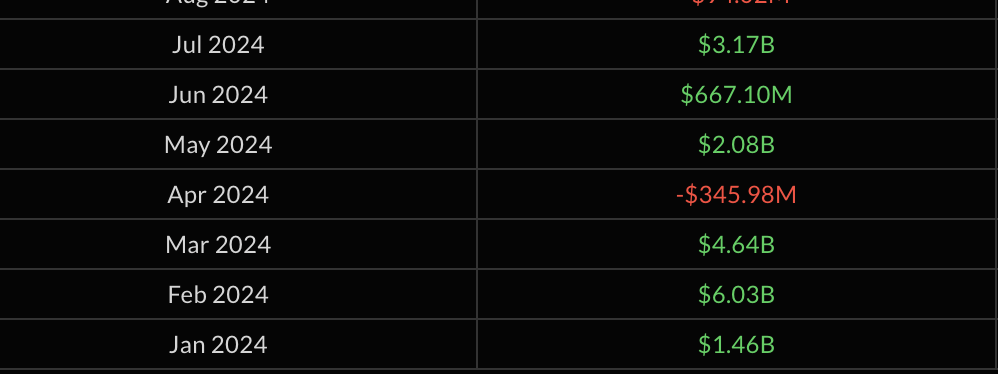 Early 2024 Bitcoin ETF Flows: SoSo Value
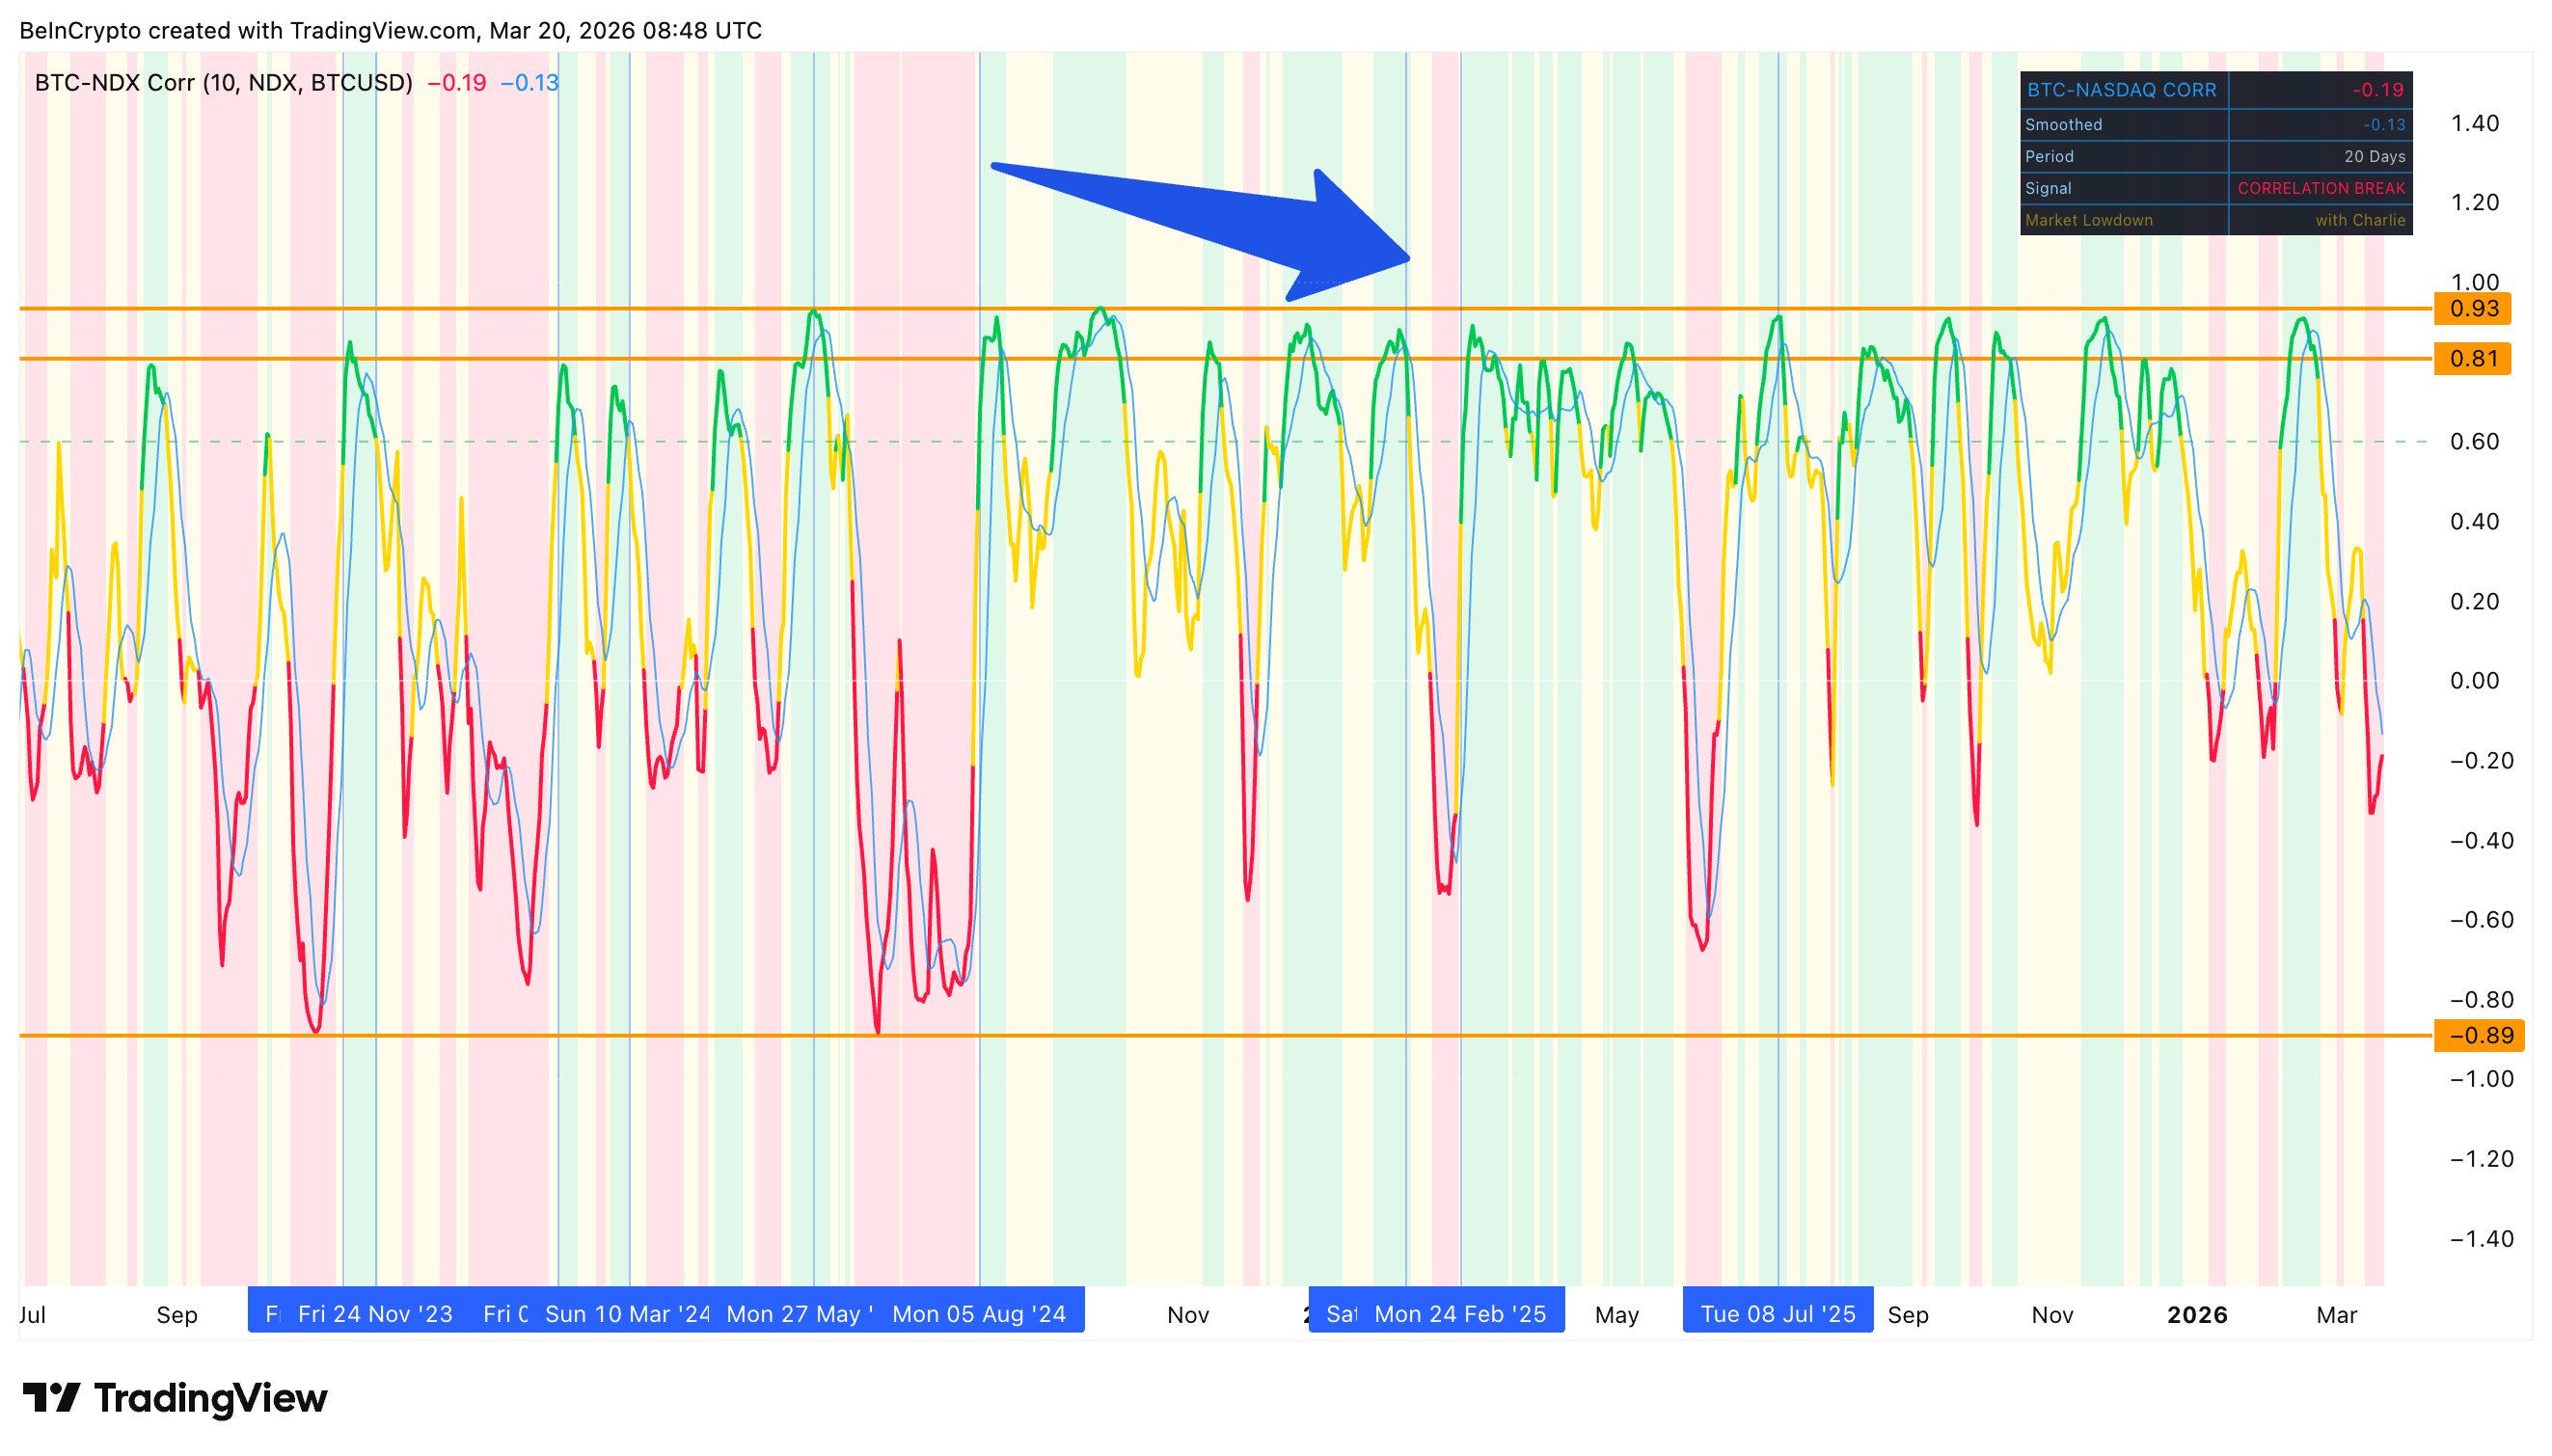
February and March 2024 followed with $6 billion and $4.6 billion, respectively, as the correlation stayed elevated with multiple peaks pressing against 0.81.
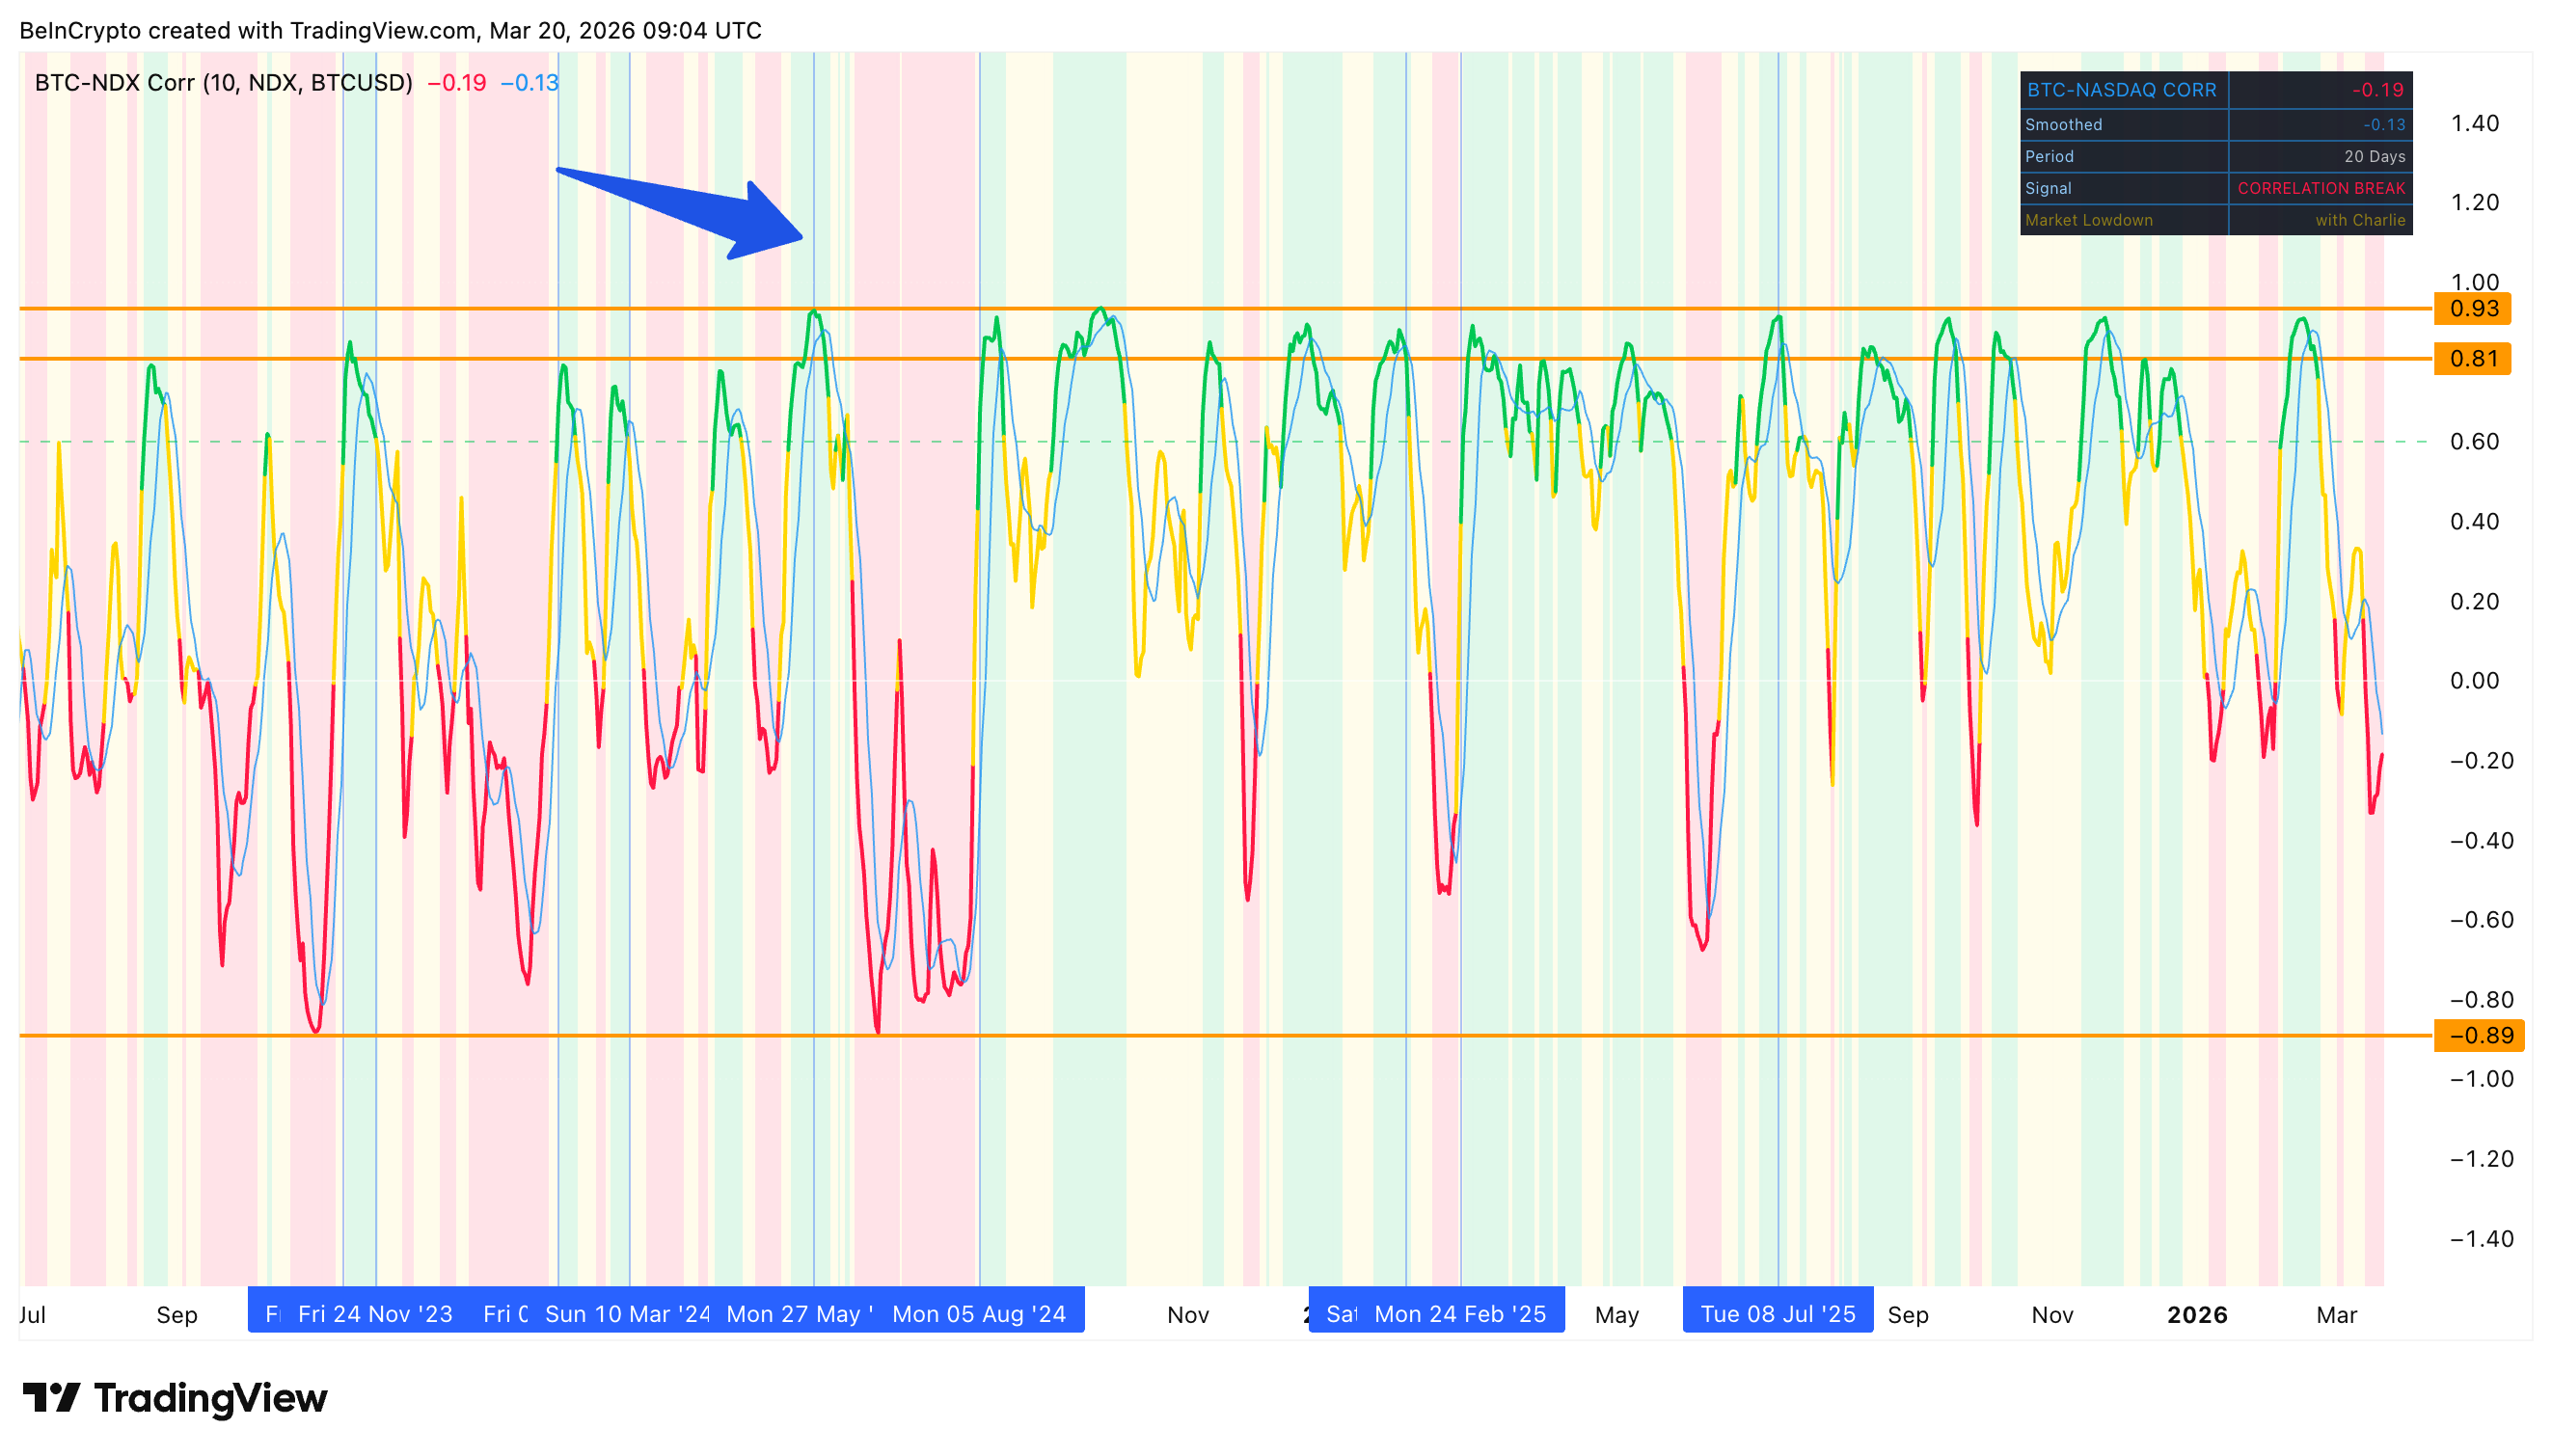 Early 2024 Correlation: TradingView
The most striking example came in May 2024. The correlation hit its cycle high of 0.93, and ETF inflows reached $2.08 billion following a red month in April that saw $346 million in outflows. When the correlation collapsed to minus 0.89 in June 2024, inflows dropped to just $667 million. That was the weakest inflow month since the ETFs launched, despite billion-dollar months on either side.
The pattern held into late 2024. A five-month stretch of strong positive correlation between August 2024 and January 2025 aligned with consistent inflows.
 Early 2025 Correlation: TradingView
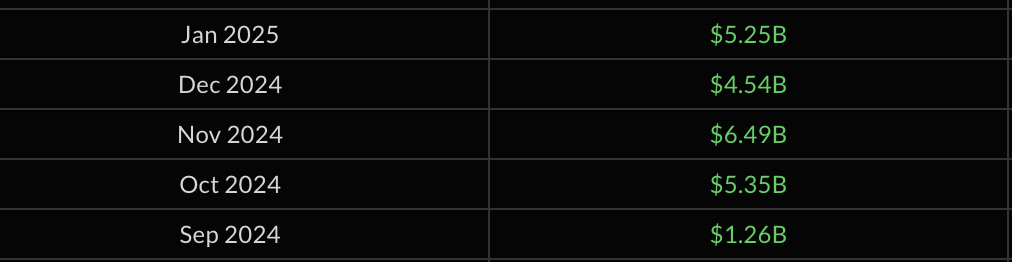
September through January pulled in over $22 billion combined, with November alone contributing $6.5 billion.
 Late 2024 Bitcoin ETF Flows: SoSo Value
The inverse also proved reliable. When February and March 2025 saw deep correlation dips, ETF flows turned sharply negative.
 Late 2025 Bitcoin ETF Flows: SoSo Value
Between April and July 2025, the correlation band turned predominantly green again.
 Mid-2025 Correlation: TradingView
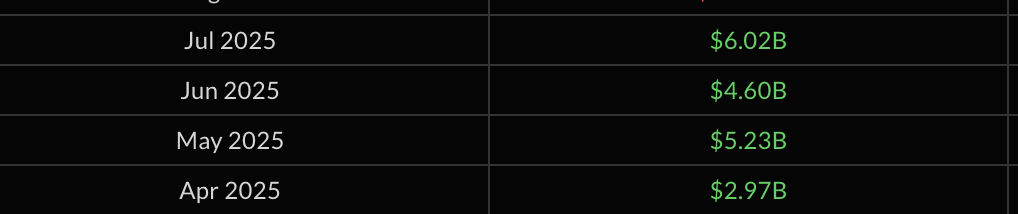
ETF inflows surged back, with July 2025 recording $6 billion.
 Mid-2025 Bitcoin ETF Flows: SoSo Value
This set the stage for Bitcoin’s rally toward its October 2025 all-time high near $126,000.
M2 Liquidity Adds Another Layer to the Institutional Chain
The BTC-NASDAQ correlation does not operate in isolation. Global M2 money supply, which measures the total money circulating across major economies, acts as the underlying fuel.
Research from Lyn Alden, macro researcher and founder of Lyn Alden Investment Strategy, has shown a historical high correlation between Bitcoin’s price and global M2. The correlation was flagged way back in 2024, validating the money flow thesis.
VanEck estimates that M2 explains roughly 54% of Bitcoin’s price variance. The transmission chain works in sequence. Global liquidity expands, tech stocks rally, the BTC-NASDAQ correlation strengthens, and institutional money flows into Bitcoin ETFs.
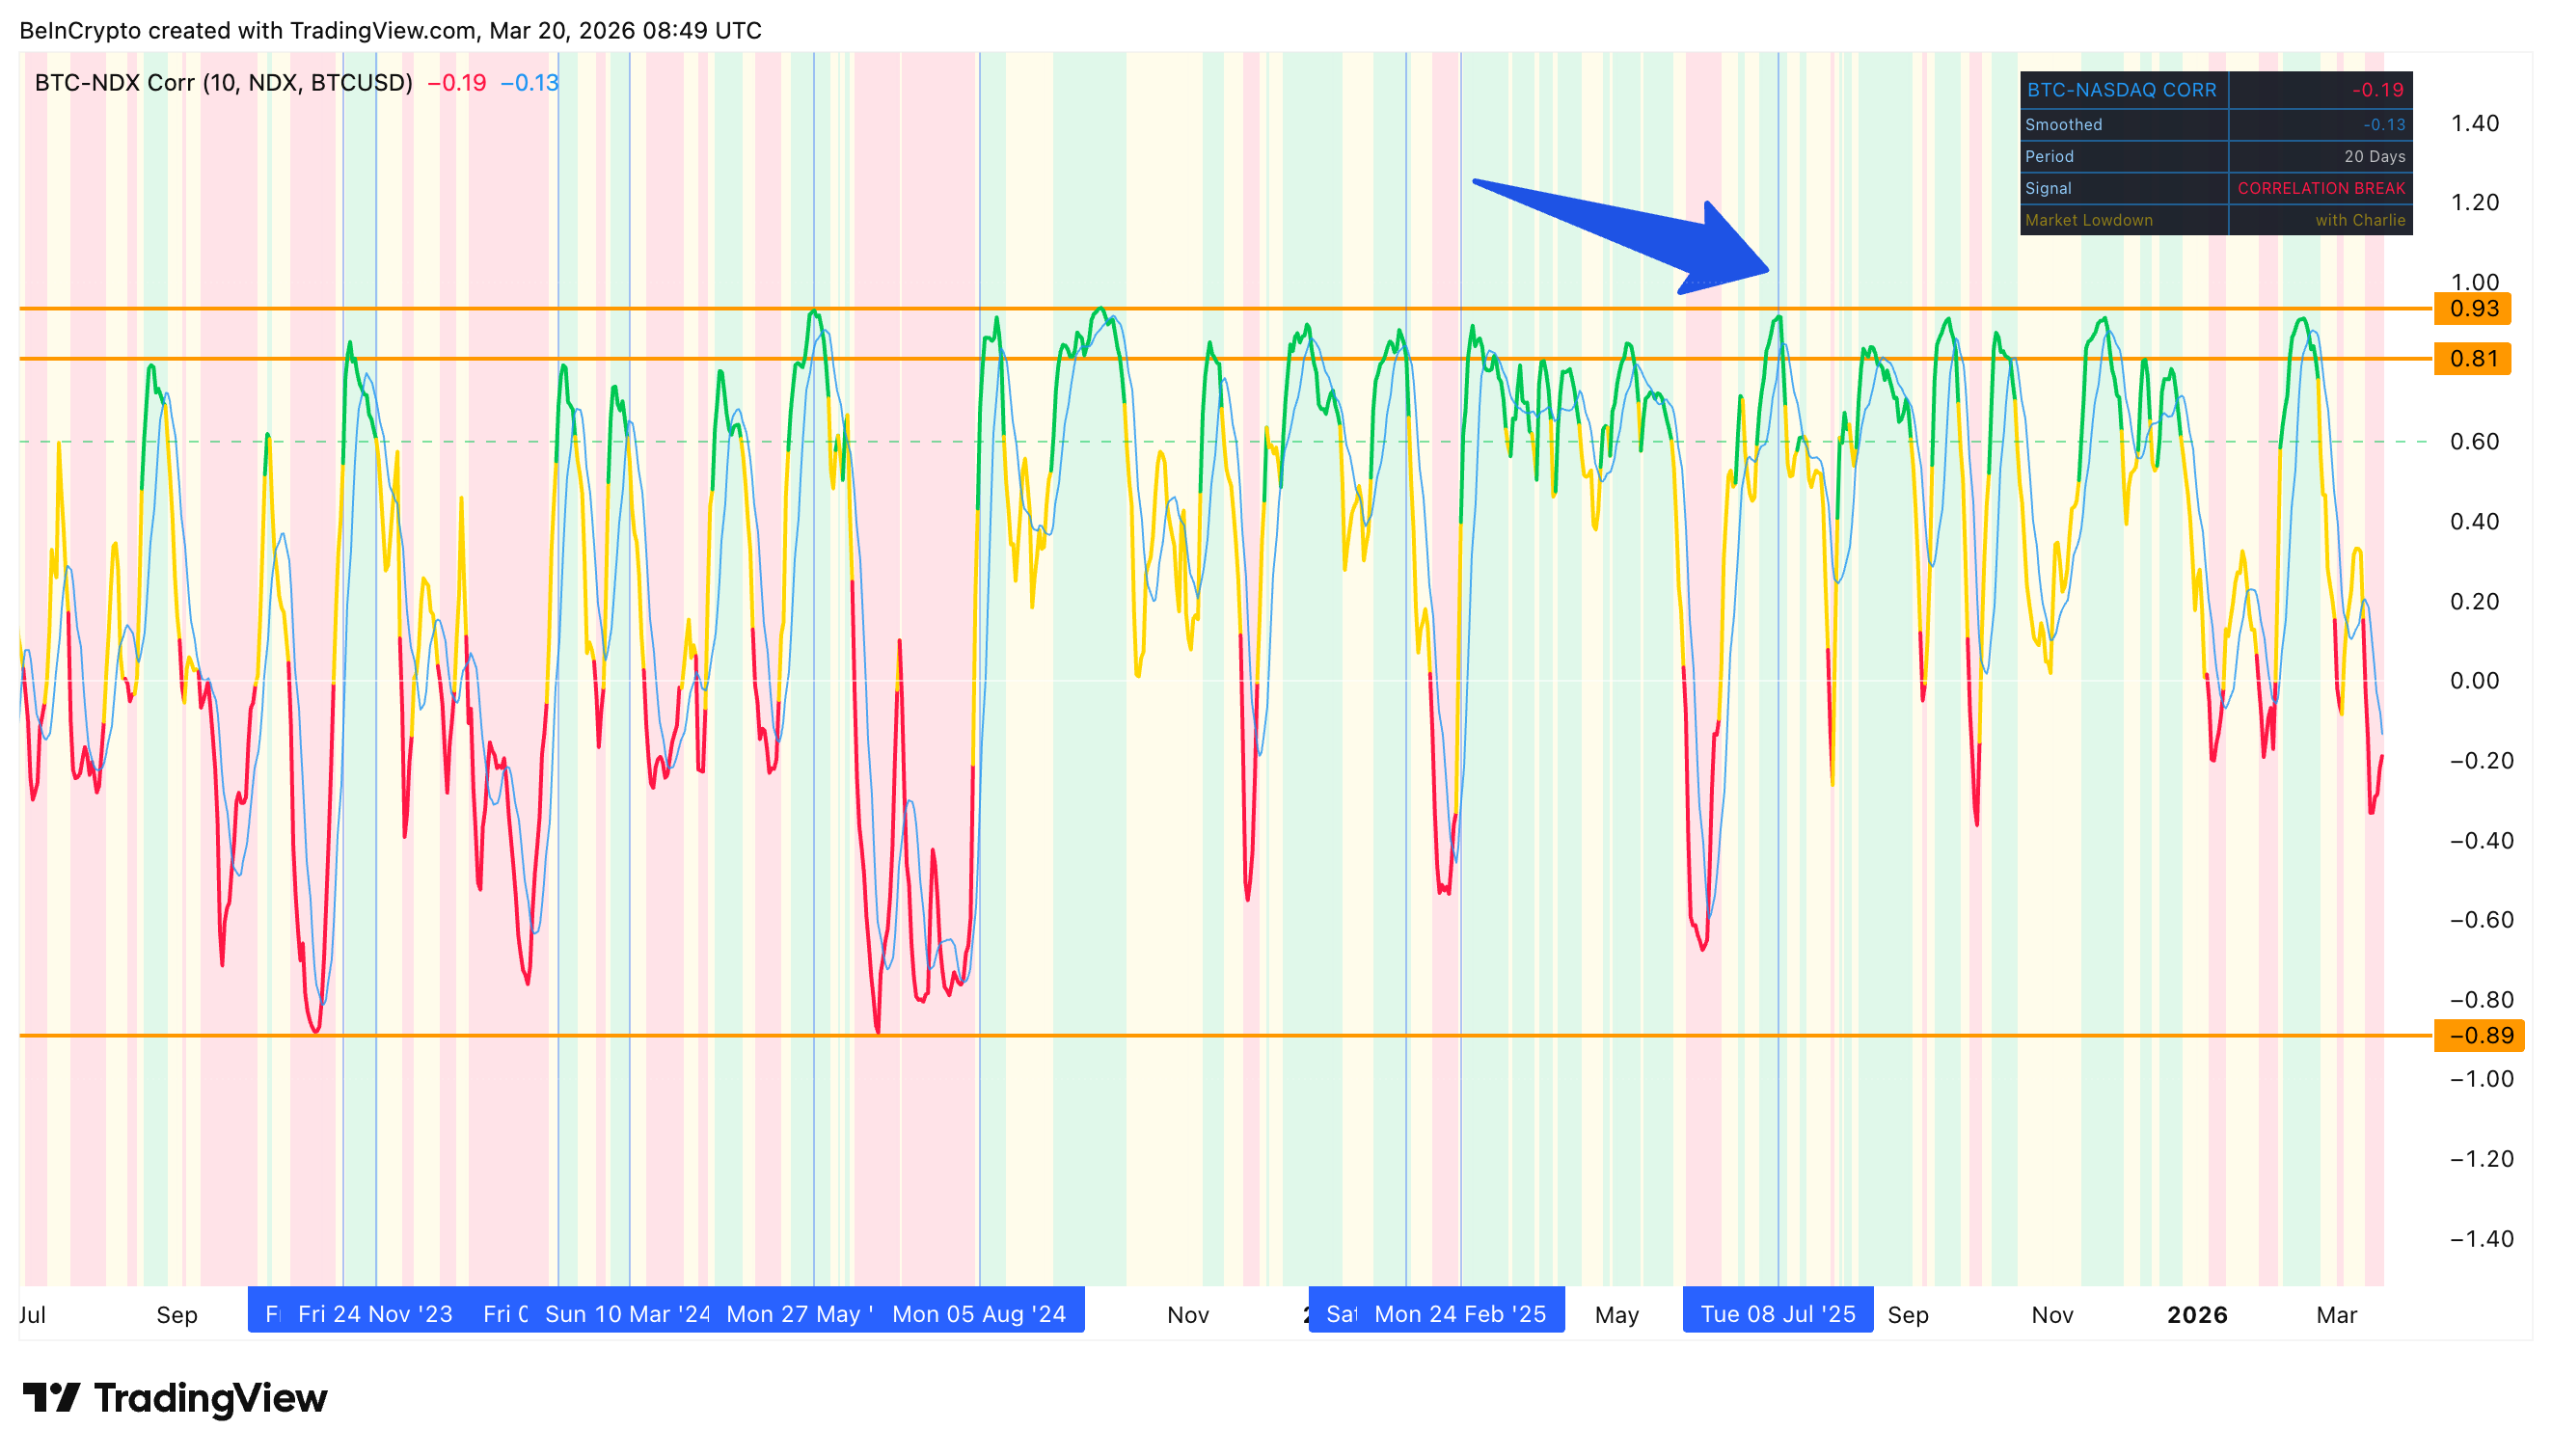
However, this chain broke down in mid-2025. Global M2 has grown over 10% year-over-year, yet Bitcoin shows negative annual returns. The correlation link that converts M2 expansion into ETF inflows (and BTC price growth) stopped functioning when the BTC-NASDAQ correlation entered prolonged negative territory between September 2025 and February 2026, with fewer upsides.
 Weak 2025-2026 Correlation: TradingView
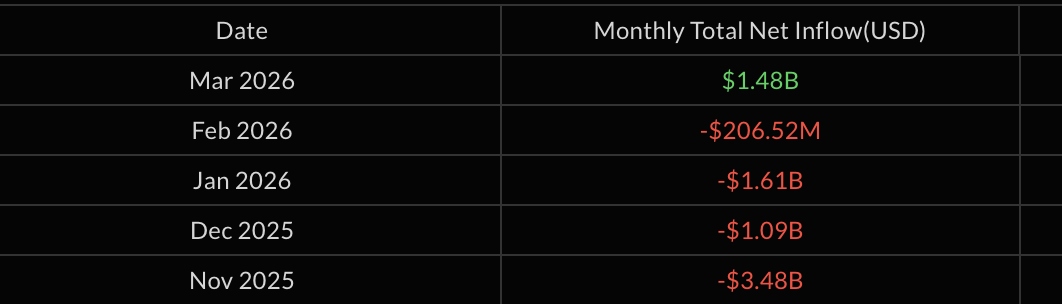
During that red stretch, ETF outflows were severe. November 2025 recorded $3.5 billion in outflows, followed by $1.1 billion in December and $1.6 billion in January 2026.
 Early 2026 Bitcoin ETF Flows: SoSo Value
Fidelity maintains that the M2 relationship will reassert itself as the global easing cycle deepens and the Fed’s quantitative tightening (QT) program ends. The question is whether the NASDAQ correlation will re-engage to serve as the transmission mechanism.
What Bitcoin ETF Flows and $70,000 Signal for BTC Price
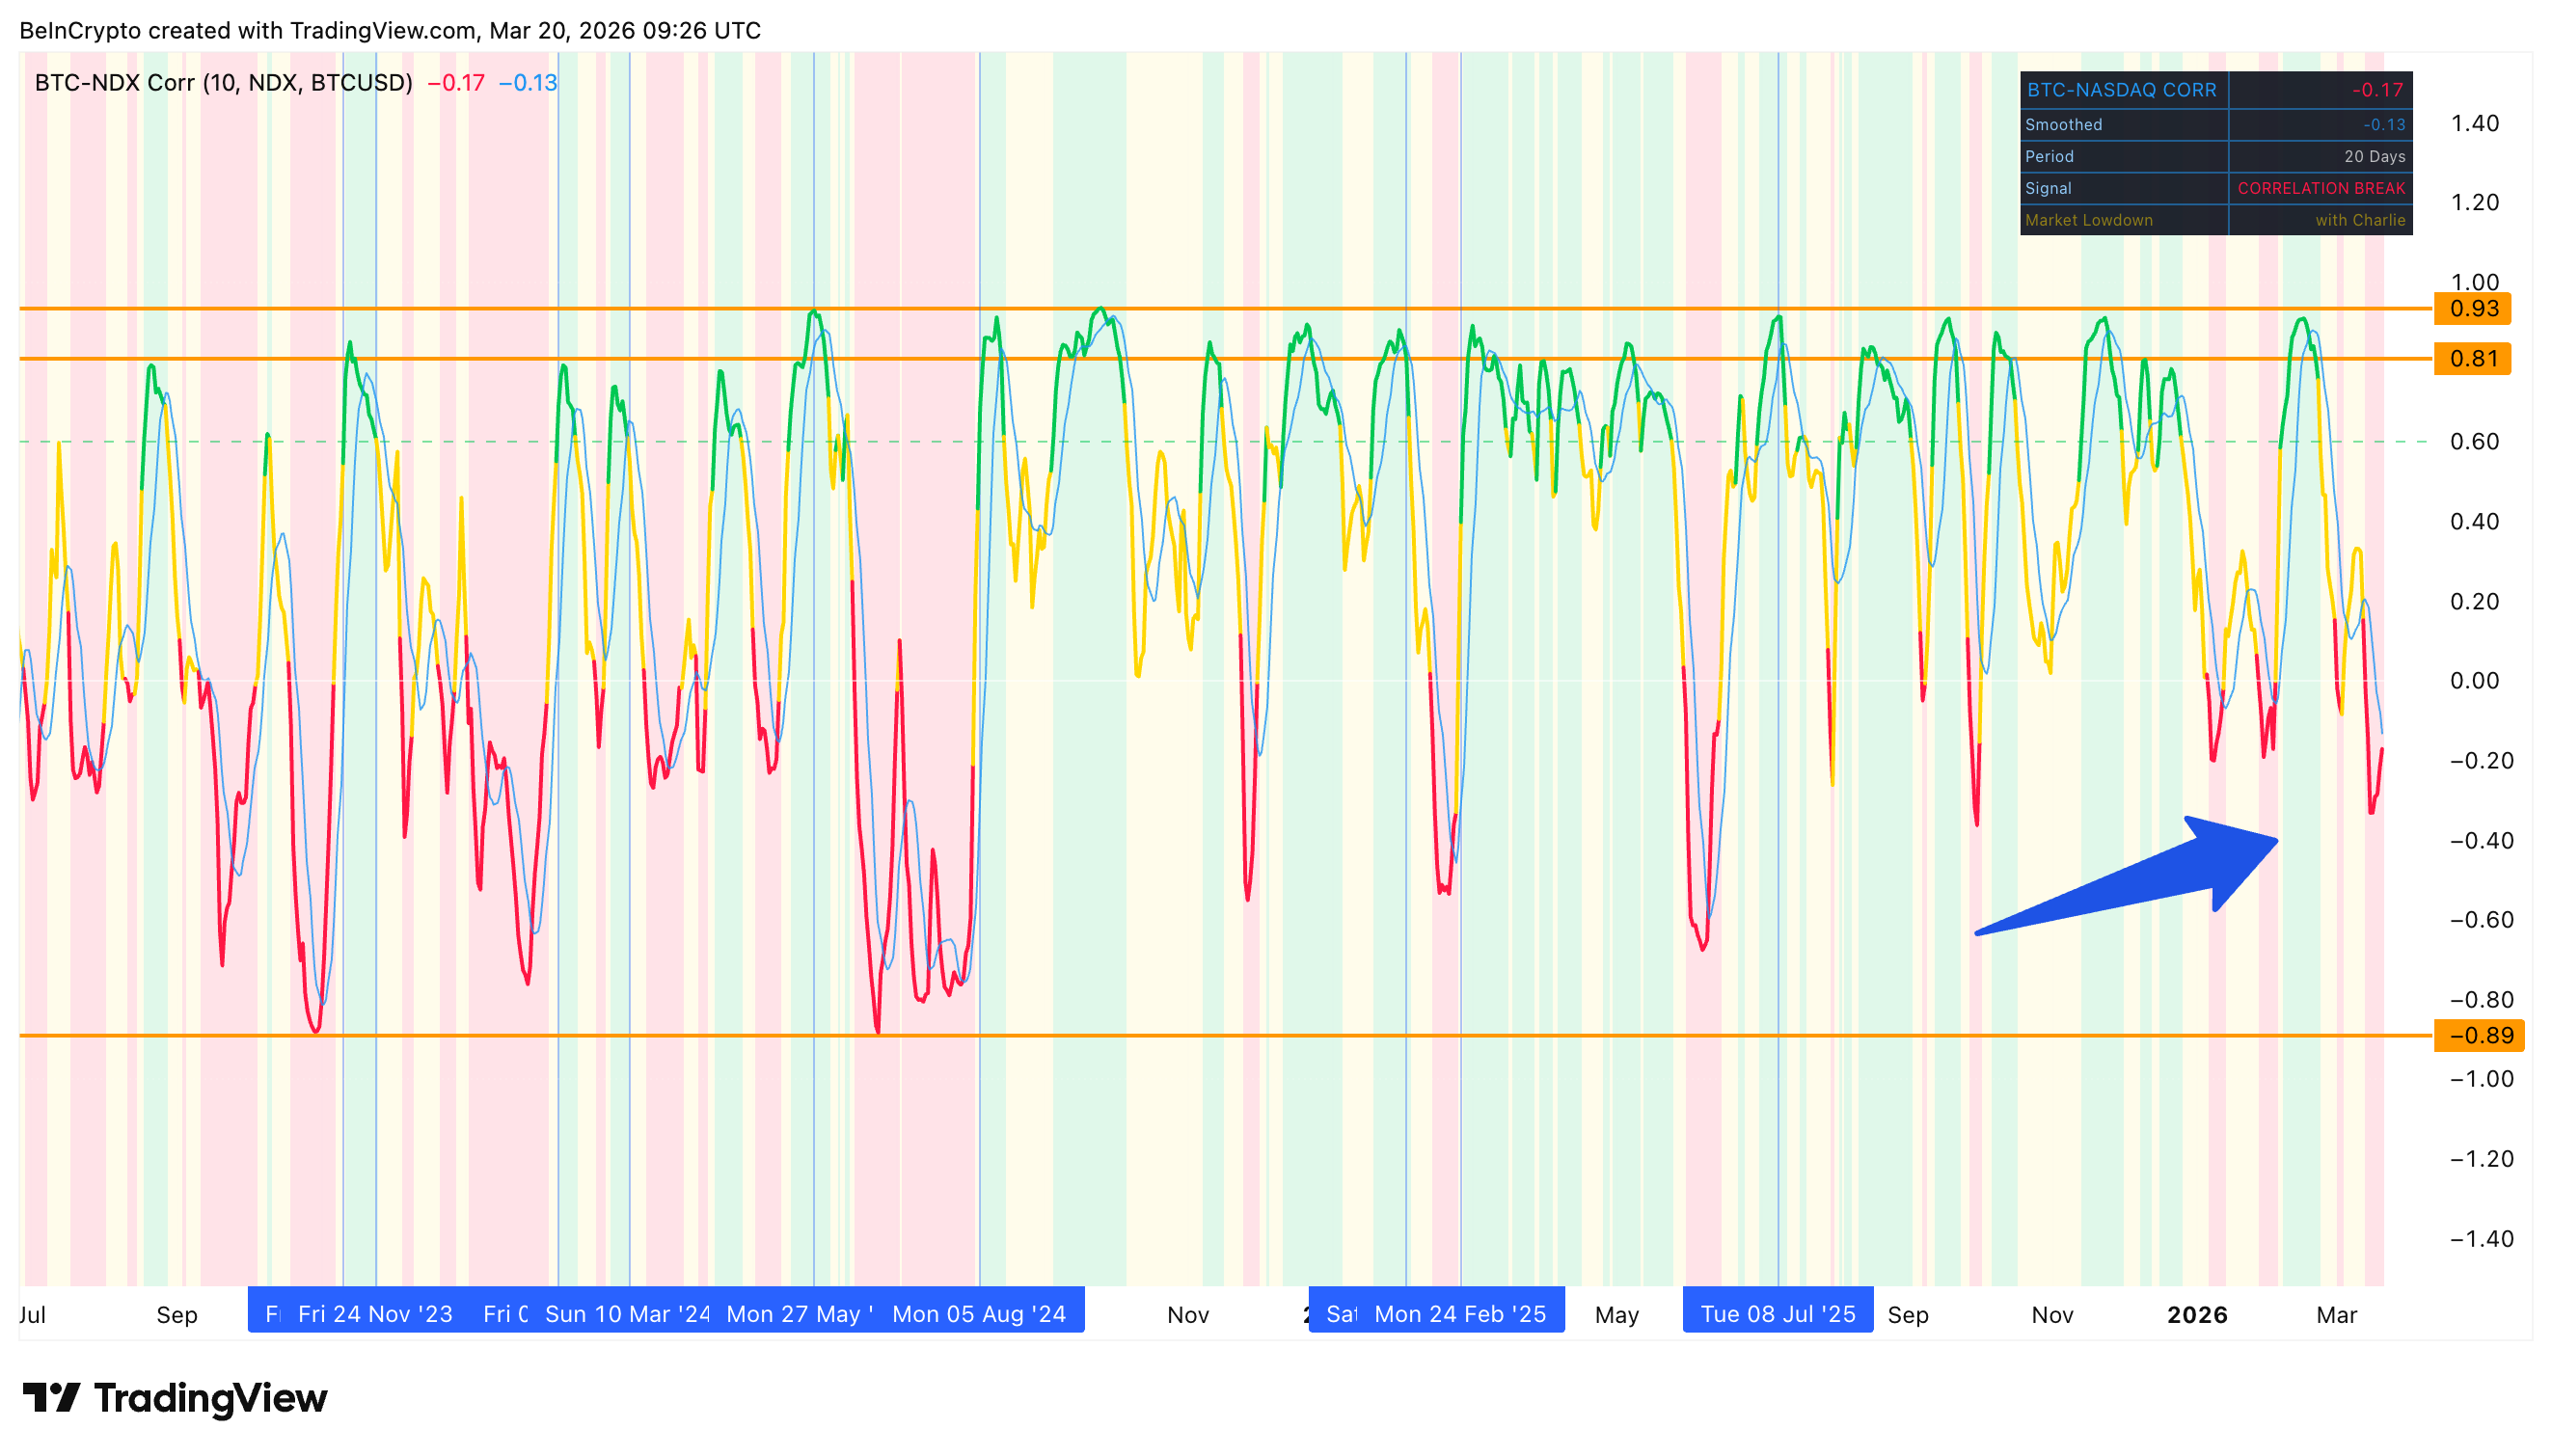
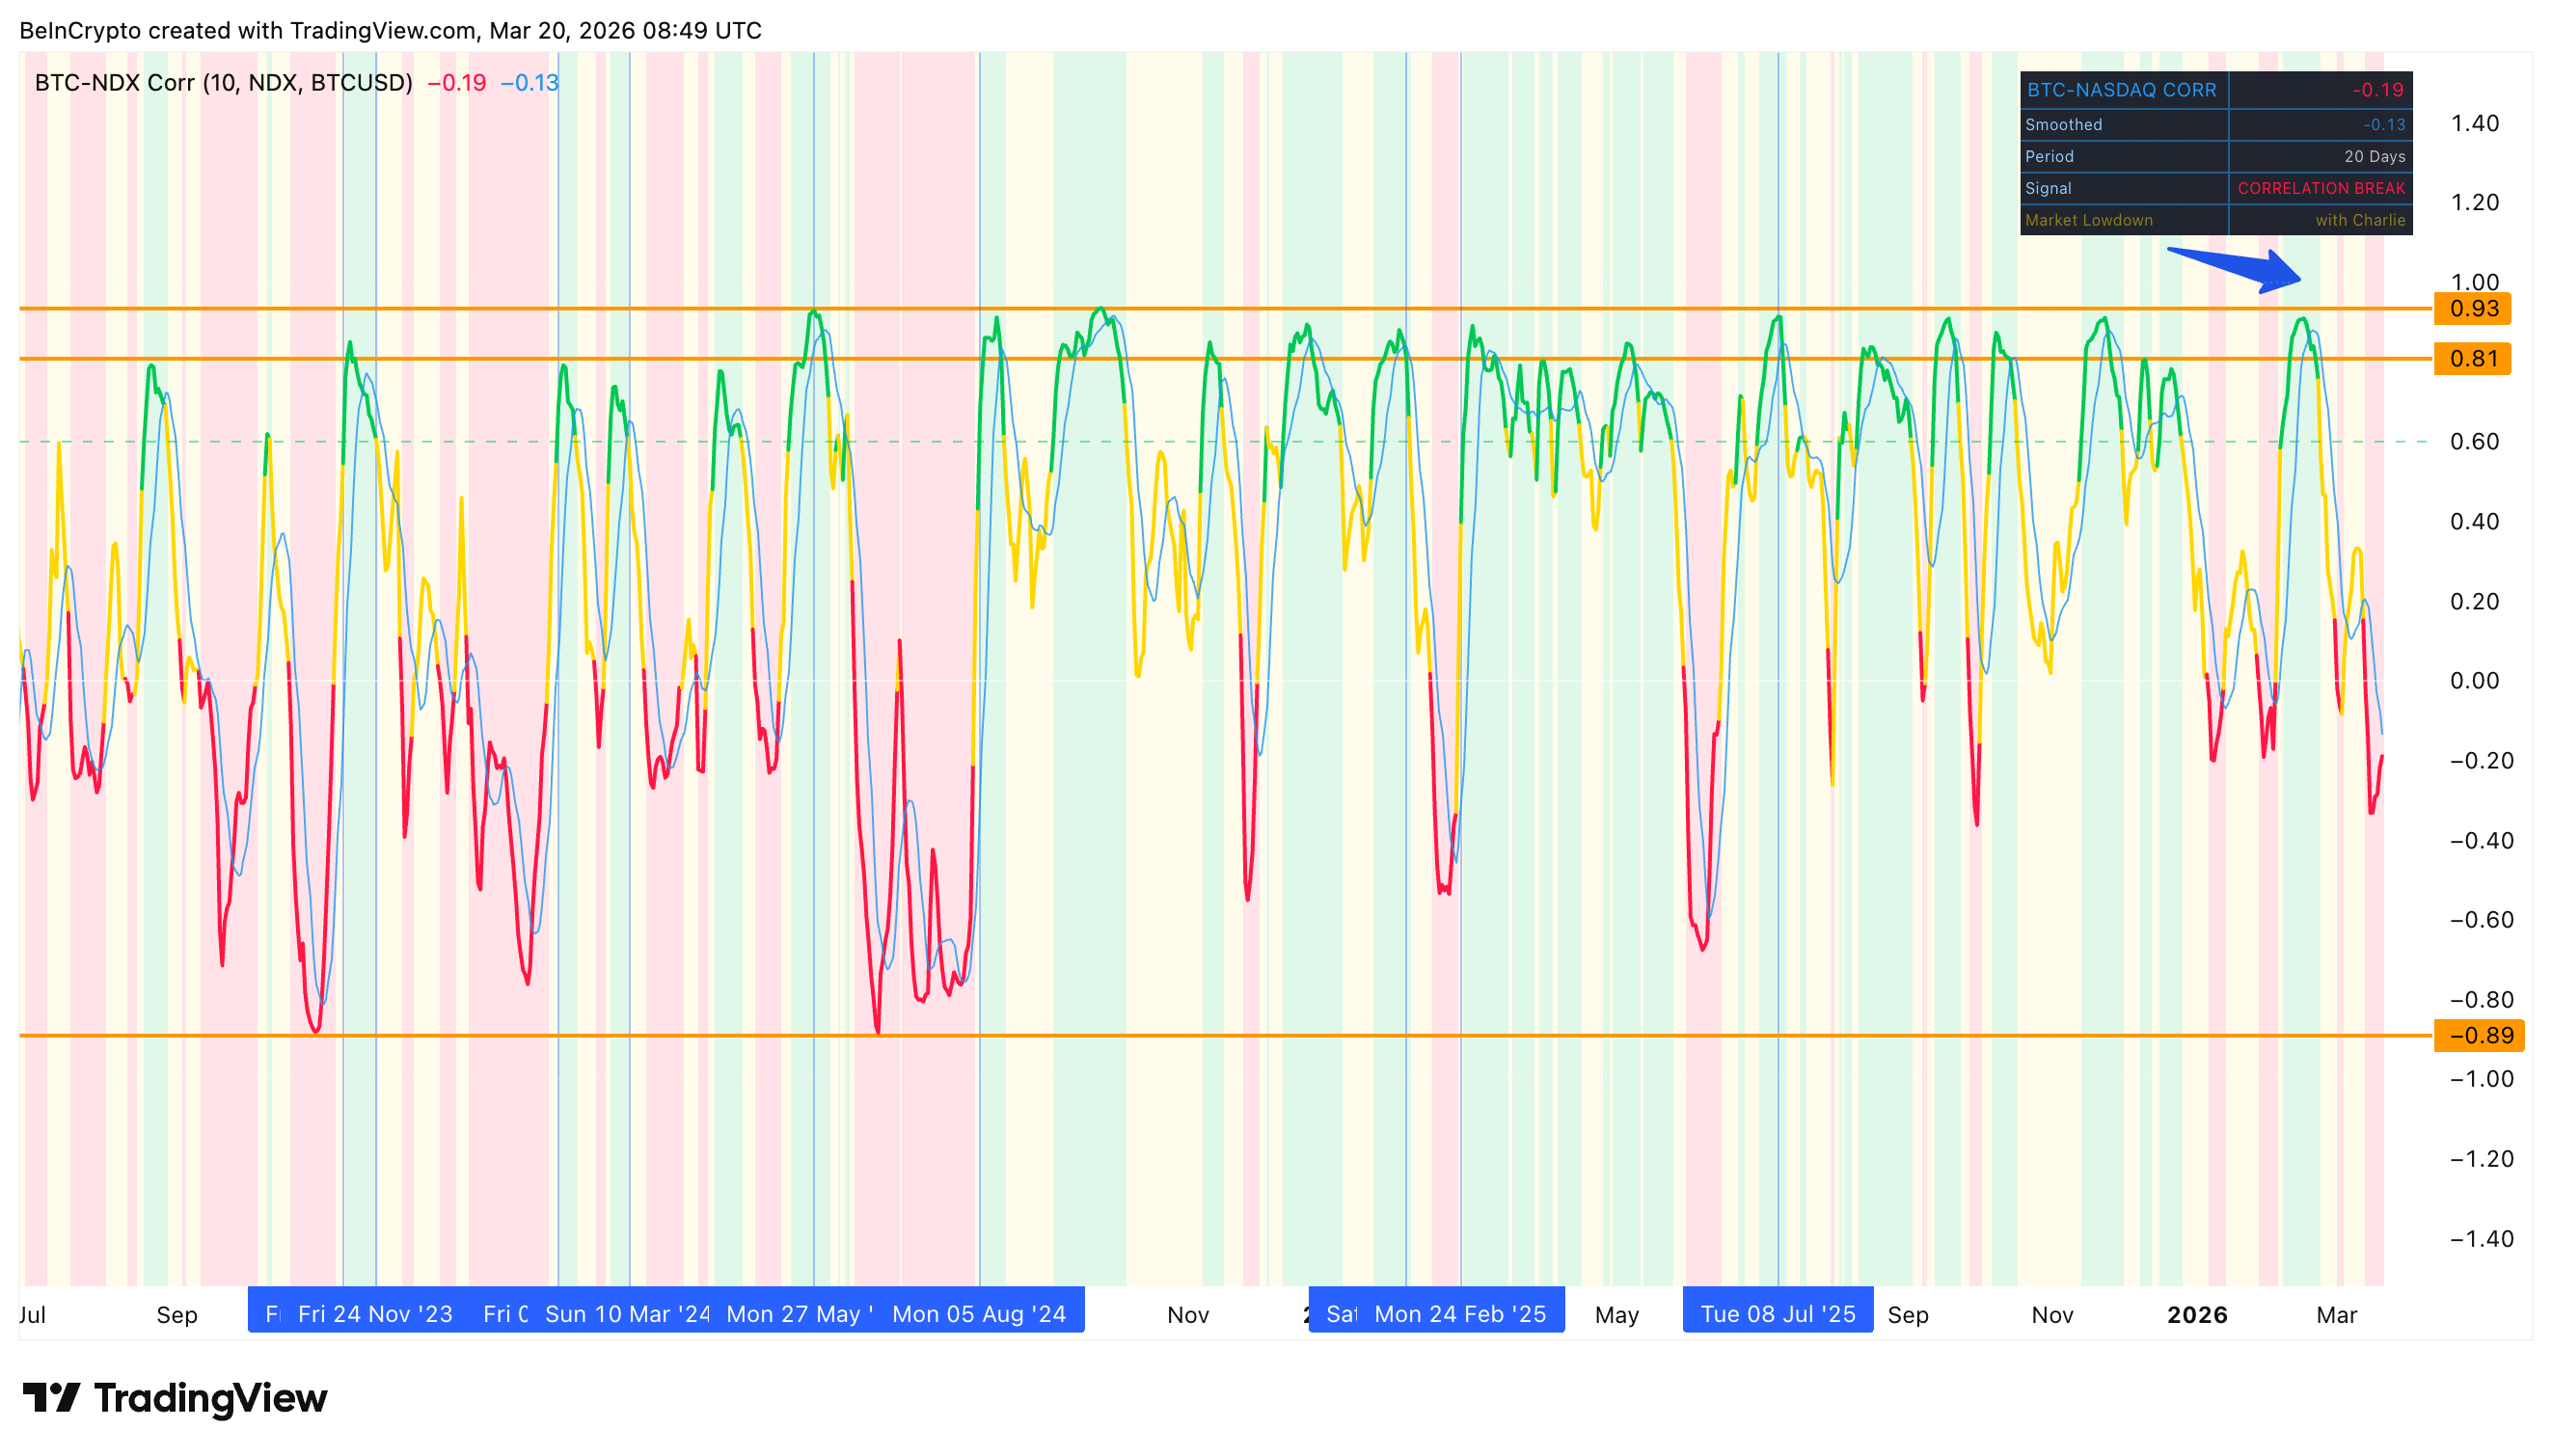
March 2026 has recorded $1.48 billion in ETF inflows, the first green month since October 2025. February’s outflows also narrowed sharply to $207 million from $1.6 billion in January. On the surface, the chain looks like it is reconnecting as the correlation briefly turned green in mid-February.
 Correlation Improves: TradingView
However, the correlation indicator now reads minus 0.19 with a “Correlation Break” signal. Over the past month, Bitcoin has been up roughly 3.6% while the NASDAQ has been down by a similar margin. That inverse move is exactly what keeps institutional allocation models dormant. Negative correlation phases, as this analysis shows, repel ETF flows rather than attract them.
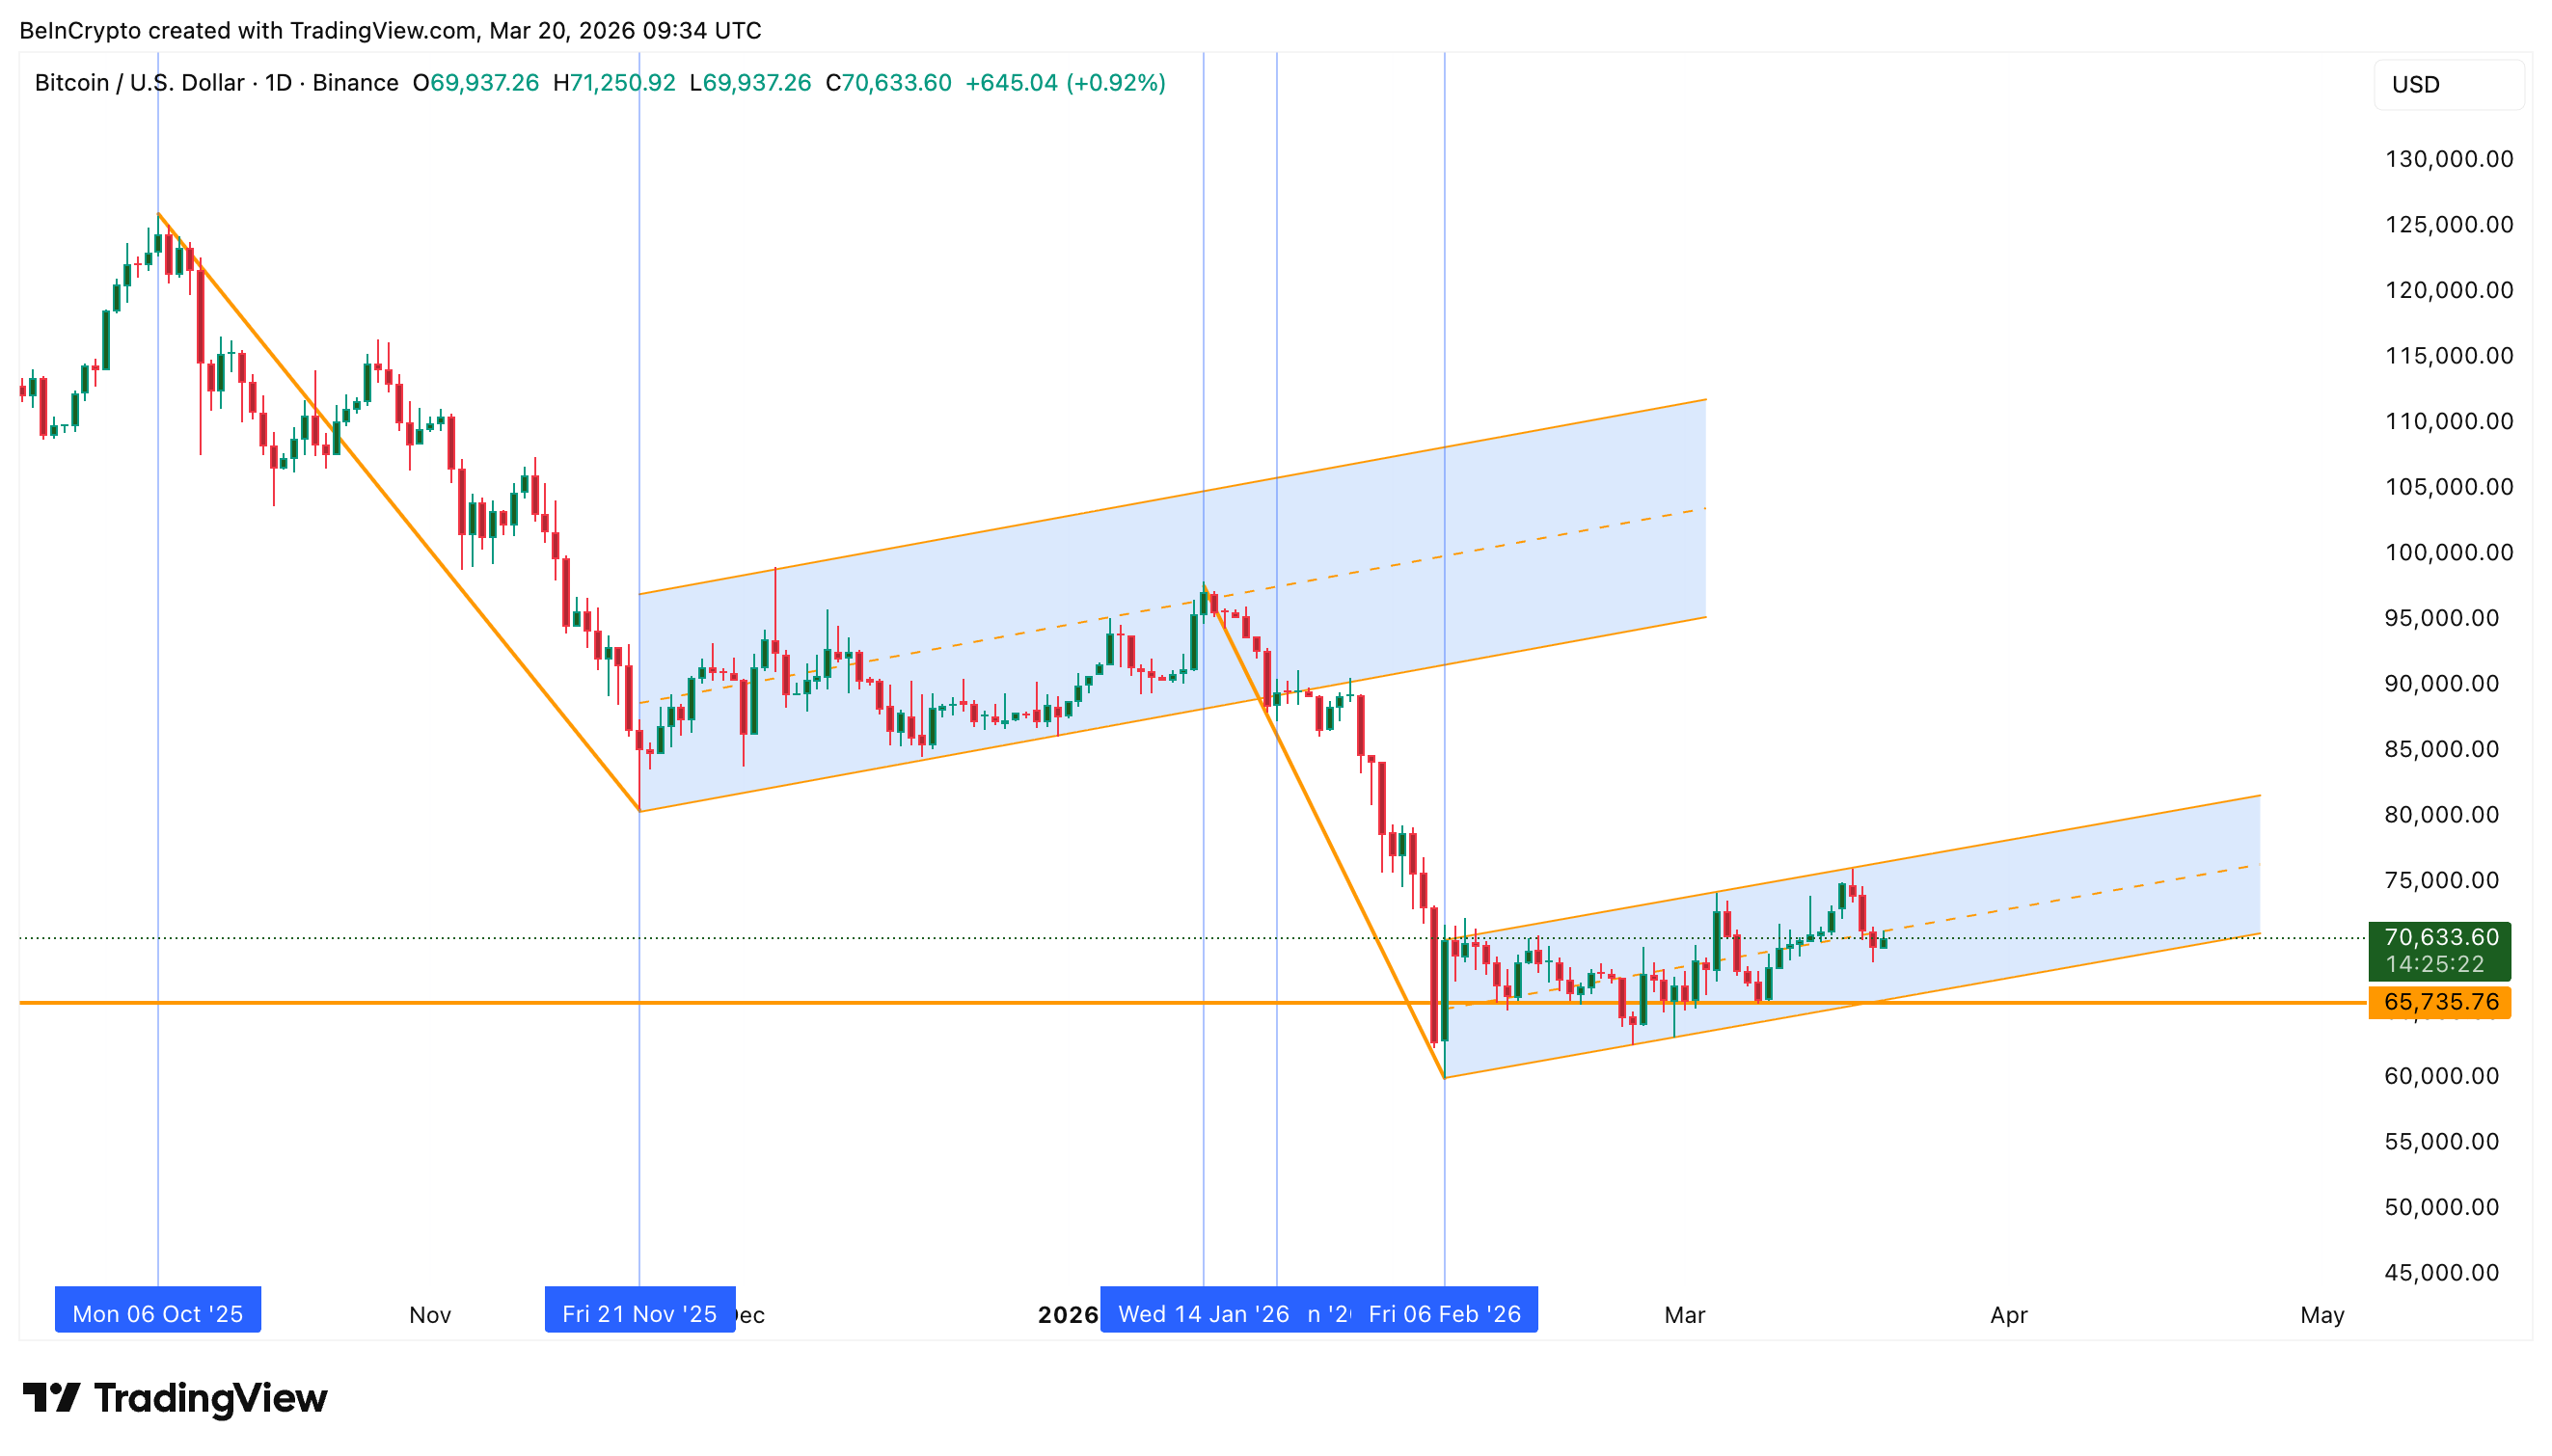
The price chart adds to the concern. Bitcoin’s daily structure near $70,600 shows a rising channel that mirrors the consolidation phase between November 2025 and early January 2026. That earlier pattern ended with a breakdown that extended the decline from $126,000. A similar fractal is now forming, with the critical floor at $65,700.
 BTC Price Analysis: TradingView
The global M2 decoupling remains unresolved. M2 continues to grow over 10% year-over-year while Bitcoin posts negative annual returns. The NASDAQ is not rallying to absorb that expansion, which means the correlation cannot flip positive in the short-term, and the institutional model stays switched off.
If the rising channel breaks below $65,700, the October-to-January fractal would repeat. Geoff Kendrick flagged this scenario during the BeInCrypto Expert Council session, noting that broader market stabilization would need to arrive first before crypto begins a gradual recovery. Without that stabilization, the same institutional timing model that powered Bitcoin’s rallies could confirm a move toward $50,000, one level Kendrick highlighted earlier.
0
0


 한 곳에서 모든 암호화폐, NFT 및 DeFi 를 관리하세요
시작하는 데 사용하는 포트폴리오를 안전하게 연결하세요.


