
Cardano Price Prediction: Will $ADA Price Recovery Continue or Stall?

0
0

Bitcoin is holding near $63,000, and Ethereum sits close to $1,835 today, with the total crypto market cap slipping to $2.17 trillion as risk appetite cools across the board.
Against that backdrop, Cardano is running its own smaller drama, one written entirely in candlesticks and moving averages rather than headlines.
This Cardano price prediction breaks down exactly what the chart is saying and where it points next.
Key Takeaways
-
ADA is trading near $0.161, inside a falling channel that has held since its early July rejection at $0.20
-
A 20/50 EMA bearish crossover formed inside the channel, a short-term bearish signal
-
RSI sits at 44.49, in neutral territory, neither oversold nor overbought
-
Short-term upside path: $0.1745 → $0.1833 → $0.19 → $0.20
-
Short-term downside path: $0.1486 → $0.1381
-
Long-term Fibonacci extension targets sit at $0.2389 above and $0.10 below
At What Price is Cardano Trading Today?
Here is where Cardano's price today stands as per CoinMarketCap live market data:
Volume rising more than 22% while price barely moved is typically read as accumulation or repositioning rather than panic, and it sets the stage for the technical structure below.
How Are ADA Derivatives Signaling Market Sentiment?
As per CoinGlass data , derivatives positioning shows a mixed but leaning-long picture:
Long positions have absorbed the vast majority of liquidations over both the 12-hour and 24-hour windows, showing leveraged buyers were caught out during the recent decline.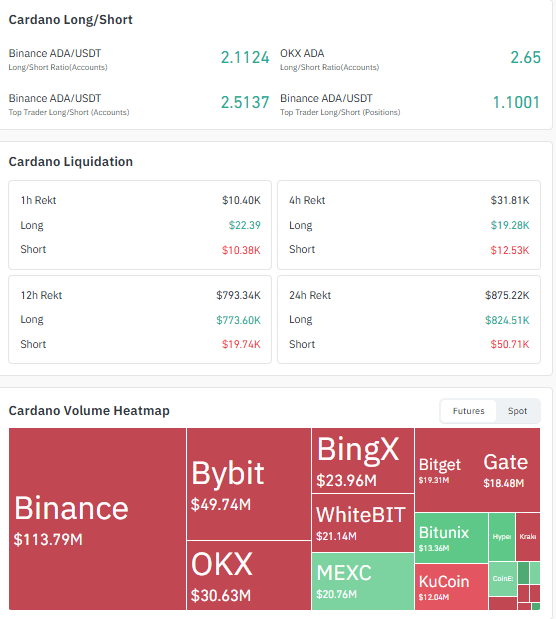
Trading volume remains concentrated on Binance at $113.79 million over 24 hours, followed by Bybit and OKX, according to the same CoinGlass tracking.
How Is Cardano's Chart Structure Shaping This ADA Price Outlook?
On the TradingView 4-hour chart the Cardano price prediction story began with a recovery off the all-time low, a move that gathered pace through late June and carried the price up toward the $0.20 level by July 5, 2026.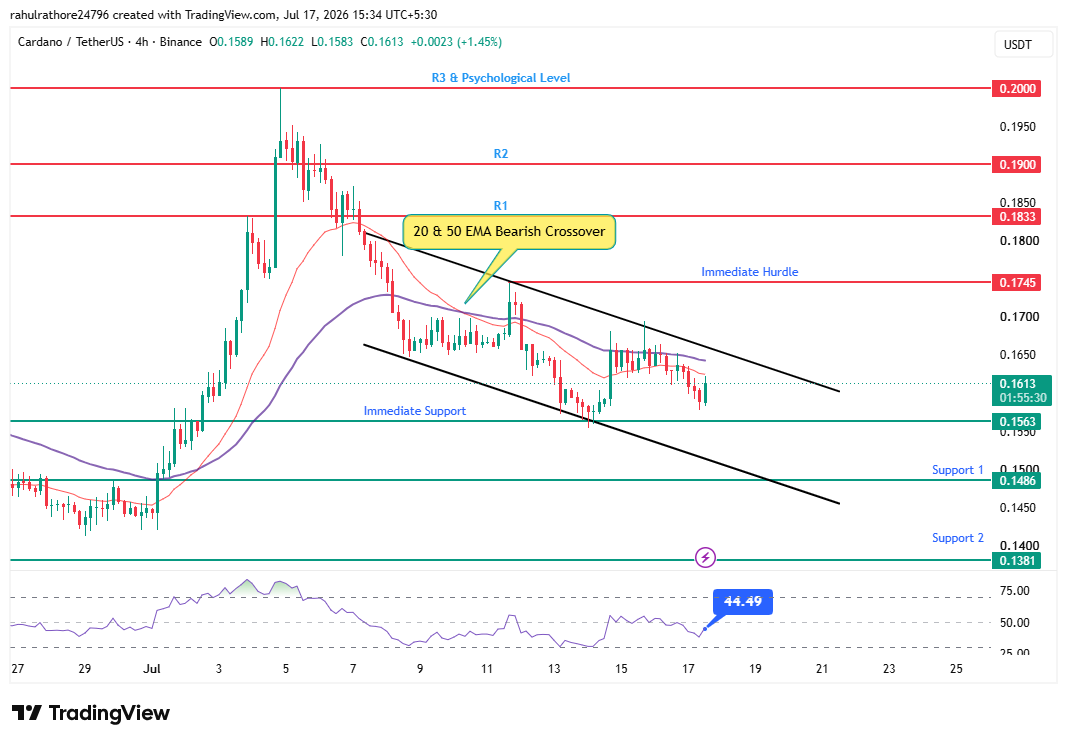
That rally faded almost exactly at $0.20, and the price reversed hard from there.
Since that reversal, it has been trading inside a falling channel, and it has respected both edges of that channel closely rather than breaking out in either direction.
Every attempted bounce so far has run into the descending upper trendline, while the lower trendline has repeatedly caught the dips.
What Does the EMA Crossover Mean for ADA Price Prediction?
Inside that same falling channel, the 20-period and 50-period EMAs completed a bearish crossover, with the shorter average slipping below the longer one.
This is generally read as a short-term bearish signal, and it typically stays valid until a bullish crossover reverses it.
Price has since bounced off the immediate support zone near $0.156 and is currently trading around $0.161, with the Relative Strength Index reading 44.49, a neutral level that does not yet confirm a trend shift in either direction.
What Are the Short-Term Support and Resistance Levels for ADA?
Based on the falling channel structure and the levels marked on the 4-hour chart, this analysis outlines two possible short-term paths:
A close above the falling channel's upper trendline with strength would be the first sign that the bearish EMA crossover is losing control.
A close below $0.1563 would instead point back toward the $0.1486 and $0.1381 zones, both of which acted as demand areas earlier in this structure.
What Are the Long-Term Price Targets If ADA Breaks Key Levels?
Beyond the short-term channel, this Cardano price forecast also maps out where price could travel if either boundary gives way decisively, using Fibonacci extension levels:
-
Downside target: A confirmed break below the $0.1381 support, which sits near the prior structural low, could open a path toward the $0.10 psychological support, based on the 1.618 Fibonacci extension level
-
Upside target: A confirmed break above the $0.20 psychological resistance could extend the move toward $0.2389, also based on the 1.618 Fibonacci extension level
Both scenarios are conditional on a decisive close beyond their respective trigger levels, not just an intraday wick, and neither should be treated as a guaranteed outcome for this Cardano price outlook.
What Are the Bull and Bear Case Levels for This Cardano Price Prediction?
Expert Opinion
CoinGabbar market analysts tracking Cardano's chart structure note that a falling channel paired with a bearish EMA crossover typically favors continued downside pressure until a clear bullish crossover forms.
The neutral RSI reading suggests it is not yet oversold enough to force a mechanical bounce, which means the $0.1563 to $0.1486 zone carries real weight for traders watching this setup.
Analysts add that a sustained break of the channel's upper boundary, not just a single green candle, would be needed before the broader short-term outlook can be called bullish again.
Disclaimer: This Cardano price prediction is based on technical chart analysis and market data available as of July 17, 2026. It is not financial advice. Cryptocurrency markets, including this one, are highly volatile, and prices can move sharply in either direction. Readers should conduct their own research and consult a qualified financial advisor before making investment decisions.
0
0


 Gestisci cripto, NFT e DeFi in un unico luogo
Connetti in sicurezza il portafoglio che usi per iniziare.

0
0


0
0
