
Chainlink Price Prediction: Can LINK Reach $16.78?

0
0

This Chainlink price prediction comes at a moment LINK has been building toward for months.
After a long stretch of grinding sideways below a stubborn ceiling, LINK has broken clean through it, and the strength behind the move has traders paying close attention again.
This breakdown looks at what that move means and what could come next.
The levels below come from a daily chart and reflect a short-to-medium-term technical view, not a guaranteed outcome.
LINK Price Right Now
Metric | Value |
CMP (Current Market Price) | $10.450 |
24-Hour Change | +8.89% |
Market Cap | $7.82 billion |
Futures Volume (24h) | $1.13 billion |
Spot Volume (24h) | $175.11 million |
Open Interest | $697.27 million |
Circulating Supply | 748.09 million LINK |
Total Supply | 1.00 billion LINK |
Max Supply | 1.00 billion LINK |
Two calculated figures stand out here, both derived from the CoinGlass numbers above rather than pulled directly from any single source.
Futures volume of $1.13 billion against spot volume of $175.11 million works out to roughly 6.4 times more futures activity than spot activity, meaning leveraged traders are driving most of today's price action.
Open interest of $697.27 million against a $7.82 billion market cap puts leverage exposure at close to 8.9% of market cap, a moderate reading rather than an extreme one.
With 748.09 million LINK circulating out of a 1 billion max supply, roughly 251.91 million LINK, about 25% of the eventual max supply, remains outside current circulation.
No fresh unlock schedule was provided alongside this data, so this is noted as context rather than an active near-term catalyst.
Source: CoinGlass live market data, August 20, 2026. Chart source: TradingView, LINK/USDT Perpetual, Bybit, daily timeframe.
Methodology and Data Sources for This Chainlink Technical Analysis
This Chainlink price prediction is built on the daily LINKUSDT Perpetual chart on Bybit, viewed through TradingView.
Target and support levels are pulled directly from marked levels on that same chart rather than picked arbitrarily.
The chart's built-in RSI panel is currently reading 77.85, still extending the bullish signal that printed back in July, which points to strong but not yet extreme momentum on the daily timeframe.
Liquidation data, ETF flow data, and holder concentration data come from CoinGlass, each cited with its own date below.
Chainlink Ecosystem Update: Nethermind Joins the Network
Fresh Chainlink news adds weight to this move.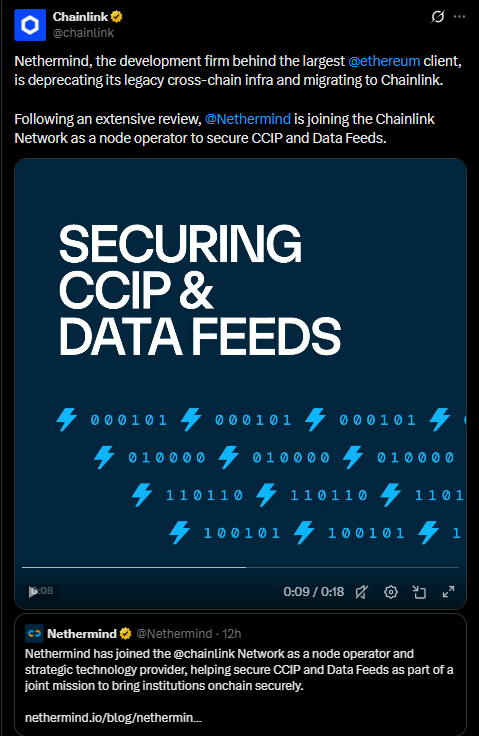
Nethermind, the development firm behind the largest Ethereum client, announced it is deprecating its own legacy cross-chain infrastructure and migrating to Chainlink, joining the network as a node operator to help secure CCIP and Data Feeds.
A firm of Nethermind's size adopting Chainlink's infrastructure rather than continuing to run its own is a notable vote of confidence in the network, even if it is not the direct cause of today's price move.
Source: Chainlink (@chainlink) and Nethermind (@Nethermind) on X, dated within the past 12 hours as of this writing.
LINK Spot ETF Flow Data
LINK spot ETF products have now logged four straight sessions of positive net inflows through August 19, with cumulative net inflows climbing from $129.36 million to $133.92 million over that stretch.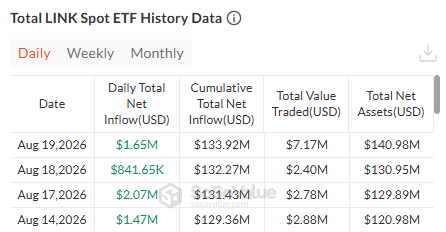
Steady inflows like this do not move price by themselves, but they add a second source of demand alongside spot and futures buyers, which fits the broader strength on the chart.
Source: SoSoValue Spot ETF data, dated August 14 through August 19, 2026.
LINK Liquidation Data Today
The picture here shifts depending on the window.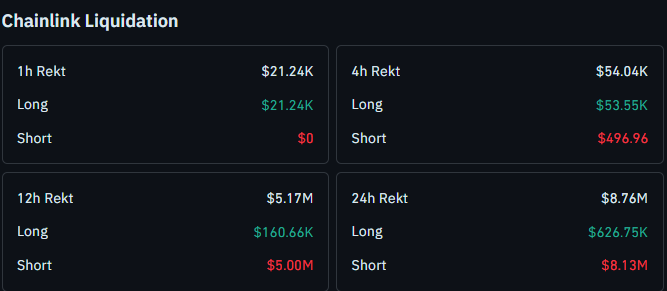
Over the last hour and 4 hours, long-side liquidations clearly outweighed short-side liquidations, meaning some long traders got caught out on short-term pullbacks even as the broader trend stayed up.
Zoom out to the 12-hour and 24-hour windows, though, and short-side liquidations dominate heavily, at $5.00 million and $8.13 million, respectively.
That pattern lines up with the breakout itself: the bulk of today's rally likely forced short sellers to cover as price pushed higher, while the most recent hours show normal profit-taking and stop-outs on the long side during consolidation.
Source: CoinGlass liquidation data, August 20, 2026.
LINK Whale and Holder Concentration
On-chain data adds more context to this Chainlink technical analysis.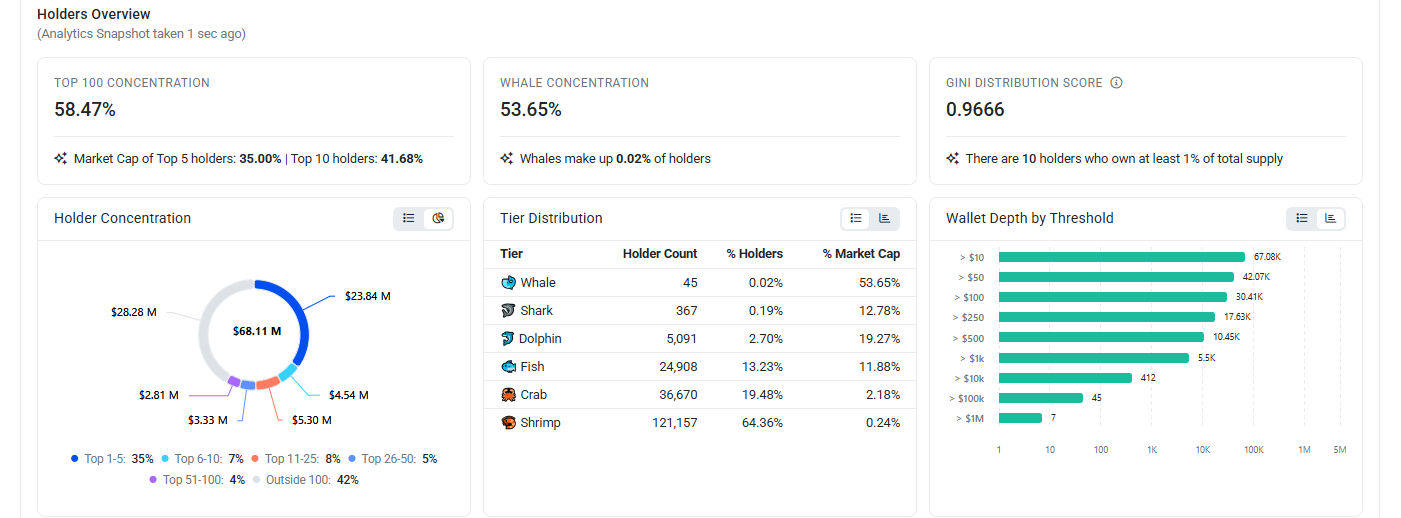
The top 100 wallets hold 58.47% of supply, whale addresses (0.02% of all holders) control 53.65% of market cap, and the Gini distribution score sits at 0.9666, with 10 holders currently owning at least 1% of total supply each.
The top 5 wallets alone account for 35.00% of market cap, and the top 10 account for 41.68%.
Breaking this down by tier, whale wallets (45 addresses) hold 53.65% of market cap, shark wallets (367 addresses) hold 12.78%, and dolphin wallets (5,091 addresses) hold 19.27%.
No exchange or protocol labels were available for this batch of holder data, so this should be read as raw concentration rather than a breakdown between exchange custody and individual holders.
Source: BscScan Holders Overview, August 20, 2026.
Quick Answer: Key Levels at a Glance
CMP: $10.450, Bybit LINK/USDT Perpetual, daily chart
LINK has already rallied close to 33% off its recent low after clearing a long-term descending trendline
Bullish continuation trigger: sustained daily close above $11.635, opening the door to $14.396 and $14.992
Major resistance: $16.781
Bearish invalidation: daily close below $10.071, opening room toward $9.220
Data captured: August 20, 2026
Chainlink Price Prediction: Daily Chart Analysis
LINK has broken decisively above a descending trendline that had capped price since earlier this year, and the daily chart shows a rally of close to 33% off the recent low that preceded the break.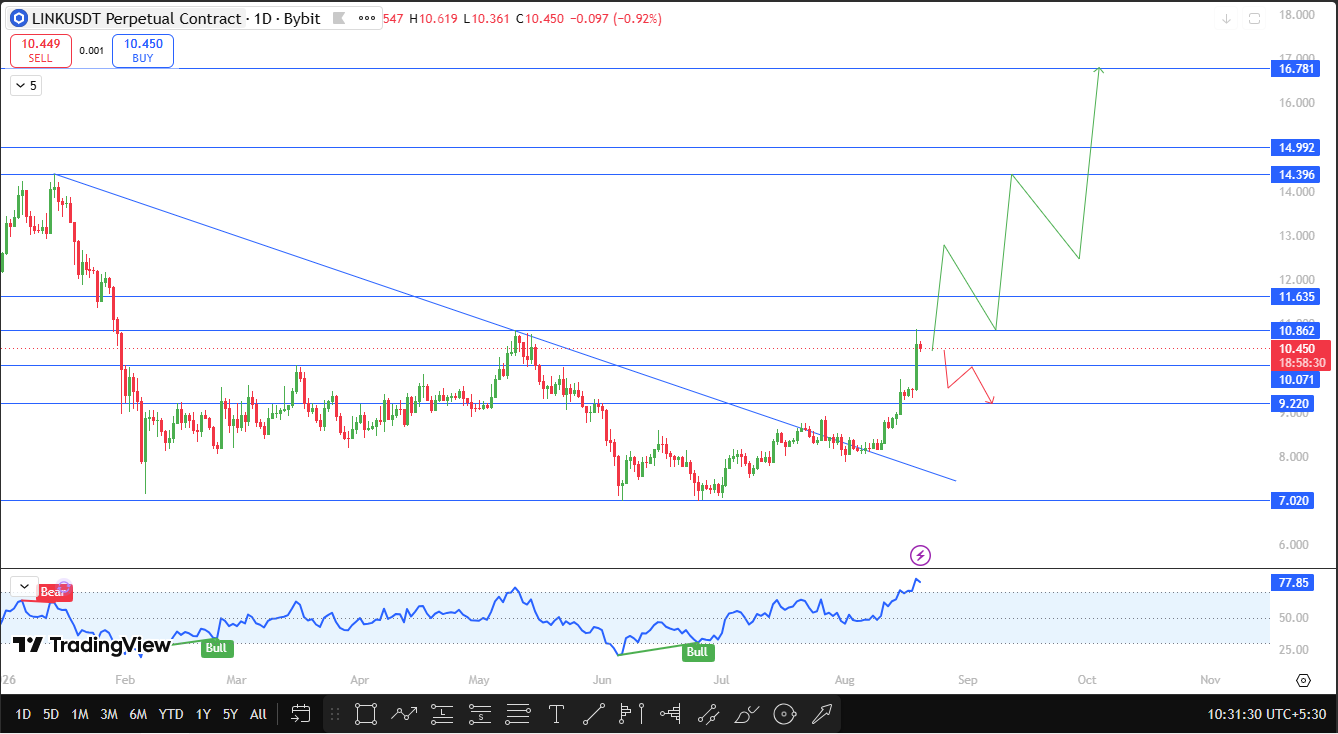
This kind of move, a clean trendline breakout followed by a sharp expansion, often reflects a genuine shift in trend rather than a short-lived spike, though confirmation on further closes still matters.
If LINK sustains here and pushes through $11.635, the next levels to watch are $14.396 and $14.992, with $16.781 standing out as the major resistance on the chart.
A daily close and hold above $11.635 would confirm that this breakout has real follow-through rather than stalling just above the old trendline.
If the price instead fails to hold and closes below $10.071 on the daily chart, that would call the breakout into question, with $9.220 as the next support level to watch on a deeper pullback.
LINK Technical Outlook Snapshot
Indicator | Signal |
Chart Pattern | Descending trendline breakout, daily timeframe |
RSI (TradingView, daily) | 77.85, extending prior bullish signal |
Recent Performance | ~33% rally off pre-breakout low |
Near-Term Bias | Bullish above $10.071 |
LINK Support and Resistance Levels to Watch
Level Type | Price | % From CMP | Note |
Major Resistance | $16.781 | +60.58% | Extended chart target |
Resistance 3 | $14.992 | +43.46% | Marked swing level |
Resistance 2 | $14.396 | +37.76% | Marked swing level |
Resistance 1 (trigger) | $11.635 | +11.34% | Breakout continuation level |
Current Price | $10.450 | 0% | Live CMP, Bybit perpetual, daily chart |
Support 1 (trigger) | $10.071 | -3.63% | Breakout invalidation level |
Support 2 | $9.220 | -11.77% | Next marked support |
LINK Risk-Reward Table
Case | Trigger | Target |
Bull Case | Sustained daily close above $11.635 | $14.396, then $14.992, then $16.781 |
Bear Case | Sustained daily close below $10.071 | $9.220 |
Setup invalidation | Daily close back below $10.071 | Breakout structure invalidated |
Invalidation Level
Here's what breaks this setup: LINK is closing below $10.071 on the daily chart and staying there.
Once that happens, the trendline breakout starts looking more like exhaustion than genuine strength, and the focus shifts back down to $9.220, where buyers could realistically step back in.
CoinGabbar's Technical Analyst View
Bull Case: If LINK manages a sustained daily close above $11.635, that's confirmation the breakout has real legs, not just a one-day spike. From there, $14.396 and $14.992 come into play, and the backdrop helps too; ETF inflows have stayed positive, and the Nethermind news gives the network story some extra weight right now.
Base Case: Don't rule out some sideways chop here. LINK could easily spend time between $10.071 and $11.635 while the market works through this recent 33% run before deciding on the next move.
Bear Case: Things turn less favorable if LINK closes below $10.071. That would unwind the breakout structure and put $9.220 back in focus, especially if the short-covering that fueled part of this rally starts fading and longs begin getting liquidated instead.
Glossary
CMP: Current Market Price, the live traded price at the time of analysis
Open Interest: The total value of outstanding, not yet settled derivative contracts for an asset
Liquidation: The forced closure of a leveraged trading position when losses exceed the margin held.
Perpetual Futures (Perps): A futures contract with no expiry date, commonly used for leveraged crypto trading.
Descending Trendline: A downward-sloping line connecting successive lower highs, acting as resistance until broken
Disclaimer
This article is for informational purposes only and should not be treated as financial advice. Cryptocurrency markets are highly volatile, and readers should do their own research before making any investment decisions. CoinGabbar and the analyst do not hold a position in LINK at the time of publication.
0
0

 Gérez tous vos cryptos, NFT et DeFi à partir d'un seul endroit.
Connectez de manière sécurisée le portefeuille que vous utilisez pour commencer.

0
0

0
0

0
0
