Why Is The Crypto Market Down Today?

0
0

The crypto market slipped 0.69% on April 1, shedding $5.39 billion as the total market cap dropped to $2.31 trillion while energy costs from the Strait of Hormuz crisis continued to weigh on risk appetite.
Bitcoin fell 0.89% to $67,590, underperforming the broader market while holding 56.6% dominance. Hyperliquid (HYPE), the top-20 perpetual futures Layer 1, dropped 3.3% on the day and 10% over the past seven days as a bearish divergence threatened its bullish structure.
In the news today:-
- Caltech researchers showed a fault-tolerant quantum computer could run Shor’s algorithm with just 10,000 qubits, down from previous estimates of one million, compressing the timeline for when quantum machines could threaten blockchain cryptography. Google Quantum AI separately mapped 6.7 million BTC sitting in addresses vulnerable to quantum attacks.
- The US Department of Justice charged 10 foreign nationals from four crypto firms with orchestrating fraud schemes to artificially inflate trading volume and prices. Three defendants, including two CEOs, were arrested and extradited from Singapore.
- President Trump said the US could leave Iran within two to three weeks after achieving its nuclear objective, but the Strait of Hormuz remains largely shut with Brent crude above $118 per barrel. Trump will address the nation Wednesday, days before his April 6 deadline for Iran to reopen the strait.
Hormuz Oil Shock Keeps Crypto Market Cap Under Pressure
The total crypto market cap traded at $2.31 trillion on April 1, down 0.69% from yesterday’s close. The decline extended a range-bound pattern that has persisted since late March, as the Strait of Hormuz closure continued to inflate energy costs and suppress risk appetite across asset classes. Brent crude above $118 per barrel has pushed gasoline past $4 per gallon nationally, creating inflationary drag that discourages capital rotation into speculative assets like crypto.
With Trump’s April 6 Hormuz deadline approaching and no credible reopening plan in place, the uncertainty is keeping the total market cap pinned below the $2.35 trillion resistance level. A recovery above $2.35 trillion would signal the first meaningful break from this range. Beyond that, $2.55 trillion remains the level above which the structure turns bullish.
Want more token insights like this? Sign up for Editor Harsh Notariya’s Daily Crypto Newsletter here.
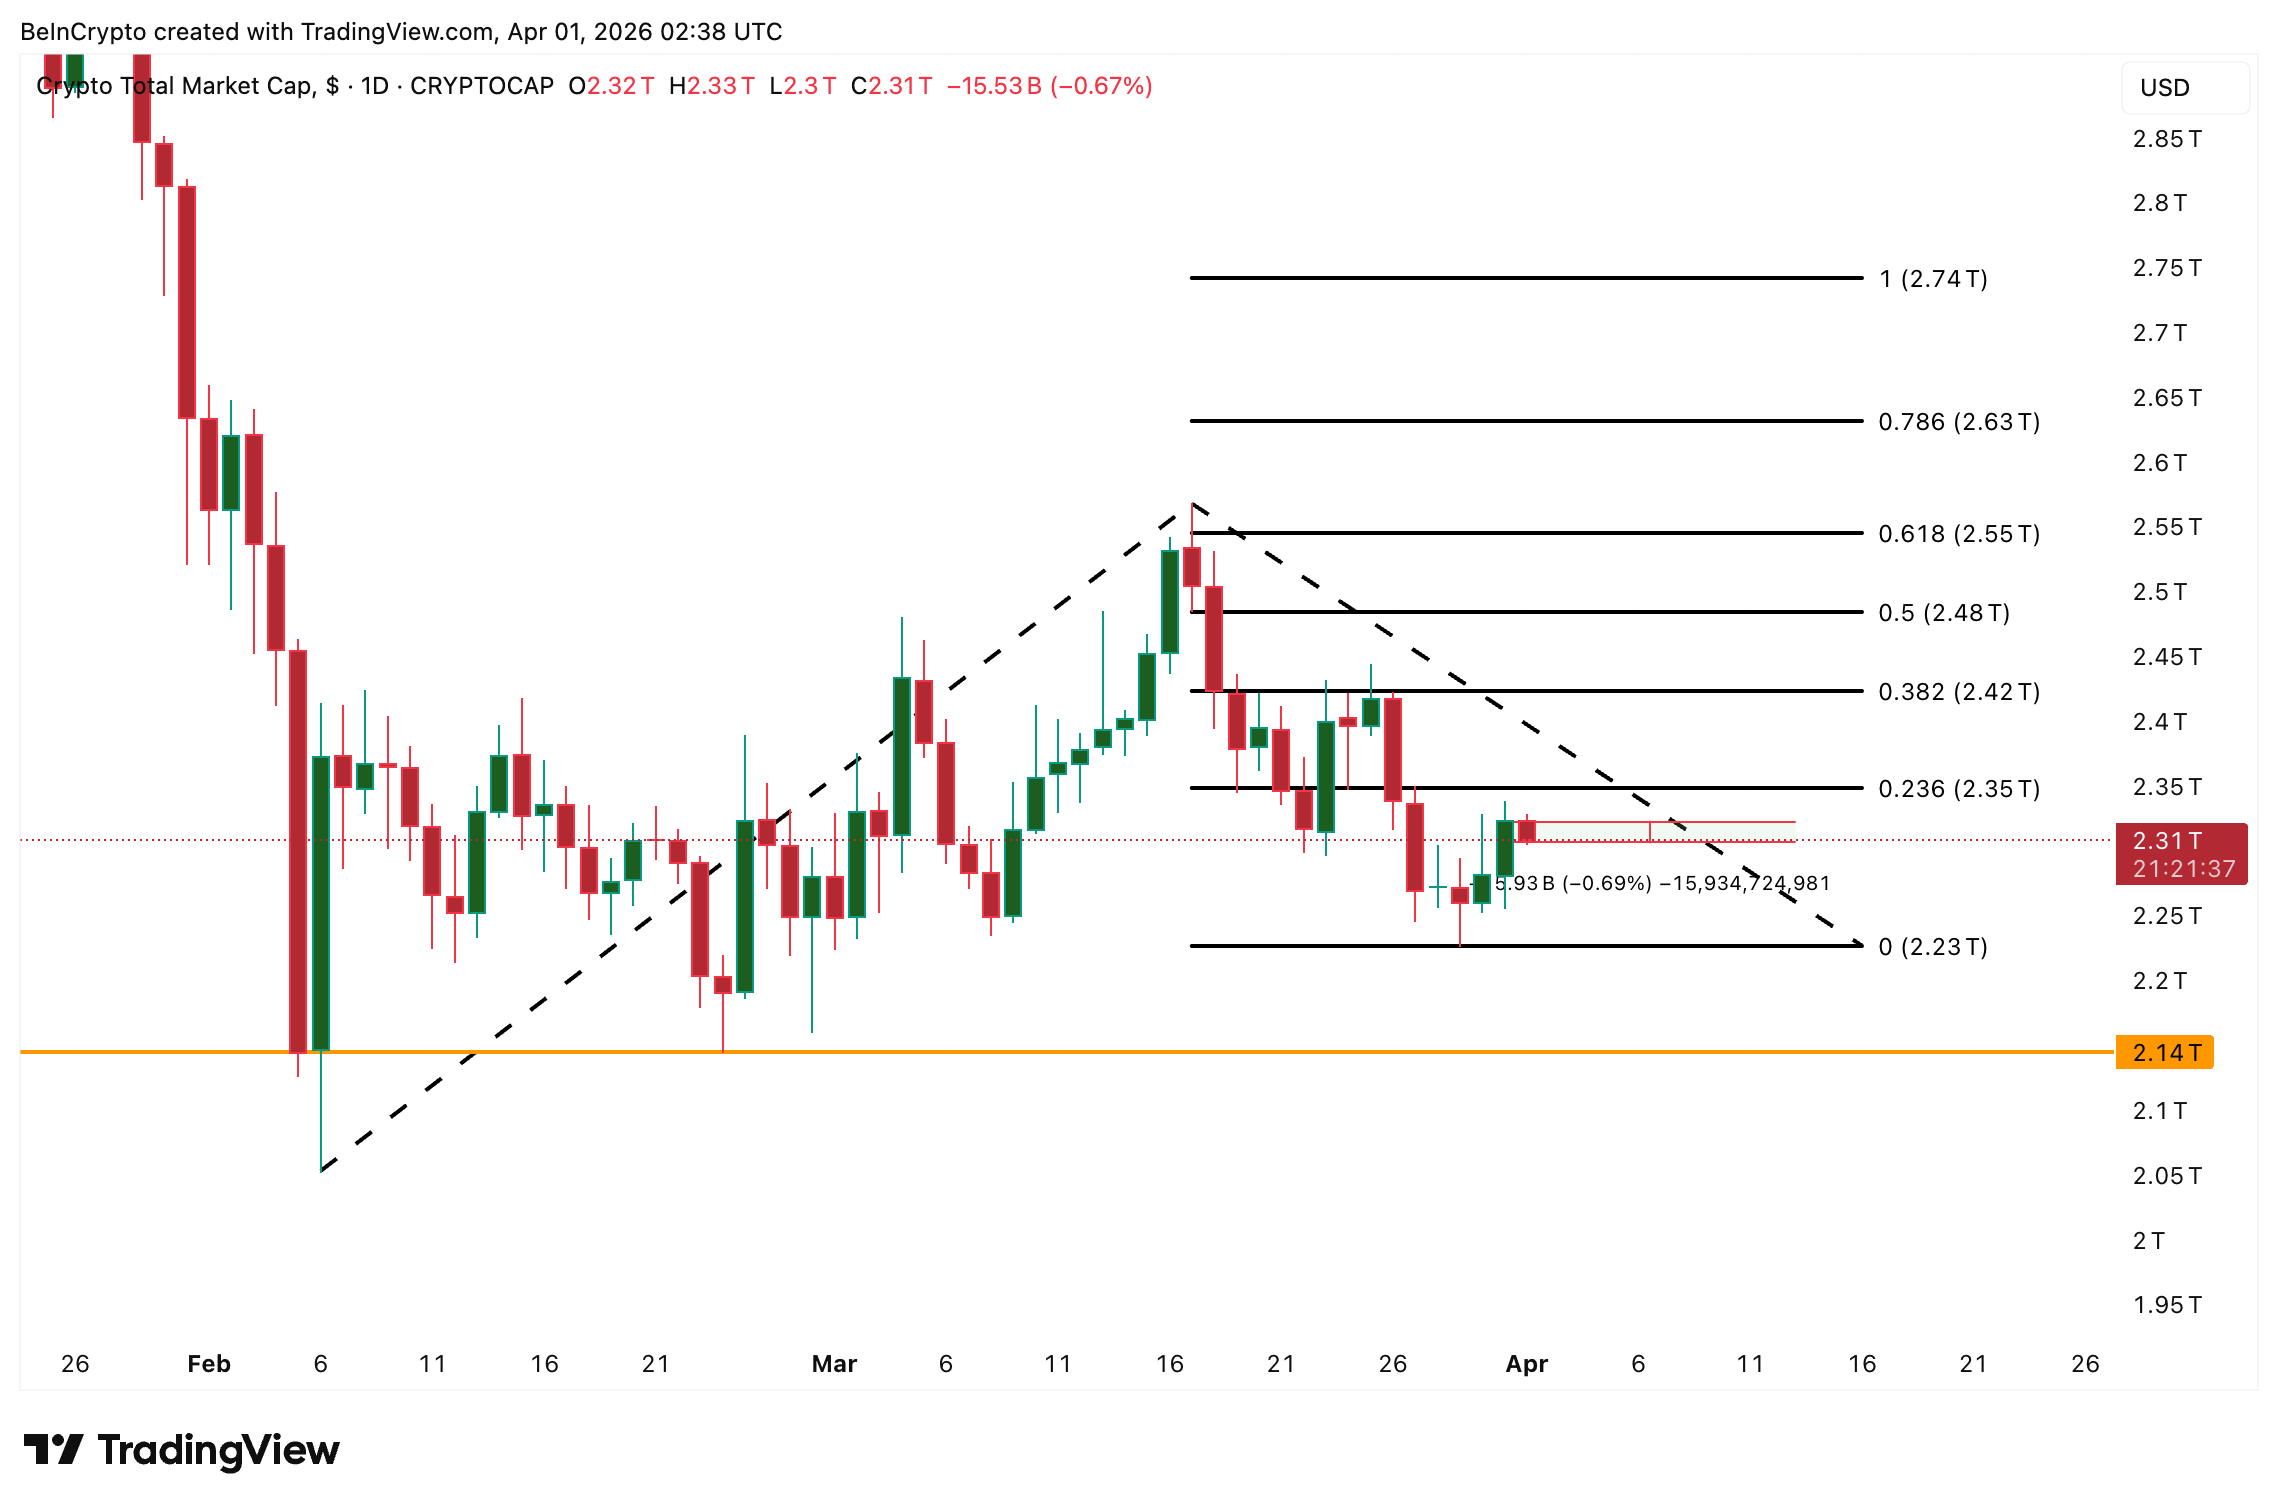 TOTAL Crypto Market Cap Analysis: TradingView
However, $2.23 trillion has acted as a floor through this correction. A daily close below it would expose $2.14 trillion and signal that the contained correction has given way to a deeper sell-off.
Bitcoin’s Institutional Flow Weakness Drags the Broader Market
Bitcoin traded near $67,590, down 0.89% and underperforming the broader crypto market. At 56.6% dominance, BTC’s directional bias carries outsized weight on the total market cap. The current weakness is doing more to anchor the correction than any single altcoin move.
The Chaikin Money Flow indicator, a proxy for institutional flows, sat at -0.04 on the daily chart. The reading has failed to reclaim the zero line, suggesting that institutional capital is flowing out rather than in. This weakness aligns with the broader energy-driven risk-off environment. This means rising oil costs are possibly forcing portfolio managers to reduce exposure to volatile assets.
As for Bitcoin’s price structure, the $66,160 level is the most immediate support. A break below it could trigger a deeper correction toward $63,470 and potentially the $60,000 zone ($60,050 to be exact).
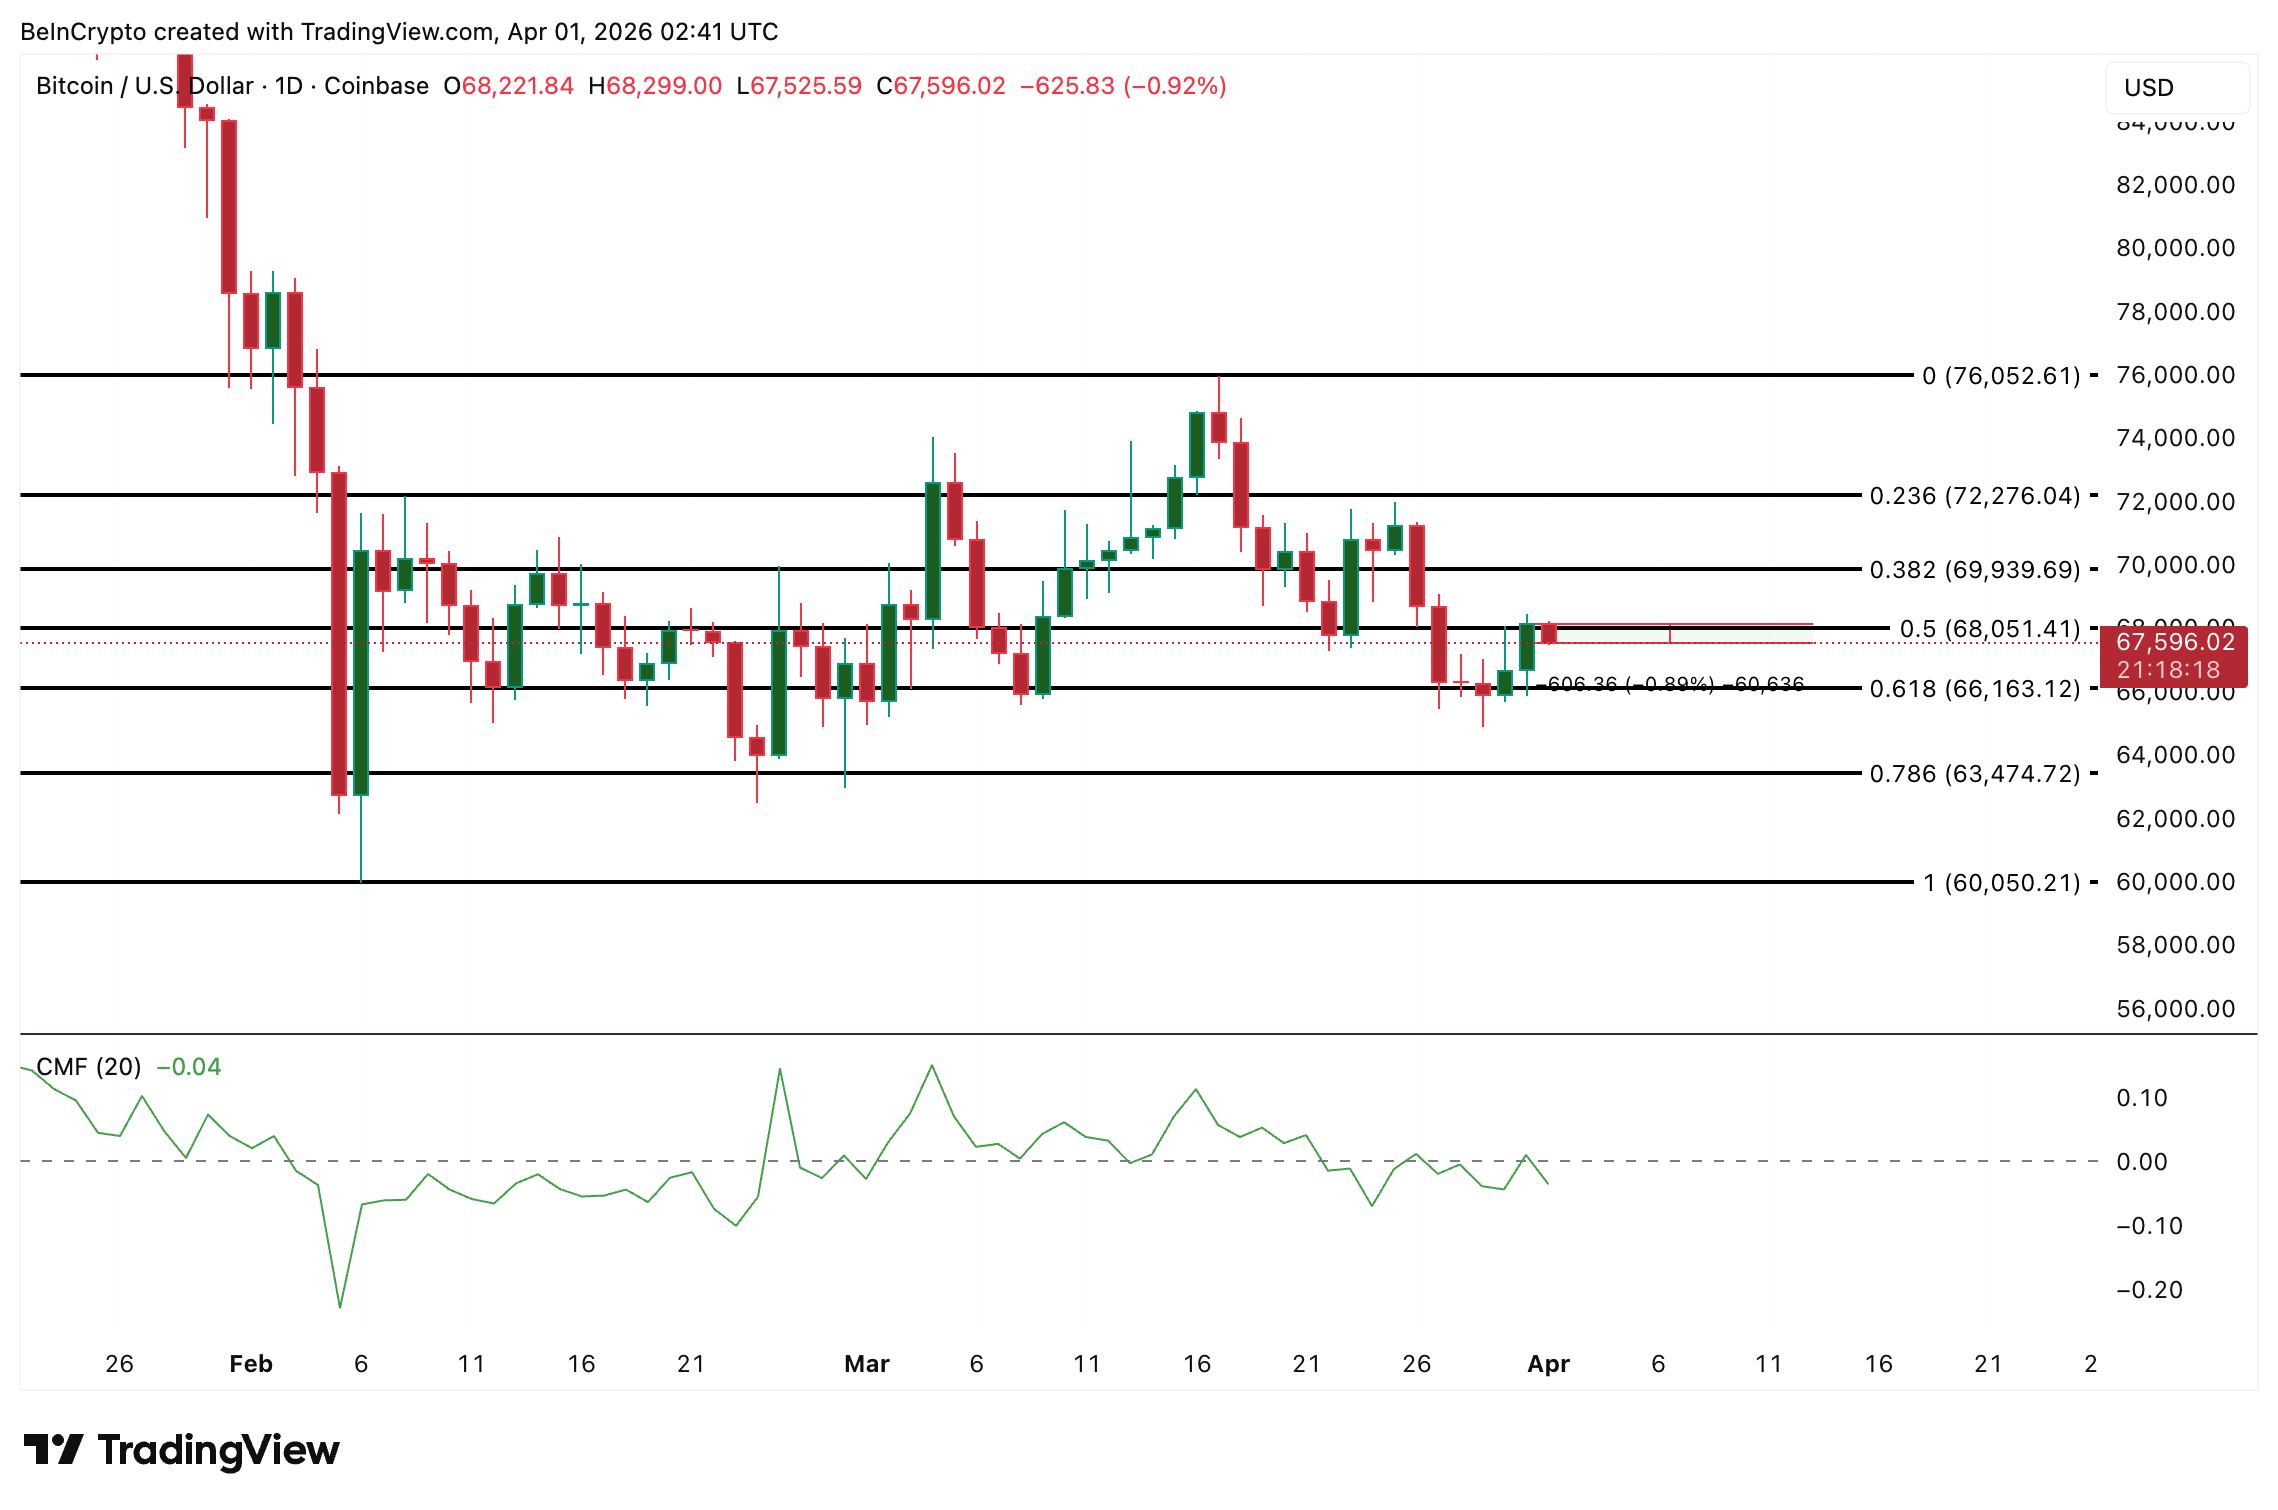 Bitcoin Price Analysis: TradingView
On the upside, a swift reclaim of $68,050 would be the first sign that buyers are stepping back in. A daily close above $68,050 targets $69,930. A close below $66,160 exposes $63,470 and $60,050.
Hyperliquid (HYPE) Bearish Divergence Puts Bullish Channel at Risk
Hyperliquid traded at $36.23, down 3.3% on the day and 10% over the past seven days. However it still carries a 12% gain on the monthly timeframe. The broader market’s energy-driven weakness amplified selling pressure on HYPE, which as a high-beta perpetual futures infrastructure token is more sensitive to shifts in risk appetite than defensive large-caps.
The 12-hour chart shows HYPE closing in on the lower trendline of a bullish channel that has defined its uptrend since late February. More concerning, the Relative Strength Index (RSI), a momentum oscillator, has printed a bearish divergence. Between March 2 and March 31, price made a higher high while RSI made a lower high. It is a standard signal that upward momentum is fading even as price grinds higher.
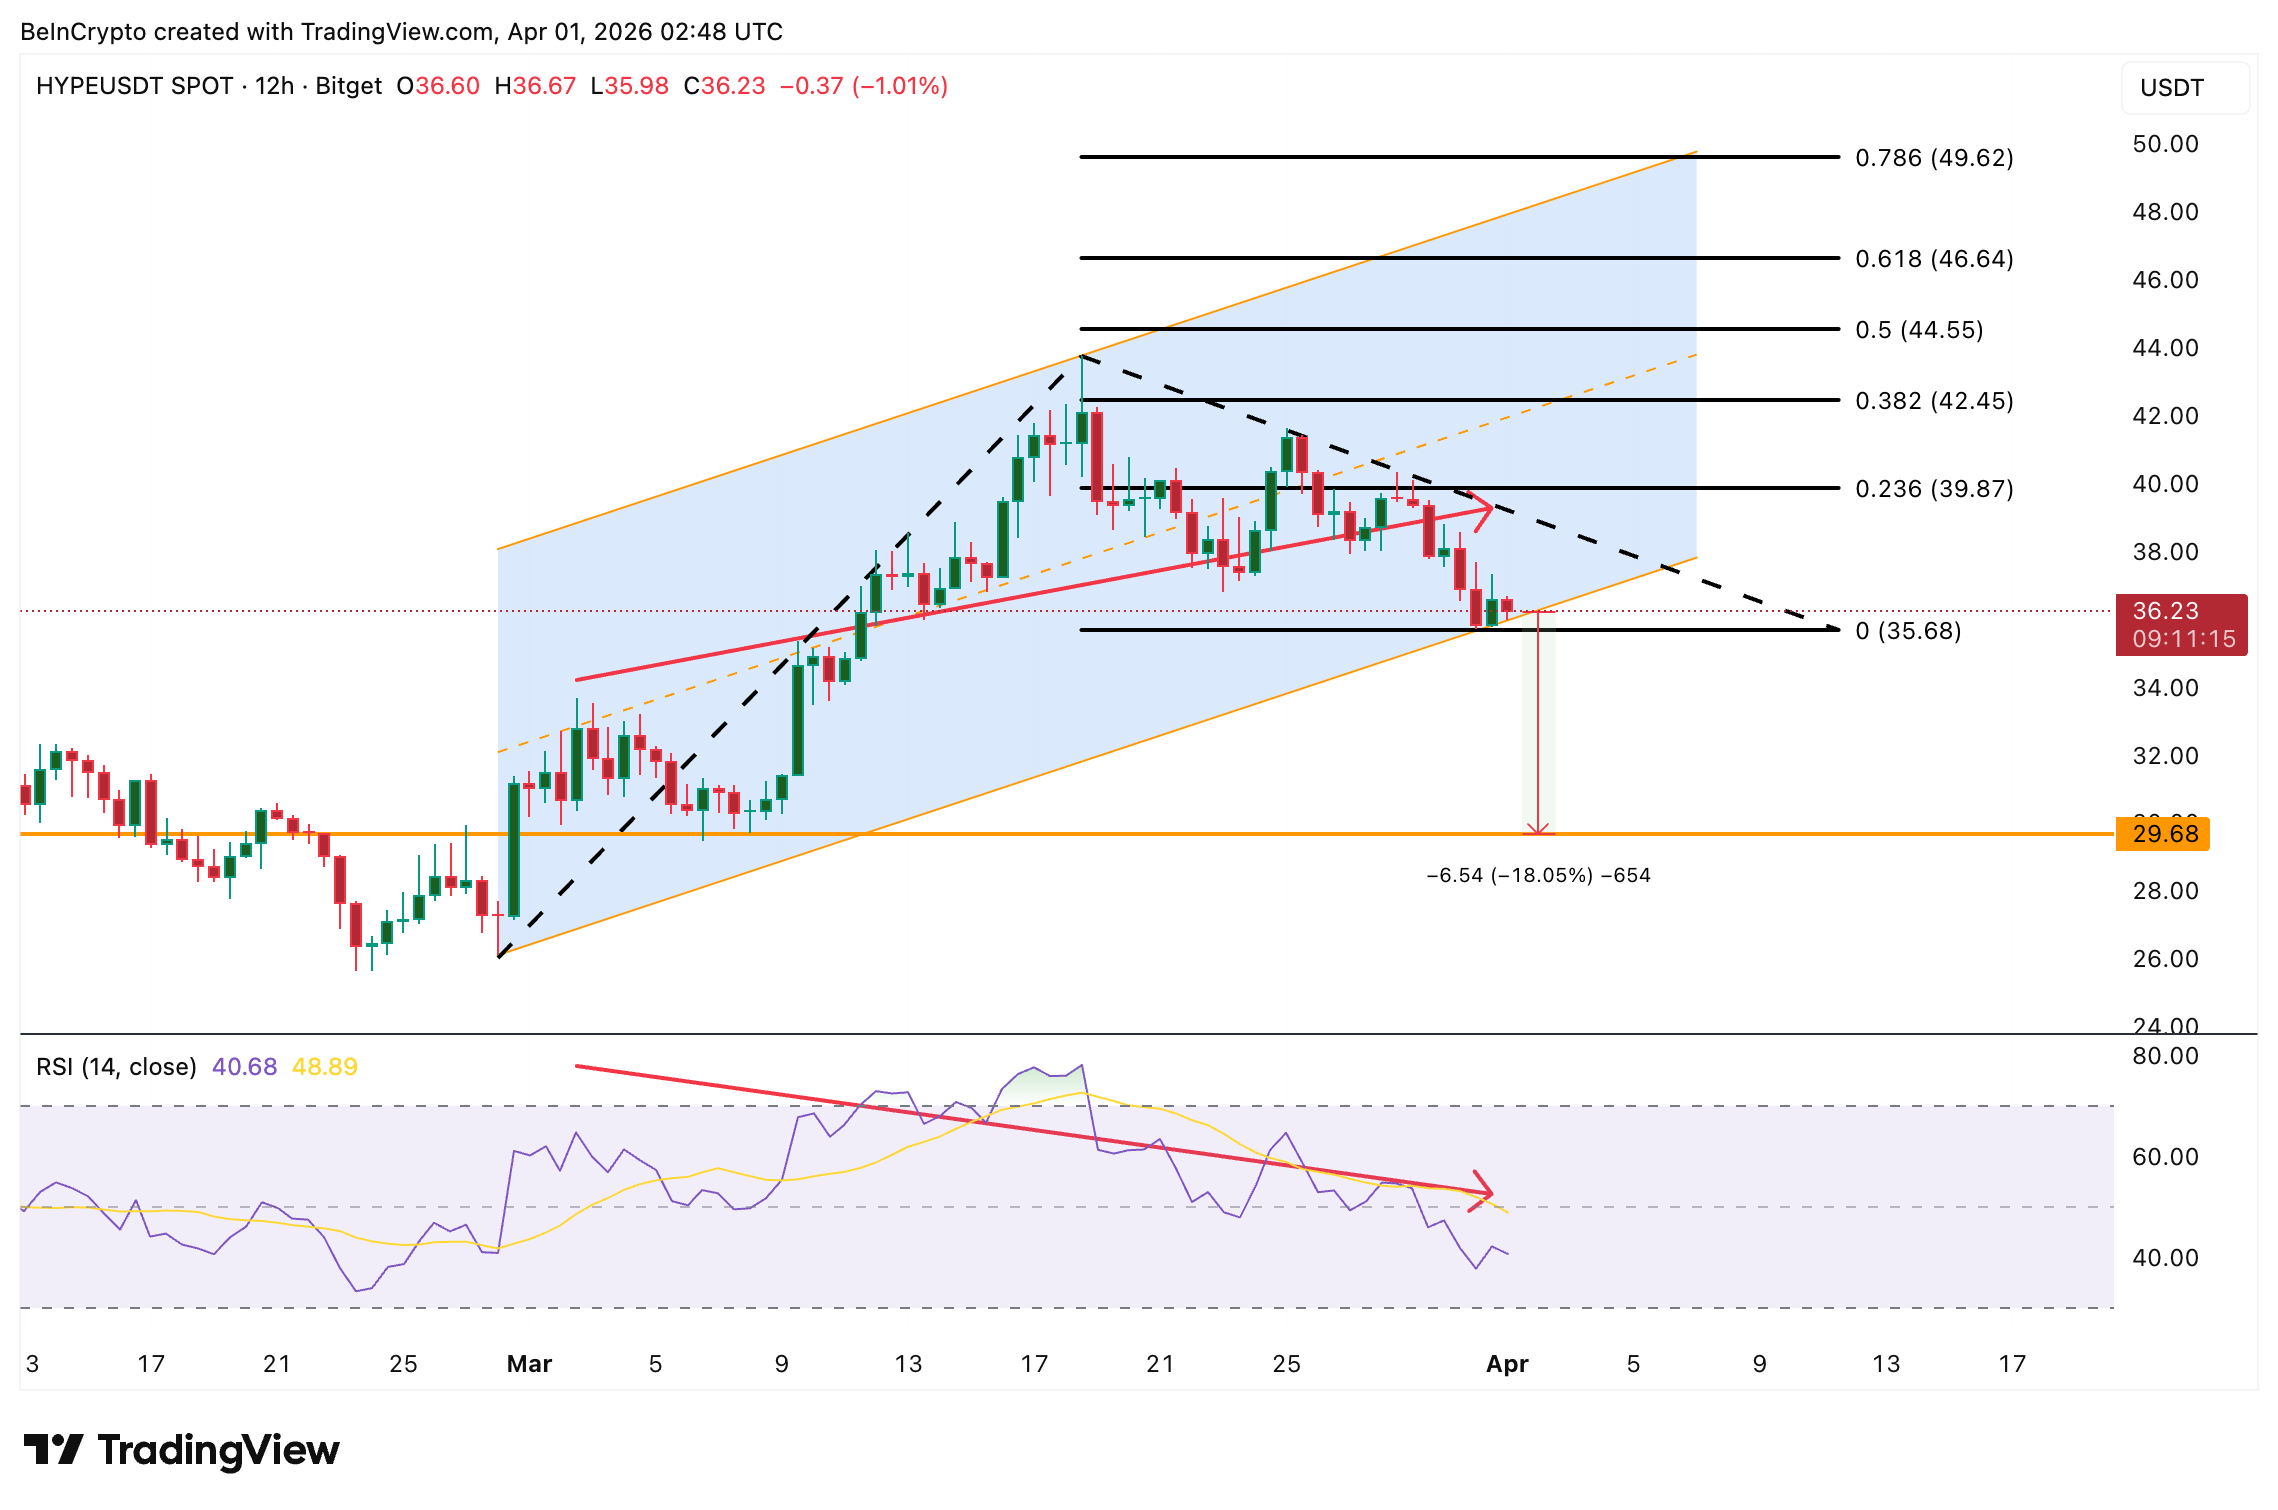 HYPE Price Analysis: TradingView
That divergence puts additional stress on the lower trendline. If HYPE drops below $35.68, the structure shifts from bullish to neutral/bearish, putting even the $29.68 level at risk. A reclaim of $39.87 would relieve the pressure, while sustained strength above $46.64 would restore the bullish case. At present, $35.68 separates a continuation of the bullish channel from a structural breakdown toward $29.68.
0
0


 Gérez tous vos cryptos, NFT et DeFi à partir d'un seul endroit.
Connectez de manière sécurisée le portefeuille que vous utilisez pour commencer.

0
0


0
0