Why Is The Crypto Market Down Today?

0
0

The crypto market (TOTAL) trades at $2.33 trillion on April 7, down 0.11% from the previous close but masking a sharper 2.62% intraday swing from yesterday’s high.
Bitcoin (BTC) slipped to $68,657 while Avalanche (AVAX) emerged as one of the biggest losers among top tokens, falling almost 10% in 24 hours and pushing its 30-day returns into negative territory.
In the news today:-
- The S&P 500 closed Monday with a 0.44% gain while crypto weakened, reinforcing a rotation pattern where equities and digital assets have struggled to rally together in recent weeks. With oil still above $111 following Trump’s Tuesday deadline for Iran to reopen the Strait of Hormuz, risk capital appears to be choosing stocks over crypto on days when sentiment improves.
- BitMine Immersion Technologies announced $11.4 billion in total crypto and cash holdings alongside approval to uplist from NYSE American to the NYSE starting April 9. The company now holds 4.8 million ETH, representing 3.98% of circulating supply. Chairman Tom Lee framed Ethereum as a wartime store of value, noting ETH has outperformed the S&P 500 by 1,130 basis points since the Iran conflict began.
- Trump-linked World Liberty Financial partnered with Aster DEX to integrate USD1 as the settlement asset for TradFi perpetual contracts covering gold, silver, and crude oil. USD1 has surpassed $4.6 billion in market cap and ranks fifth among stablecoin issuers by daily active addresses.
Crypto Market Holds $2.30 Trillion as Rotation Favors Equities
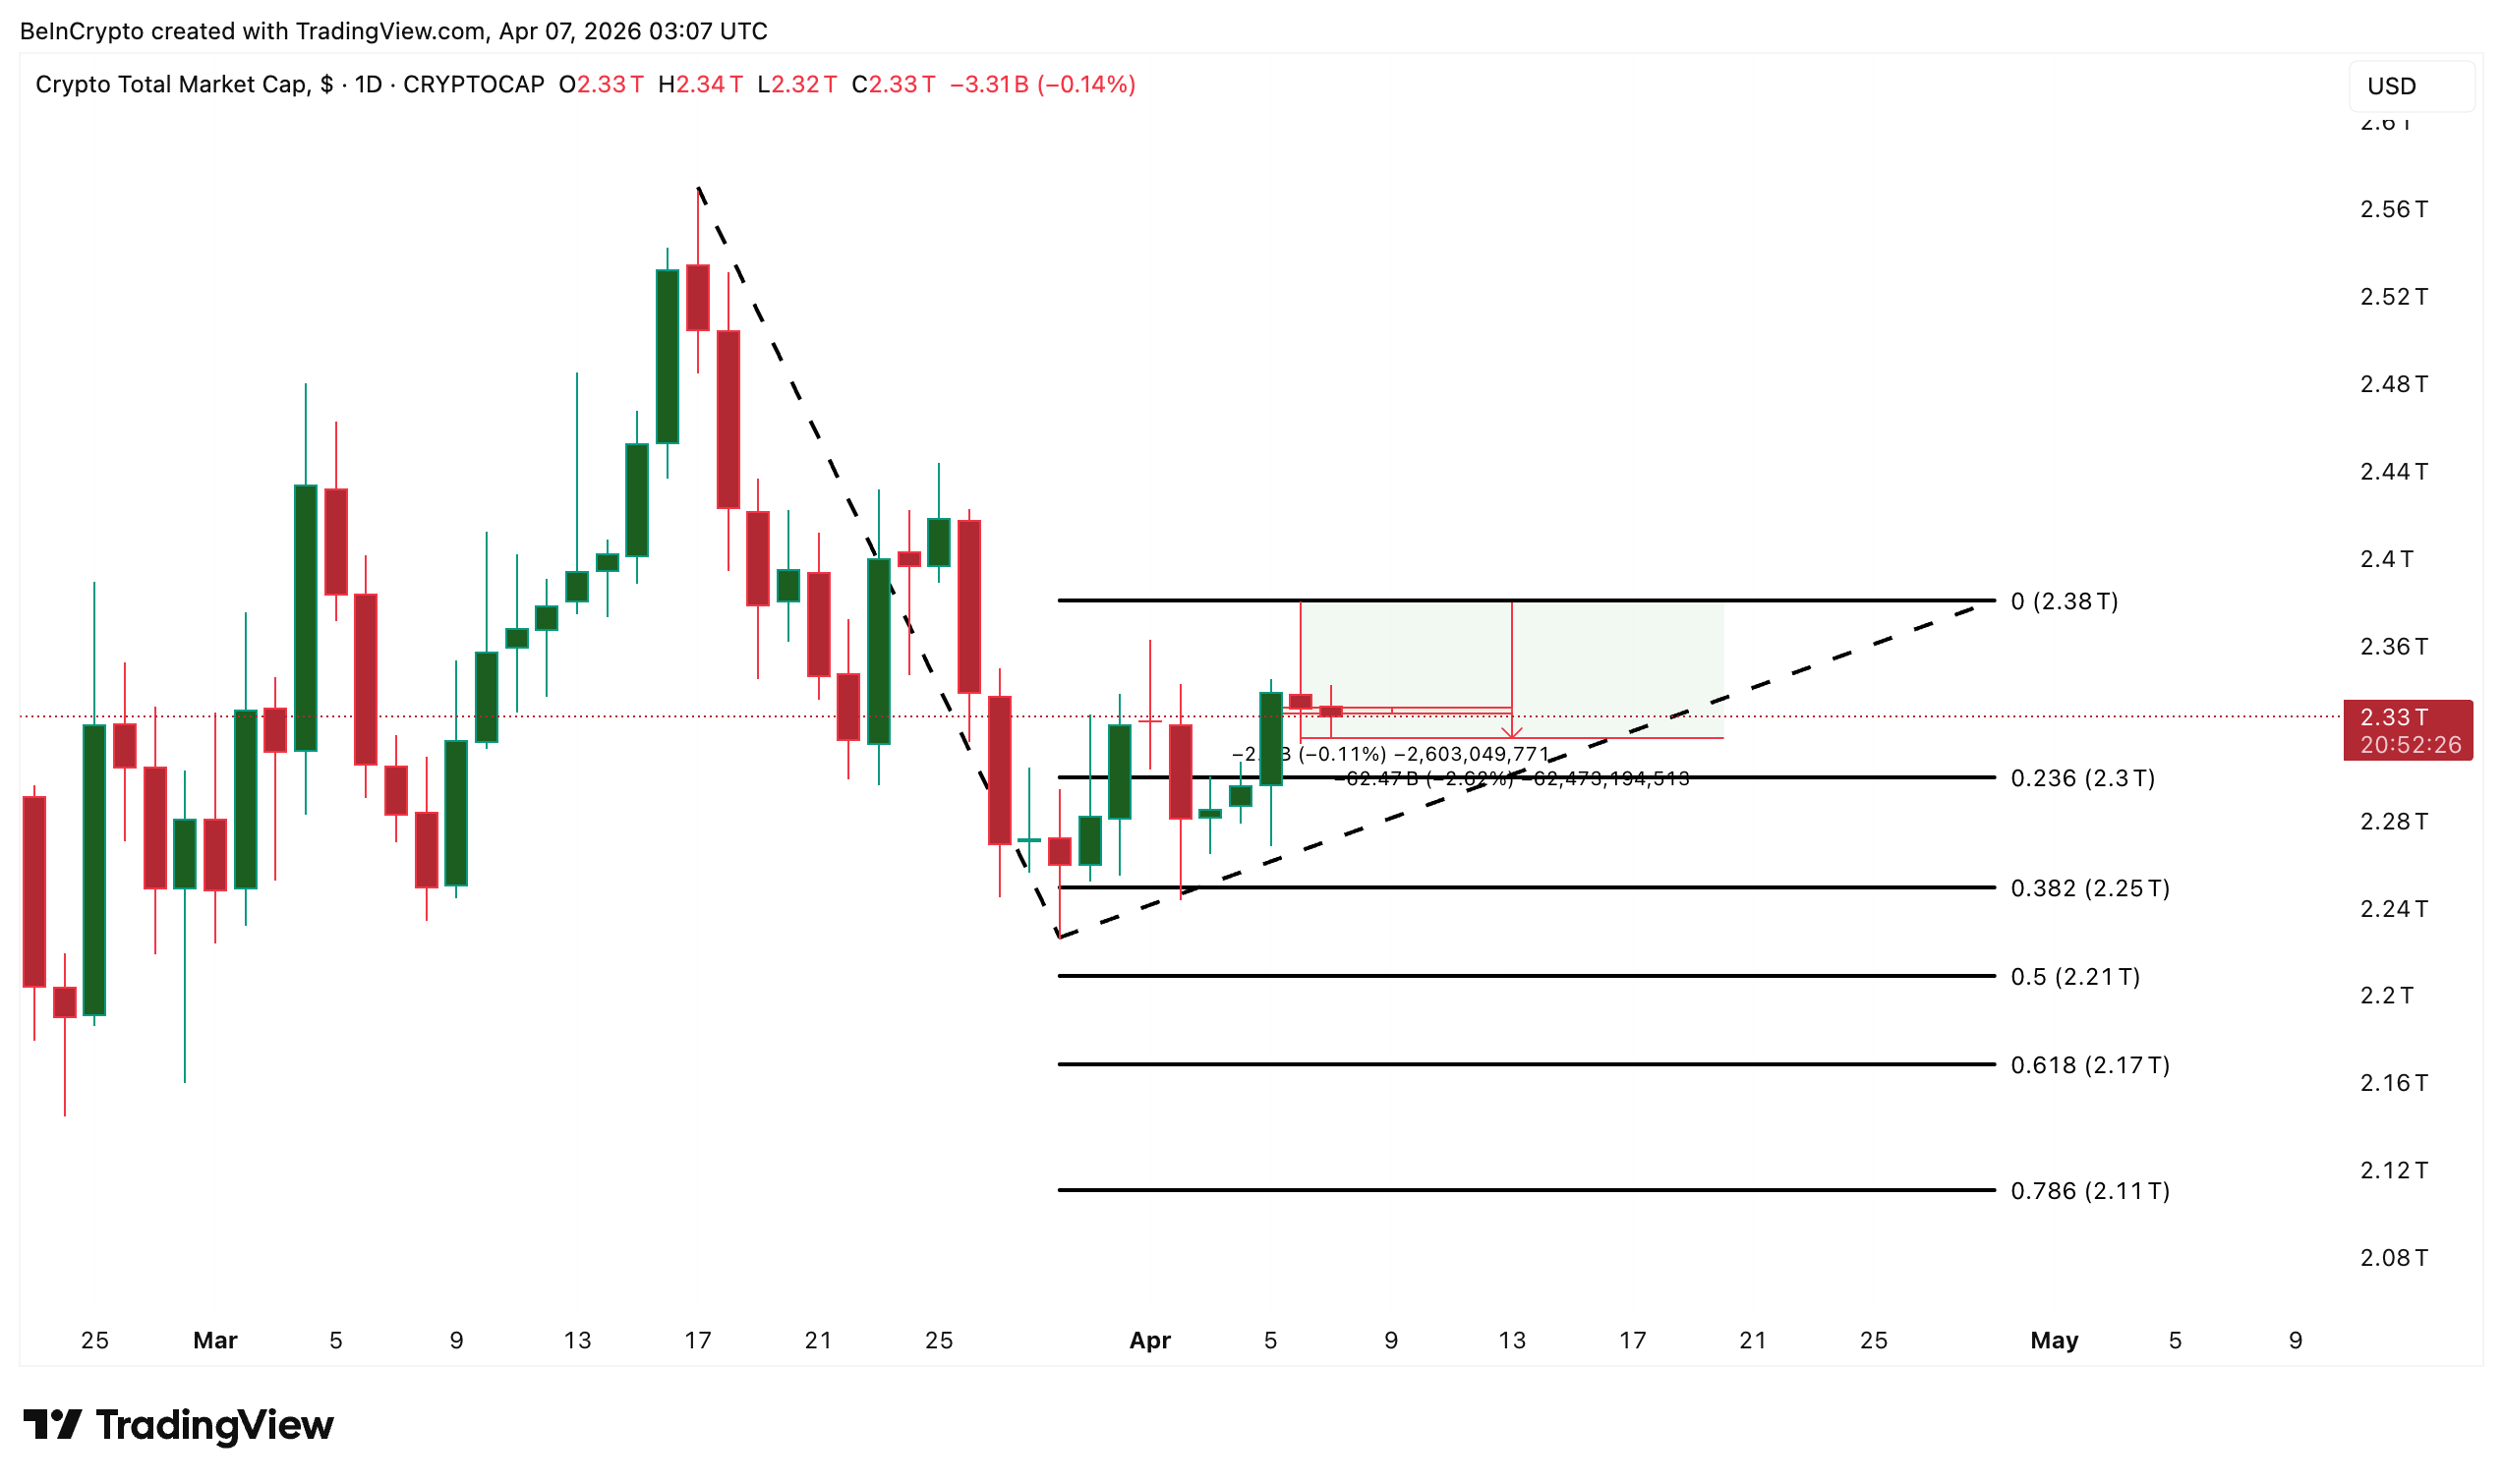
The total crypto market capitalization sits at $2.33 trillion on April 7. The headline decline of 0.11% from the previous close understates the volatility. Since yesterday’s high, the market corrected 2.62% before buyers stepped in, and the last two sessions have been defined by both upper and lower wicks as buyers and sellers defend key levels aggressively.
The rotation angle matters. The S&P 500 closed Monday up 0.44% while crypto pulled back, a pattern that has repeated throughout the Iran conflict. With de-escalation still an uncertain outcome, the equity-to-crypto rotation and vice versa might be in play for a longer duration.
When equities gain, capital has not been flowing into crypto simultaneously. Oil remaining above $111 limits the appetite for risk-on positioning in digital assets, as inflation fears keep the Fed on hold and compress the liquidity available for speculative allocation.
Want more token insights like this? Sign up for Editor Harsh Notariya’s Daily Crypto Newsletter here.
 TOTAL Crypto Market Cap Analysis: TradingView
The $2.38 trillion level from April 6 is the resistance the crypto market needs to reclaim for upside momentum. The $2.30 trillion floor at the 0.236 technical level has held for now. A break below $2.30 trillion opens the path toward $2.25 trillion and $2.17 trillion if the correction deepens.
As long as Bitcoin’s dominance remains elevated and the equity rotation persists, the broader market stays range-bound between these levels.
Bitcoin’s Head and Shoulders Keeps the $55,000 Target Alive
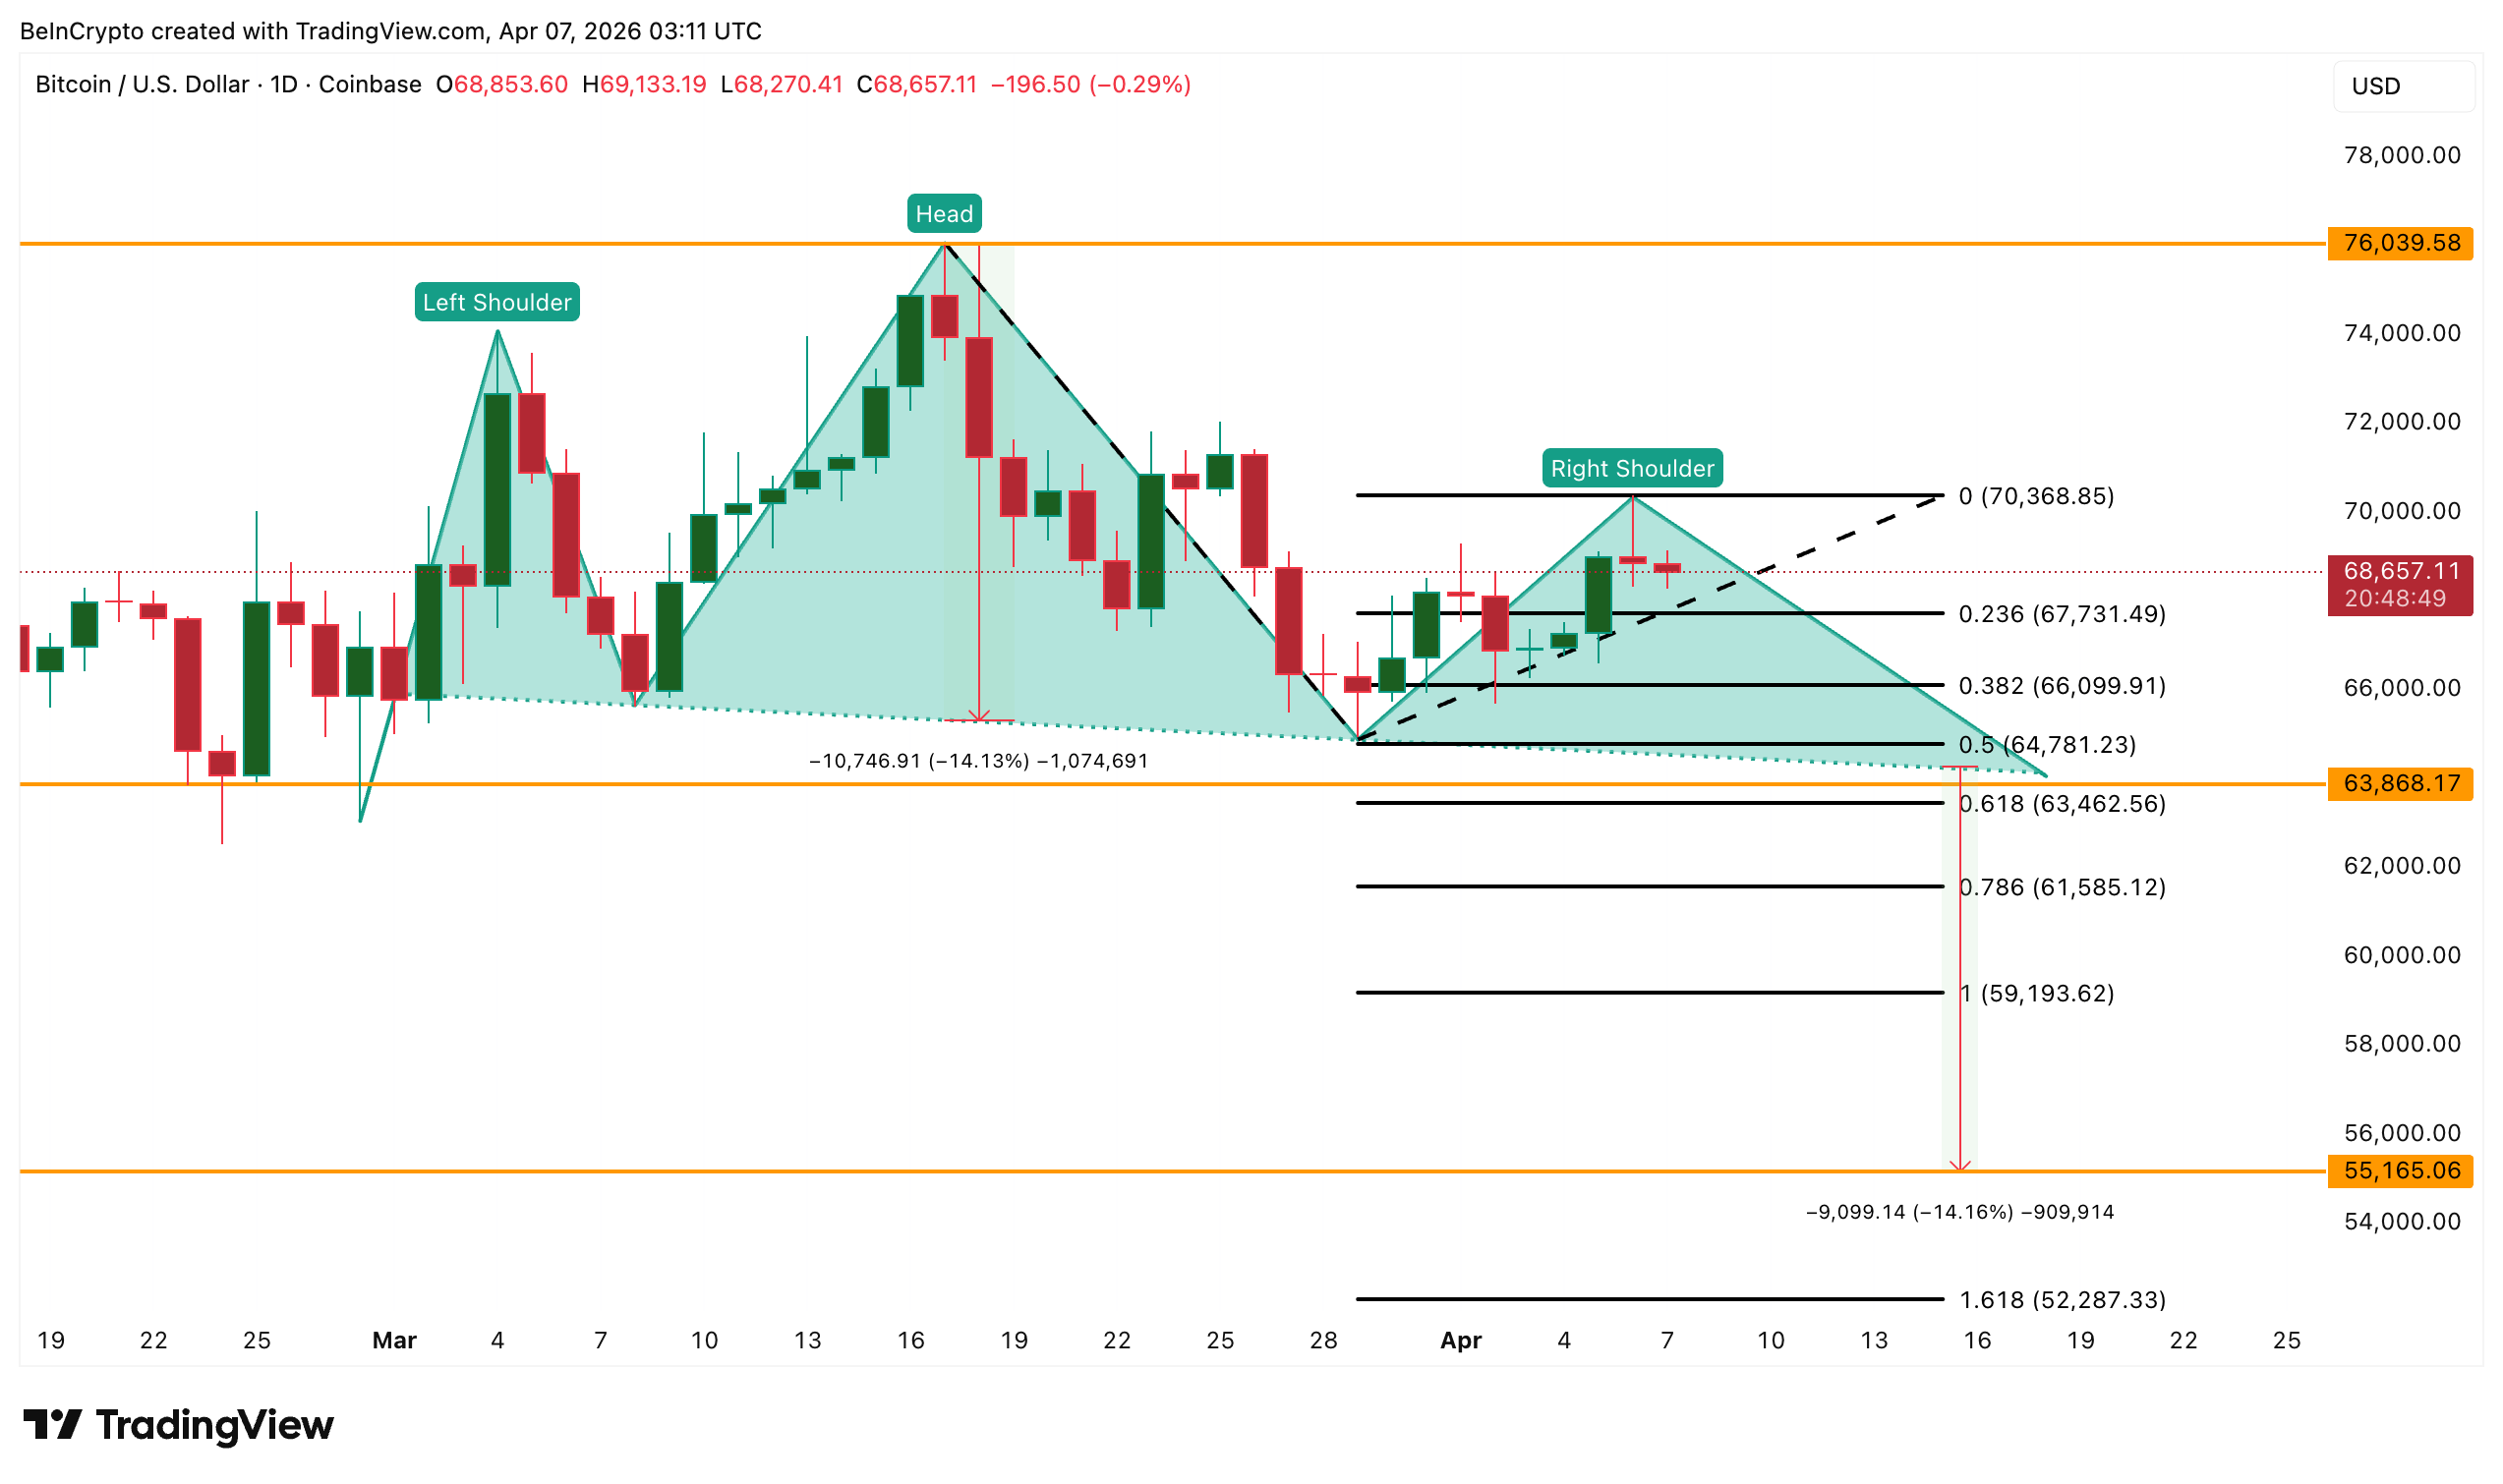
Bitcoin price trades at $68,657, continuing to build inside a head and shoulders pattern on the daily chart. Every bounce since late March has remained inside the shoulder structure, reinforcing the pattern rather than invalidating it.
The neckline sits between $64,781 and $63,868. A confirmed daily close below the neckline would activate a 14% measured move, projecting a decline toward the $55,000 zone. MARA’s continued selling of Bitcoin adds to the overhead pressure. The miner has distributed over $1.1 billion in BTC since early March and moved another 250 BTC this week, contributing to the supply that caps rallies.
For the pattern to show early signs of weakening, Bitcoin needs a daily close above $73,380. A move above $76,039, the head, would invalidate the structure entirely and shift the bias from bearish to neutral.
 Bitcoin Price Analysis: TradingView
On the downside, a break below $64,781 brings the neckline into immediate focus and the $55,000 target with it.
Avalanche (AVAX) Drops 10% and Tests the Only Bullish Structure It Has
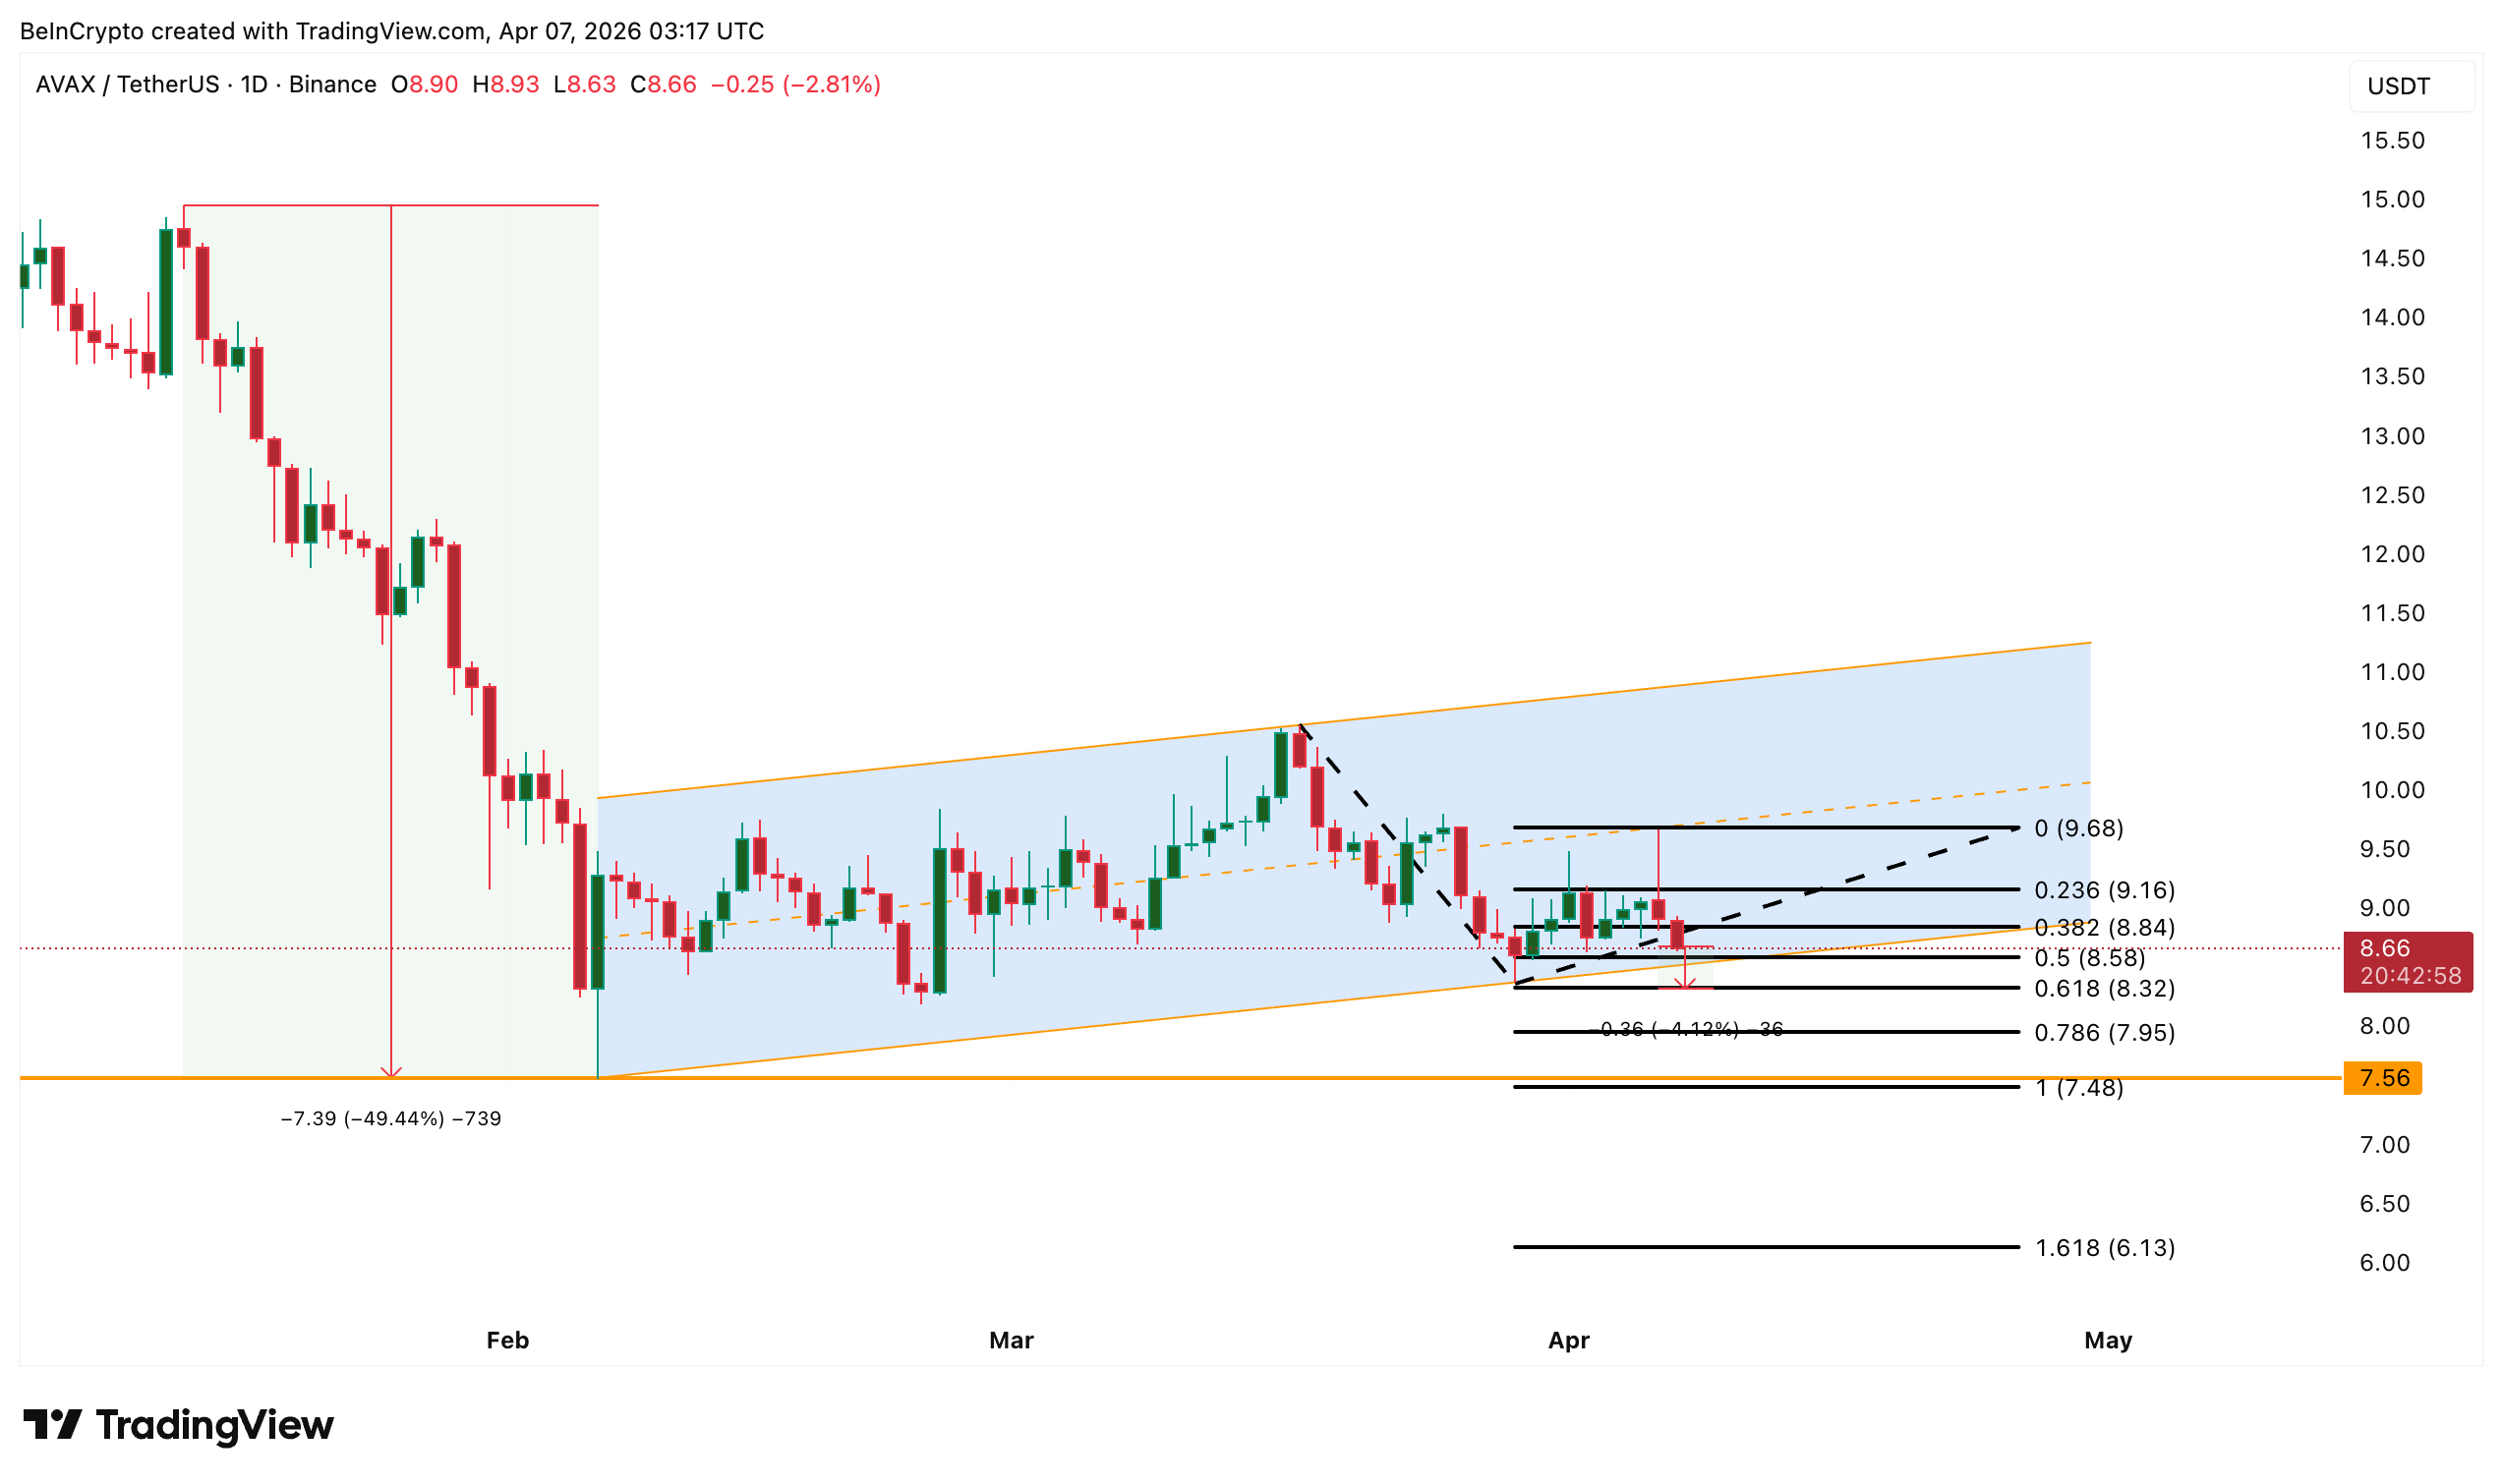
Avalanche (AVAX) trades at $8.66 after shedding almost 10% over the past 24 hours, making it one of the weakest performers among top altcoins today. The decline has pushed 30-day returns into negative territory, erasing the gains AVAX had built through March.
The broader context frames the weakness. AVAX dropped 50% from a local high of $14.94 on January 14 to a low of $7.56 by February 6. The rebound since then has taken place inside an ascending channel, but that channel remains a recovery structure rather than a confirmed uptrend. Price needs to break the upper trendline for the channel to turn genuinely bullish.
Mid-March saw an attempt at that upper trendline break, but it failed. The current sell-off has now dragged AVAX back toward the lower trendline, and the distance is closing fast.
 AVAX Price Analysis: TradingView
A break below $8.58 followed by $8.32 would confirm a lower trendline breakdown. The bearish decline from January 14 could then resume rather than reversing.
Below the channel, $7.56 at the February 6 low becomes the immediate target. $6.13 as the next level if selling accelerates. Strength only returns if AVAX reclaims $9.16, with $9.68 as the level that would somewhat restore the channel’s bullish potential.
0
0


 Gestisci cripto, NFT e DeFi in un unico luogo
Connetti in sicurezza il portafoglio che usi per iniziare.

0
0


0
0

0
0