
Bitlayer Price Prediction September 2026: Can BTR Beat Bitcoin Now?

0
0

Bitlayer Price: Can BTR Outperform Bitcoin After Its 325% Surge?
BTR didn't just move today. It ripped. And that changes the question everyone's asking heading into September.
A Coin That Woke Up Overnight
Bitlayer price prediction September 2026 conversations are suddenly everywhere, and there's a reason for that. BTR traded near $0.1520 as of this writing, up more than 325% in 24 hours, while Bitcoin sat quietly at $78,868. That gap alone tells a story.
One asset moved a little. The other one exploded.
So the real question isn't "Where does BTR go next?" It's whether a Bitcoin Layer 2 token can actually beat Bitcoin price action over the next few weeks or whether this is a one-day fireworks show that fades fast.
Token Overview: BTR vs BTC
Seeing both assets side by side makes the beta gap obvious fast. Full data comes from BTR market data on CoinMarketCap.
Bitlayer (BTR) Overview
Metric | Value |
Price | $0.1520 |
24h Change | +325.64% |
Market Cap | $50.69M |
24h Volume | $342.02M |
FDV | $152.09M |
Circulating Supply | 333.28M BTR |
Total / Max Supply | 1B BTR |
Holders | 44.29K |
All-Time High | $0.2371 (Feb 15, 2026) |
All-Time Low | $0.01586 (Jul 18, 2026) |
Bitcoin (BTC) Overview
Metric | Value |
Price | $78,868 |
24h Change | -0.26% |
Market Cap | $1.58T |
24h Volume | $28.82B |
FDV | $1.65T |
Circulating Supply | 20.07M BTC |
Max Supply | 21M BTC |
All-Time High | $126,198.07 (Oct 7, 2025) |
All-Time Low | $0.04865 (Jul 15, 2010) |
On the ecosystem side, Bitlayer's recent update around its infrastructure partners suggests the team is still shipping through this rally, not just riding hype.
Bitcoin's Setup Sets the Tone for BTR
Bitcoin trades in a descending channel breakout on the daily chart, trading around $78,800 with an RSI near 79.52, deep in overbought territory.
Resistance sits at $82,361, then $91,122, then $97,939. Support holds at the $68,154 EMA zone, with deeper cushions at $62,690 and $57,735.
Institutional demand is backing this move. Bitcoin spot ETFs pulled in $314.37M on August 25, 2026, marking seven straight days of net inflows, pushing cumulative inflows past $54B. When we pulled up the flow data, BlackRock alone had added billions in fresh exposure within hours.
Regulatory tailwinds matter here too, and the ongoing Clarity Act developments could shape sentiment through September. But macro risk hasn't gone away. Traders are still watching geopolitical risk news for anything that could hit risk appetite fast.
Bitcoin ETF Flow Data
According to Sosovalue, institutional flow backs up the chart. Daily net inflow into US Bitcoin spot ETFs sat at $31.36M as of August 26, with cumulative net inflow past $54.39B and total net assets at $98.84B, roughly 2.41% of Bitcoin's entire market cap.
Total value traded across these funds hit $2.26B in a single day. Fidelity's FBTC and Grayscale's GBTC currently lead net assets, with BlackRock's IBIT still holding the largest single pool near $60.94B.
The bigger picture from earlier in the week matters too: seven straight days of net inflows, a $314.37M single-day pull on August 25, and BlackRock adding 3,620 BTC and 12.5 thousand ETH in under ten hours. That's not retail chasing a candle. That's steady, repeated buying.
Why $BTR Exploded 325% in a Single Day
Turns out, Bitlayer's breakout wasn't random. $BTR broke clean out of a multi-month consolidation zone breakout that had trapped price between roughly $0.014 and $0.034 since spring. Once that lid came off, buyers didn't hesitate.
Volume followed the move too, with exchange listing updates showing BTR trading actively across major venues within hours of the breakout.
Tokenomics.com published a fresh breakdown on $BTR this week, covering token allocation, the vesting schedule, unlock dates, revenue, and valuation in one place. That tokenomics breakdown suggests Bitlayer is treating this rally as a moment to put supply data in front of holders, not bury it.

Bitlayer itself weighed in too, reposting news that its infrastructure partner OpenMax had achieved SOC 2 Type 1 compliance, tested and attested to under AICPA standards. The team's own Bitlayer recent update simply read "ready for business," a small but telling signal the project is leaning into institutional credibility right as the token gets attention.
$BTR Daily Chart Analysis
BTR traded between $0.1332 and $0.1670 during the session, with the RSI spiking to 96.25. That's not just overbought. That's extreme, and extreme readings like this rarely hold in a straight line.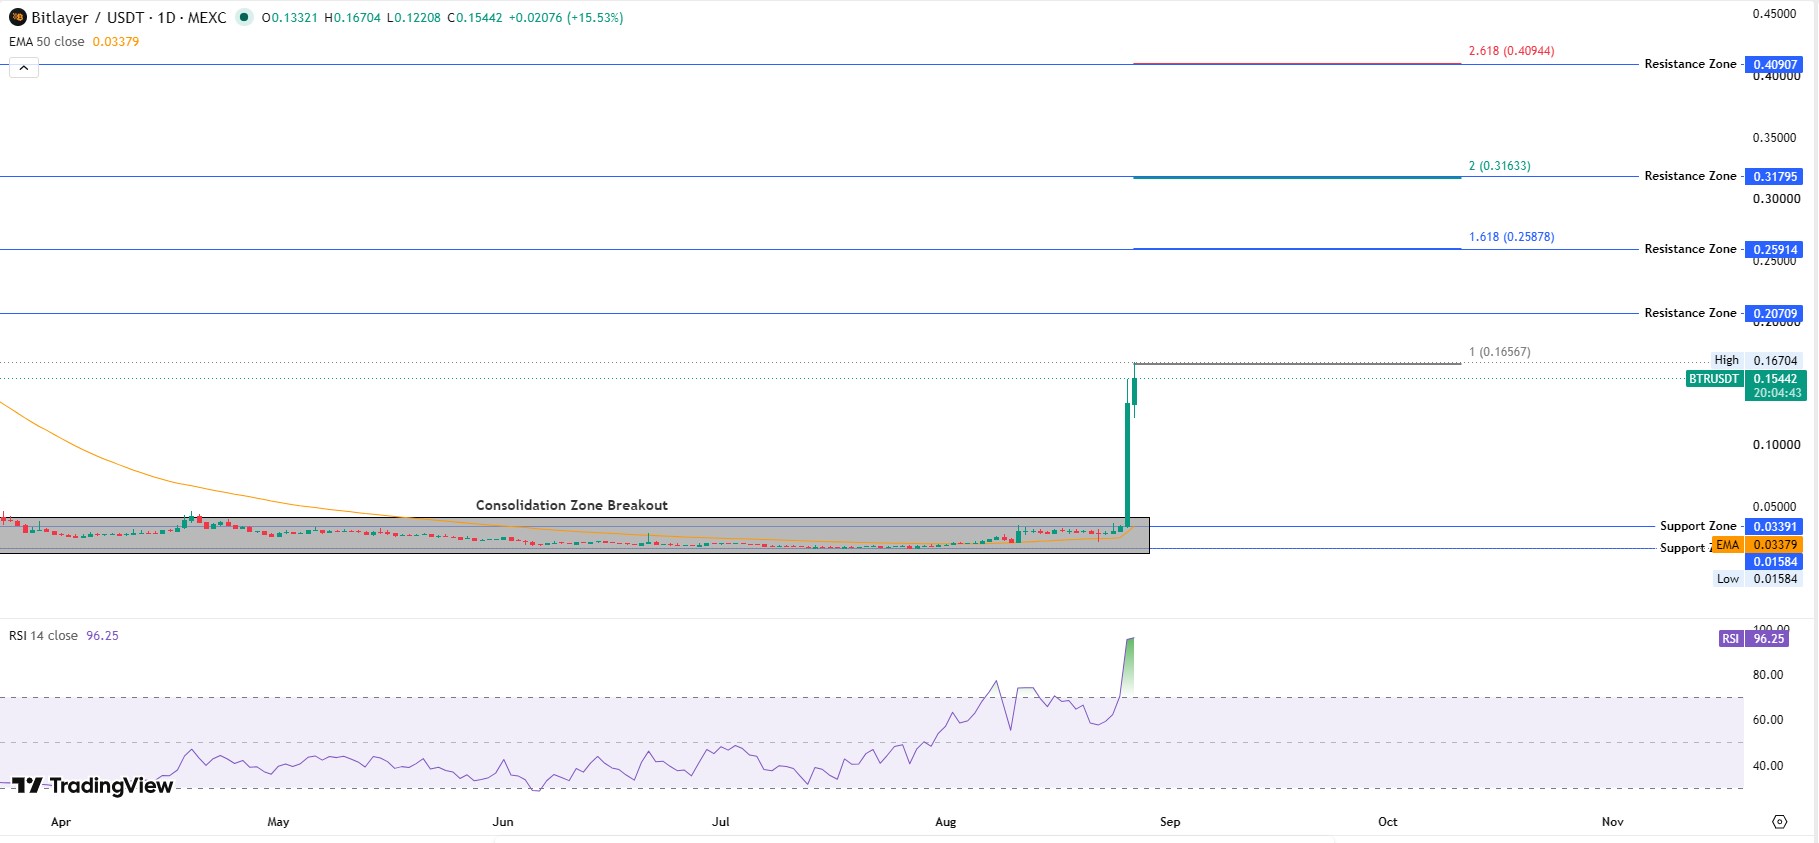
Immediate resistance sits at $0.167, the session high. Above that, fib-extension zones line up at $0.207, $0.259, and $0.318, each one a plausible target if buying pressure keeps returning.
On the downside, support now rests near $0.122, roughly the session low. A deeper floor sits further back near the old breakout shelf at around $0.034, which is where the entire multi-month base formed before this move.
Momentum is real here. Fragile too. A pullback toward $0.10 wouldn't even break the broader structure, but a daily trade back under $0.034 would completely undo the breakout thesis. Traders watching this in real time can follow it on a live BTR chart for updates as the session develops.
Bitcoin Daily Chart Analysis
Bitcoin's own chart looks stretched too, just less dramatically. Price cleared its prior descending channel and consolidation zone, trading near $78,800 with the RSI at 79.52.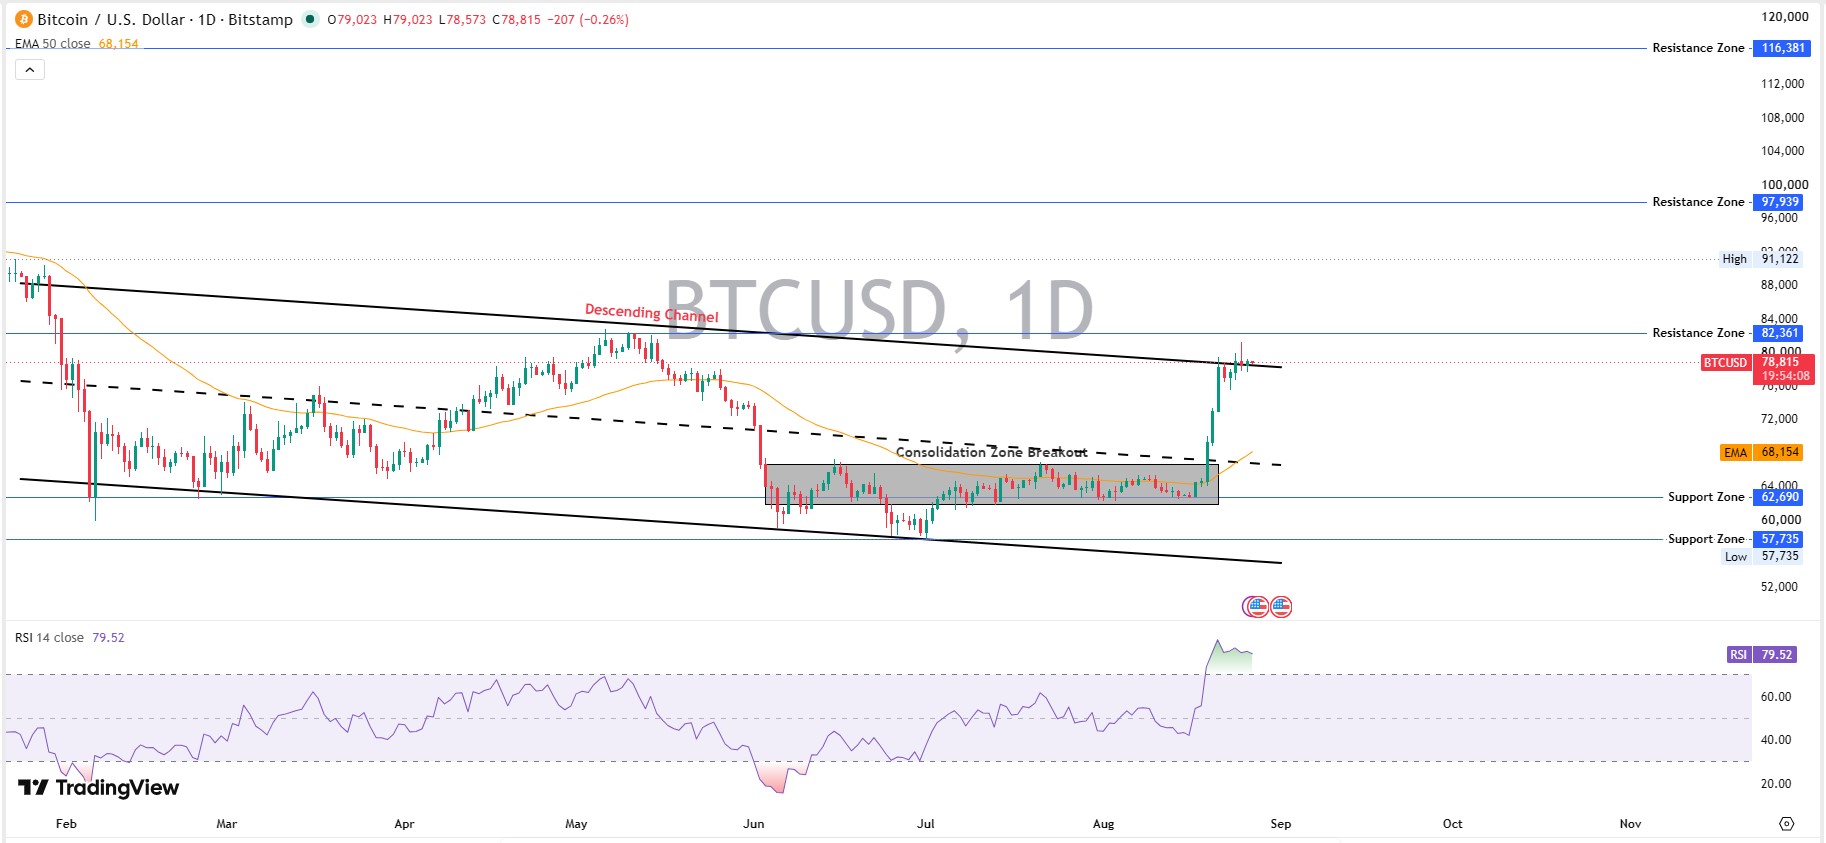
That reading sits well into overbought territory, though nowhere near BTR's extreme. Resistance at $82,361 is the first real test, and a clean break there opens the door toward $91,122 and eventually $97,939.
Support holds at the $68,154 EMA, backed by deeper zones at $62,690 and $57,735. As long as that EMA holds on a daily trade, the broader uptrend stays intact.
Can $BTR Actually Outperform Bitcoin?
Here's the thing about high-beta tokens: they amplify whatever Bitcoin does, in both directions.
Scenario 1: Bitcoin Breaks Higher
If BTC clears $82,361 and pushes toward $91,000, Bitcoin Layer 2 tokens tend to catch a bigger relative bid. BTR could retest $0.207 to $0.259, and on a percentage basis, that would mean BTR outperforms Bitcoin by a wide margin.
Scenario 2: Bitcoin Goes Sideways
If BTC just grinds between $70,000 and $82,000, BTR's next move depends on its own catalysts. Ecosystem updates, exchange volume, and token disclosures matter more than BTC's trend here.
Scenario 3: Bitcoin Rolls Over
Is a pullback the bigger risk right now? Fair question.
If BTC loses the $68,154 EMA and slides toward $62,690, risk appetite for small-cap Layer 2 tokens usually dries up fast. $BTR, already up 325% and massively overbought, could give back a large chunk of that move.
Bitlayer Price Prediction 2026: Bear, Base, and Bull Scenarios
Timeframe | Bear Case | Base Case | Bull Case | Probability | Invalidation |
7 Days | $0.08–$0.10 | $0.12–$0.15 | $0.18–$0.21 | Bear 30% / Base 45% / Bull 25% | Daily trades below $0.10 |
30 Days | $0.05–$0.08 | $0.10–$0.16 | $0.21–$0.26 | Bear 30% / Base 40% / Bull 30% | Breakdown below $0.034 |
Early 2027 | $0.03–$0.06 | $0.10–$0.20 | $0.26–$0.41 | Bear 35% / Base 40% / Bull 25% | BTC loses $57,735 support |
Bitcoin's own range for the same stretch looks tamer: roughly $70,000 to $91,000, based on current support and resistance and continued ETF demand.
Is BTR Part of the Broader Altcoin Rally?
Yes, and that matters for how this plays out. BTR isn't rallying in isolation. Bitcoin Layer 2 tokens as a group tend to move with altcoin risk appetite, not just BTC's spot trend.
Anyone tracking this trade alongside other names can check ongoing price prediction coverage for comparison, since beta plays across altcoins tend to move in clusters.
Even memecoin market news shows similar risk-on behavior right now, which tells us this isn't a BTR-only story. Fresh momentum here isn't guaranteed to last if that broader rotation reverses.
BTR Liquidation and Volume Data
Leverage got flushed hard on this move. $BTR liquidations hit $9.08M over 24 hours, split between $1.62M in longs and $7.45M in shorts, meaning short sellers took the bigger hit as price ripped higher.
Shorter windows show the same pattern building fast: $873.72K wiped out in the first hour alone, then $1.32M over four hours, then $2.84M over twelve hours. Shorts kept getting squeezed the whole way up.
Volume backs the move too. Binance alone processed $1.29B in BTR trading, with Bybit adding $311.86M, Gate near $127M, and Bitunix at $110.50M. Full breakdowns are trackable through BTR liquidation data for anyone watching positioning in real time.
Whale Concentration and Token Unlocks
On-chain data shows the top ten BTR holders control 81.60% of circulating supply, and whale wallets alone account for 89.70% of total holder value. That's concentration risk, plain.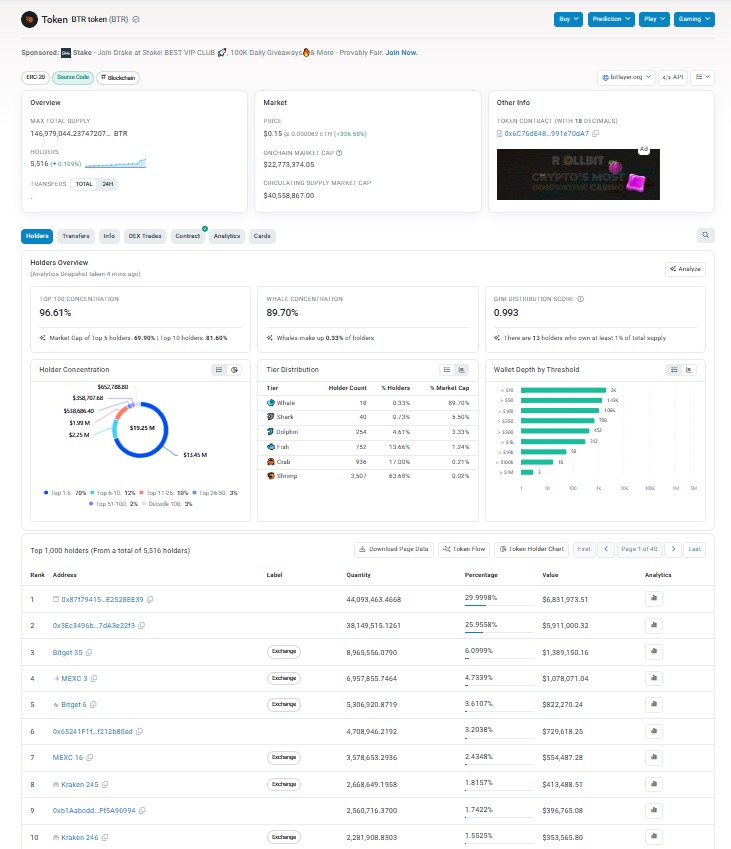
Zoom out and it gets sharper. The top 100 wallets combined hold 96.61% of supply, and the Gini distribution score sits at 0.993, about as concentrated as a token gets.
Just 18 whale wallets carry that 89.70% share. Meanwhile, over 3,500 smaller "shrimp" wallets combined control barely 0.02% of the market cap.
That's a lot of upside sitting in very few hands..
Final Take: Bitlayer Price Prediction September 2026
So, can BTR outperform Bitcoin this September? Short answer: yes, but only in the good scenario.
Bitcoin's setup is solid. ETF inflows keep stacking up, the price sits above its breakout zone, and the trend leans bullish even with the RSI stretched. That's the calmer side of this trade.
BTR is the opposite kind of asset entirely. A 325% breakout, RSI at 96, and whale wallets holding the vast majority of supply. This isn't a coin for anyone chasing steady returns.
Here's the stance: if Bitcoin keeps climbing through September, $BTR has real room to outperform on a percentage basis, purely because of its size and beta. But if Bitcoin stalls or slips, BTR gives back its gains faster than BTC ever would.
Bulls get the bigger reward here. Bears get the bigger risk. Position accordingly, and don't mistake one green day for a new trend.
Disclaimer
This article is for informational purposes only and does not constitute financial, investment, or trading advice. Cryptocurrency prices are highly volatile and unpredictable.
Always do your own research and consult a licensed financial advisor before making investment decisions. Data referenced is sourced from CoinMarketCap, CoinGlass, and SoSoValue and reflects market conditions as of 06:00 UTC on August 27, 2026, and may have changed since publication.
0
0


 한 곳에서 모든 암호화폐, NFT 및 DeFi 를 관리하세요
시작하는 데 사용하는 포트폴리오를 안전하게 연결하세요.


