NEAR Protocol price prediction 2025-2031: Is NEAR a good investment?

0
0

Key takeaways:
- NEAR price prediction shows it will reach a maximum price of $5.50 by the end of 2025.
- By 2028, NEAR is expected to rise to a maximum price of $11.29, driven by mainstream adoption.
- Looking ahead to 2031, NEAR Protocol could witness a significant surge, with its price potentially reaching $18.71 or beyond.
The rising bearish sentiment within NEAR Protocol’s community is bringing a cautious approach among traders. As NEAR continues to advance its technology and forge strategic partnerships, questions surrounding its price potential persist, inviting further analysis and exploration of its prospects.
Overview
| Cryptocurrency | NEAR Protocol |
| Ticker | NEAR |
| Price | $2.08 (-4.45%) |
| Market Cap | $2.56 Billion |
| Trading Volume 24-h | $172.2 Million |
| Circulating Supply | 1.22 Billion NEAR |
| All-time High | $20.42 Jan 17, 2022 |
| All-time Low | $0.526, Nov 04, 2020 |
| 24-h High | $2.21 |
| 24-h Low | $2.02 |
NEAR Protocol price prediction: Technical analysis
| Sentiment | Bearish |
| 50-Day SMA | $2.61 |
| 200-Day SMA | $3.63 |
| Price Prediction | $4.59 (119.82%) |
| F & G Index | 11.63 (extreme fear) |
| Green Days | 13/30 (44%) |
| 14-Day RSI | 46.18 |
NEAR Protocol price analysis: Near faces drop toward $2
TL;DR Breakdown:
- NEAR Protocol price analysis shows bearish pressure after falling below $2.
- NEAR price fell by 4.5% at the time of writing.
- NEAR Protocol has support and resistance at $2.10 and $2.20, respectively.
Near Protocol price analysis for June 20 shows that NEAR price witnessed a strong decline over the last few days, dropping from the peak of $2.6. The bulls failed to trigger a recovery and the price has fallen back to the $2.10 mark.
NEAR Protocol price analysis 1-day chart: NEAR faces bearish volatility toward $2
The 1-day NEAR/USD price chart indicates that the near protocol price trades in a steady downwards trend since rising toward $2.6. Sellers are now aiming for a strong push below $2 to initiate a breakdown below the trendline.

The technical indicators suggest mixed bearish momentum as NEAR declines toward $2.00, raising concerns of a short-term bearish rally. Moreover, the MACD is bearish at -0.022 units and suggests low buying demand.
The EMAs are below the mean position, and the latest data shows that declining bearish pressure. The RSI also shares this sentiment as the indicator fell to 35.48 from the 70.00 index level; though, it suggests room for further downwards movement. The wide Bollinger Bands suggest high volatility, indicating that the $2.1 level may not hold for the week.
NEAR price analysis 4-hour chart
The 4-hour price chart of NEAR shows that NEAR has met strong resistance at the $2.2 mark and the following selloff suggests high bearish momentum. If the buyers fail to defend $2.10 support, NEAR may see a freefall below the $2.00 level.

The RSI is at 36.85, suggesting that the asset is at the bottom of the the neutral region, which indicates that NEAR price is facing domination from sellers. The MACD is showing minor bearish candles, with the MACD line at 0.002, showing declining bullish pressure.
NEAR Protocol technical indicators: Levels and actions
Daily simple moving average (SMA)
| Period | Value | Action |
|---|---|---|
| SMA 3 | $ 2.27 | SELL |
| SMA 5 | $ 2.37 | SELL |
| SMA 10 | $ 2.39 | SELL |
| SMA 21 | $ 2.43 | SELL |
| SMA 50 | $ 2.65 | SELL |
| SMA 100 | $ 2.60 | SELL |
| SMA 200 | $ 3.35 | SELL |
Daily exponential moving average (EMA)
| Period | Value | Action |
|---|---|---|
| EMA 3 | $ 2.45 | SELL |
| EMA 5 | $ 2.49 | SELL |
| EMA 10 | $ 2.49 | SELL |
| EMA 21 | $ 2.54 | SELL |
| EMA 50 | $ 2.81 | SELL |
| EMA 100 | $ 3.37 | SELL |
| EMA 200 | $ 4.01 | SEL |
What to expect from NEAR Protocol price analysis?

NEAR observes the bulls crashing into an iron board at the $3.3 mark that has sent the price crumbling back toward the $2 mark. If the bulls are unable to defend the level, any short-term gains made by the asset might be neutralized.
Traders should expect the price of Near protocol to continue its trend of steady decline with the next support at the $1.90 mark. However, if the bulls are able to initiate a reversal towards $2.34, NEAR may rise to the $2.44 mark by the middle of next week.
Is Near Protocol a good investment?
NEAR Protocol distinguishes itself in the cryptocurrency market capitalization, emphasizing scalability, usability, and developer-friendliness. It aims to facilitate the creation of decentralized applications (dApps) and smart contracts, catering to developers and end-users. NEAR’s innovative technology and user-centric approach make it attractive for mainstream adoption of blockchain applications.
With a focus on user experience and developer tools, NEAR Protocol is positioned to drive significant medium term growth in the decentralized application ecosystem. Its potential to disrupt traditional industries and capture market share in the blockchain space makes it an intriguing investment opportunity for those interested in innovative technology solutions.
Why is NEAR down?
The 4-hour price chart of NEAR shows that NEAR has met strong resistance at the $2.60 mark and the following selloff caused a drop to $2. This was due to the continued selling pressure on the price chart.
Will NEAR recover?
NEAR protocol price has seen a massive selloff in the last thirty days as price fell from near the $3.00 mark to the current $2 price level. However, analysts believe that this bearish momentum will be short-term, predicting a price range of $2.25 and the $5.5 by the end of 2025.
Will NEAR reach $10?
NEAR protocol price is experiencing a volatile market movement that may see it reach the $10 mark before the end of 2027.
Will NEAR reach $20?
NEAR protocol price is expected to cross the $20 threshold by 2031 This supports the long term forecast as the industry continues to see increasing adoption across the mainstream. The bullish rally will be supported by NEAR’s vision of a scalable future and user and developer-friendly architecture that sets it apart from other blockchains.
Will NEAR reach $50?
The chance of NEAR protocol price reaching the $50 mark depends on various circumstances, such as future network development, market regulations, and the broader cryptocurrency market growth. If NEAR continues its current trajectory, it can reach $50 in the next several years.
Does NEAR have a good long term future?
Yes, NEAR has a good long-term future due to its innovative technology, focus on scalability and strong ecosystem development, which supports a favorable price prediction . However, the project must keep up with sector developments to maintain its edge in the digital ecosystem.
Recent news/opinions on Near Protocol
- NEAR protocol’s Chain Signatures tech added support for EdDSA signing.
NEAR price prediction June 2025
NEAR protocol price forecast for the month of June is expected to trade at a minimum price of $1.99, with an average of $2.50 and a maximum price of $4.20.
| Month | Minimum Price | Average Price | Maximum Price |
| June | $1.99 | $2.50 | $4.20 |
NEAR price prediction 2025
For 2025, the minimum price is $2.25, the average price is $4.09, and the maximum price is $5.50.
| Year | Minimum Price ($) | Average Price ($) | Maximum Price ($) |
| 2025 | 2.25 | 4.09 | 5.50 |
NEAR price prediction 2026-2031
| Year | Minimum Price ($) | Average Price ($) | Maximum Price ($) |
| 2026 | 5.36 | 6.22 | 6.40 |
| 2027 | 7.37 | 8.51 | 8.73 |
| 2028 | 9.22 | 10.17 | 10.78 |
| 2029 | 9.62 | 10.47 | 11.29 |
| 2030 | 11.84 | 13.13 | 13.68 |
| 2031 | 16.85 | 17.90 | 18.71 |
NEAR price prediction 2026
The forecast for 2026 suggests a continuation of the price rise with a minimum value of $5.36, an average price of $6.22, and a maximum value of $6.40.
NEAR price prediction 2027
Technical analysis and projections for 2027 anticipate the minimum price to be around $7.37, with an average trading price of $8.51, and a maximum value of $8.73 by the end of 2027.
NEAR price prediction 2028
In 2028, NEAR price prediction estimates NEAR Protocol’s price to be trading at a minimum of $9.22, an average of $10.17, and a maximum value nearly reaching $10.78 by the end of 2028.
NEAR protocol prediction 2029
The NEAR Protocol price prediction for 2029 suggests the bullish sentiment will continue with a minimum price of $9.62, an average trading price of nearly $10.47, and a maximum value of $11.29 by the end of 2029.
NEAR price prediction 2030
In 2030, NEAR protocol price prediction forecasts NEAR could trade at a minimum of $11.84, an average price of nearly $13.13, and a maximum value of $13.68 by the end of 2030.
NEAR price prediction 2031
The NEAR Protocol forecast for 2031 suggests a sustained bullish sentiment with a minimum value of $16.85, an average trading price of nearly $17.90, and a maximum value of $18.71.

NEAR market price prediction: Analysts’ NEAR price forecast
| Firm | 2025 | 2026 |
| Coincodex | $11.79 | $14.28 |
| DigitalCoinPrice | $11.09 | $12.92 |
Cryptopolitan’s NEAR protocol (NEAR) price prediction
Cryptopolitan’s predictions show that the price of the NEAR protocol will reach a high of $5.50 in the second half of 2025. In 2026, it will range between $5.36 and $6.40. In 2030, it will range between $11.84 and $13.68, with an average of $13.13. Note that these predictions are not investment advice. Seek independent professional consultation or do your research.
NEAR Protocol historic price sentiment
- The Near Protocol (NEAR) began its journey in August 2020, aiming to create a scalable and permissionless blockchain. The first recorded trade value in October 2020 was $1.072, closing the year at $1.459 after a recovery.
- In 2021, NEAR showed an uptrend, starting at $1.305 and reaching an all-time high (ATH) of $7.572 by March 13. A market downturn pushed the price down to $1.537 by July 19, but it rebounded to $11.776 on September 9 and further to $13.168 on October 26.
- By 2022, NEAR’s price crashed to below $2.00, losing over 90% of its peak value. Throughout 2023, NEAR saw low volatility, with prices remaining below $2.50 for most of the year.
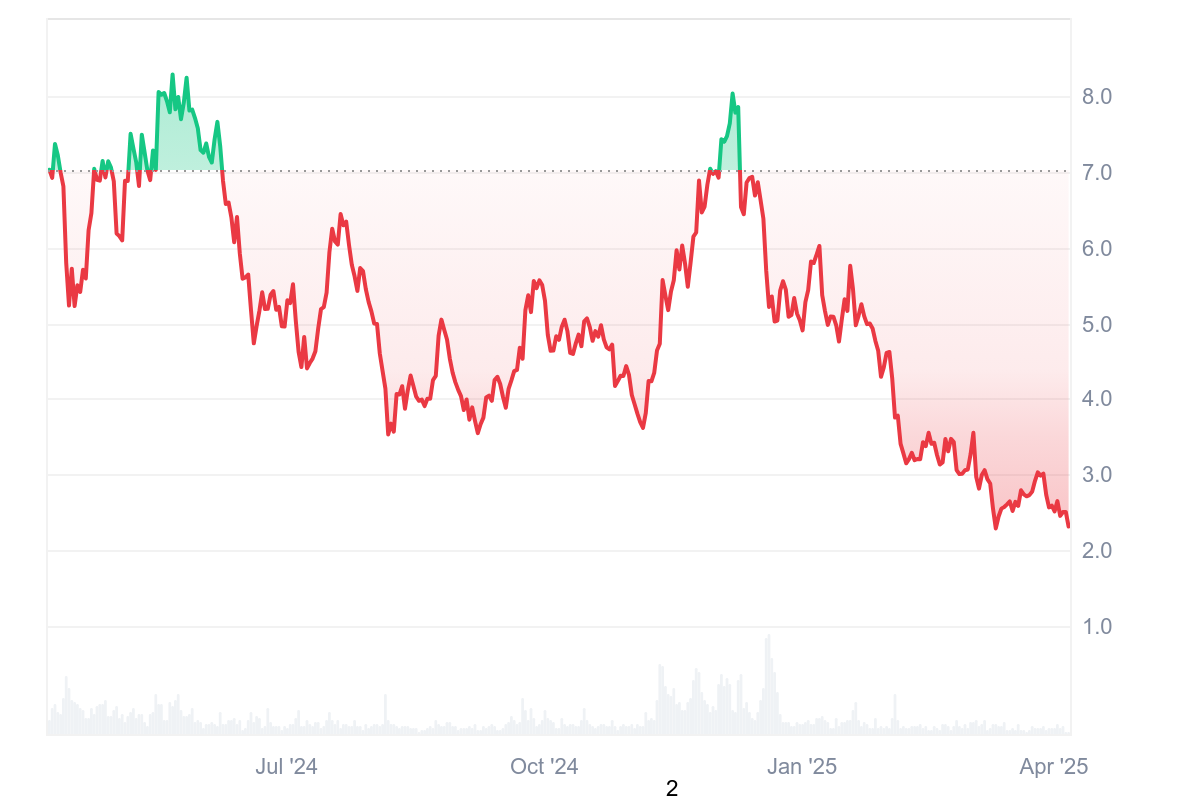
- Since the start of 2024, NEAR has experienced a strong recovery, climbing to $7.80. However, after reaching the $8.00 mark in mid-May, it fell back to $5.60. In June, NEAR traded between $4.48 and $7.66. It rose from $5.20 to $6.04 in July but closed the month below $5.00. NEAR started August at $5.00, declining to $3.89 by the end of the month.
- In September 2024, the asset bounced back and closed the month above the $5.20 mark. In October, the price stumbled and fell to $4.850 in the first few days before closing the month below the $4.00 mark leaving a negative outlook at the start of November.
- November saw NEAR making remarkable strides as the bulls held strong control of markets during the month, a trend that was expected to continue into December. However, the month saw NEAR plummet from heights of $7.00 to fall below $5 before closing the month.
- In January the price could not find a stable foothold and the price continued dwindling, closing the month just above $4.00
- In February the price fell significantly towards the $3.00 mark and continued to decline ending the month at $2.80. In March the price continued to decline ending the month near $2.50, a trend that continued in April ending the month at $2.35. In May the price recovered but only to the extent of reversing April’s losses as the month ended below $2.50
0
0

 Manage all your crypto, NFT and DeFi from one place
Securely connect the portfolio you’re using to start.

0
0

0
0

0
1

0
0