ZBCN Token Warning! A 50% Price Dip Awaits Zebec Network’s Coin

0
0
Zebec Network’s ZBCN token risks a deeper correction after rallying nearly 170% in the past two months.
Technical Setup Raises 50% ZBCN Price Dip Risks
ZBCN/USDT traded around $0.0032 this week, down roughly 20% from last week’s local top near the $0.004 area. The pullback emerged after the token tested the upper trendline of a multimonth descending channel pattern on the weekly chart, a setup that often precedes renewed downside moves when resistance holds.
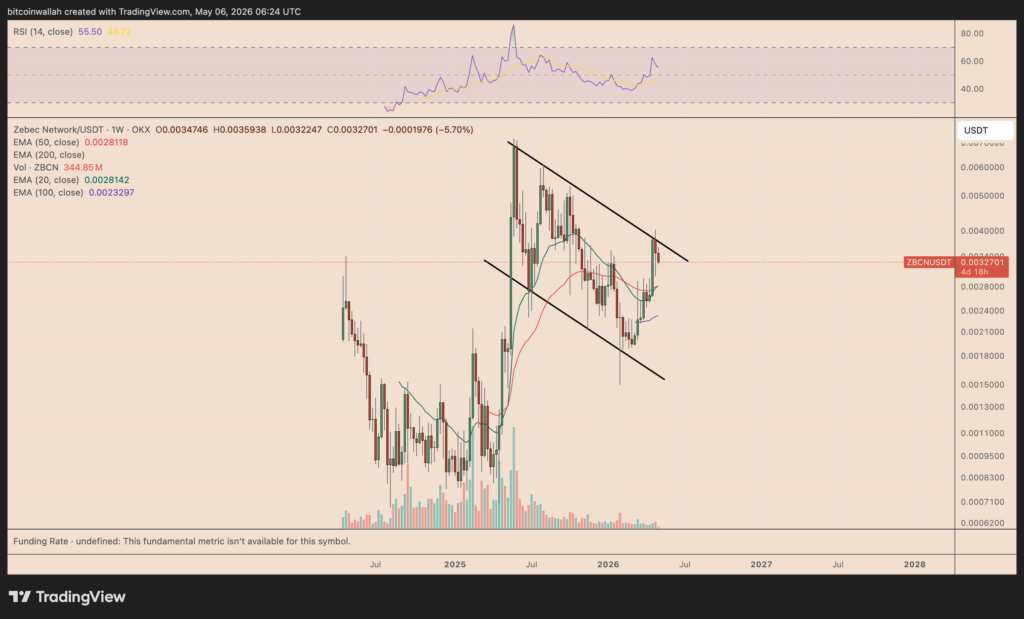
From a technical perspective, the token now risks extending its decline toward its key exponential moving averages first, including the 20-week and 50-week EMAs. These levels may provide temporary support during the ongoing correction phase.
However, the broader bearish setup points to a larger downside target near the channel’s lower trendline. That support area aligns with the $0.0014–$0.0016 range, down roughly 50% from current price levels.
Descending channels form when price trends lower between parallel resistance and support trendlines. Traders typically watch the upper trendline as a selling zone and the lower trendline as a potential downside target during corrections.
ZBCN’s current structure suggests the token may continue drifting lower into June or July if bearish pressure persists across the broader crypto market.
What If The Bearish Zebec Network Goes Wrong?
Bulls retain a chance to invalidate the bearish setup.
A decisive breakout above the channel’s upper resistance area near $0.0034–$0.0036 could weaken the downside outlook.
Such a move may trigger a fresh rally toward $0.0045, which coincides with the 0.382 Fibonacci retracement level on the weekly chart. ZBCN’s weekly relative strength index (RSI) supports the upside case, having room to rise further as it treads below the overbought threshold of 70.
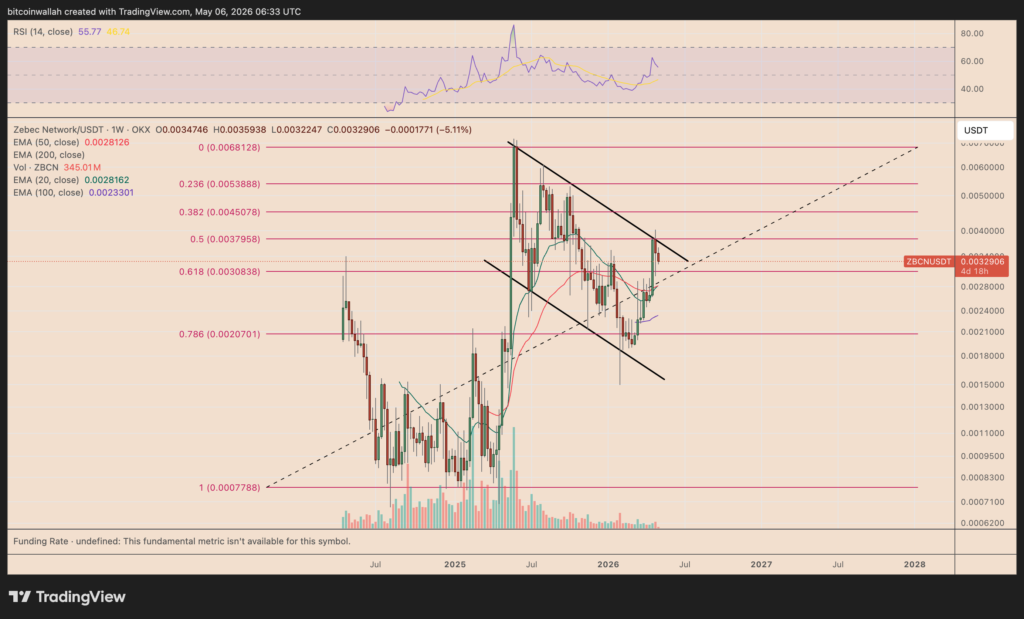
Until then, traders appear to remain cautious as ZBCN struggles to sustain momentum above channel resistance.
For more Bitcoin, crypto, and macro news, keep reading at www.coinchapter.com.
The post ZBCN Token Warning! A 50% Price Dip Awaits Zebec Network’s Coin appeared first on CoinChapter.
0
0


 从同一位置管理所有加密资产、NFT 和 DeFi 资产
安全地关联您正在使用的投资组合,以开始交易。