Bitcoin Cash Down by 17% in Two Days. How Low Until Rebound?

0
0

Bitcoin Cash on Monday had one of its biggest declines. Looking back at price action, the last time it saw such a drop was on Feb 5, when it retraced to its lowest level in more than six months.
The asset declined from $570 to a low of $487. The correction exceeded expectations as one outlook predicted a drop below $520. Nonetheless, it rebounded and ended the session down more than 13%. However, the slight recovery lasted only a short time.
BCH resumed its downtrend on Tuesday, falling to a low of $470, a loss of almost 5%. It has since rebounded and trades at $482. Fears that the downturn is not over remain strong amid the pullback.
Nonetheless, there are several indications that the trend is nearing its end. One such is the candle representing the current intraday session. It’s smaller than Monday’s and has pulled back almost half of its previous losses. It suggests reduced selling pressure and increased exhaustion from the bears.
However, it remains to be seen whether this marks the end of the downtrend. Interestingly, indicators on the 1-day chart suggest that the altcoin is due for a rebound after two days of massive decline.
A previous outlook highlighted some bullish readings from the 4-hour chart, including RSI being below 30 and the asset trending close to bollinger’s lower band. Both readings suggest a recovery was imminent in the short term.
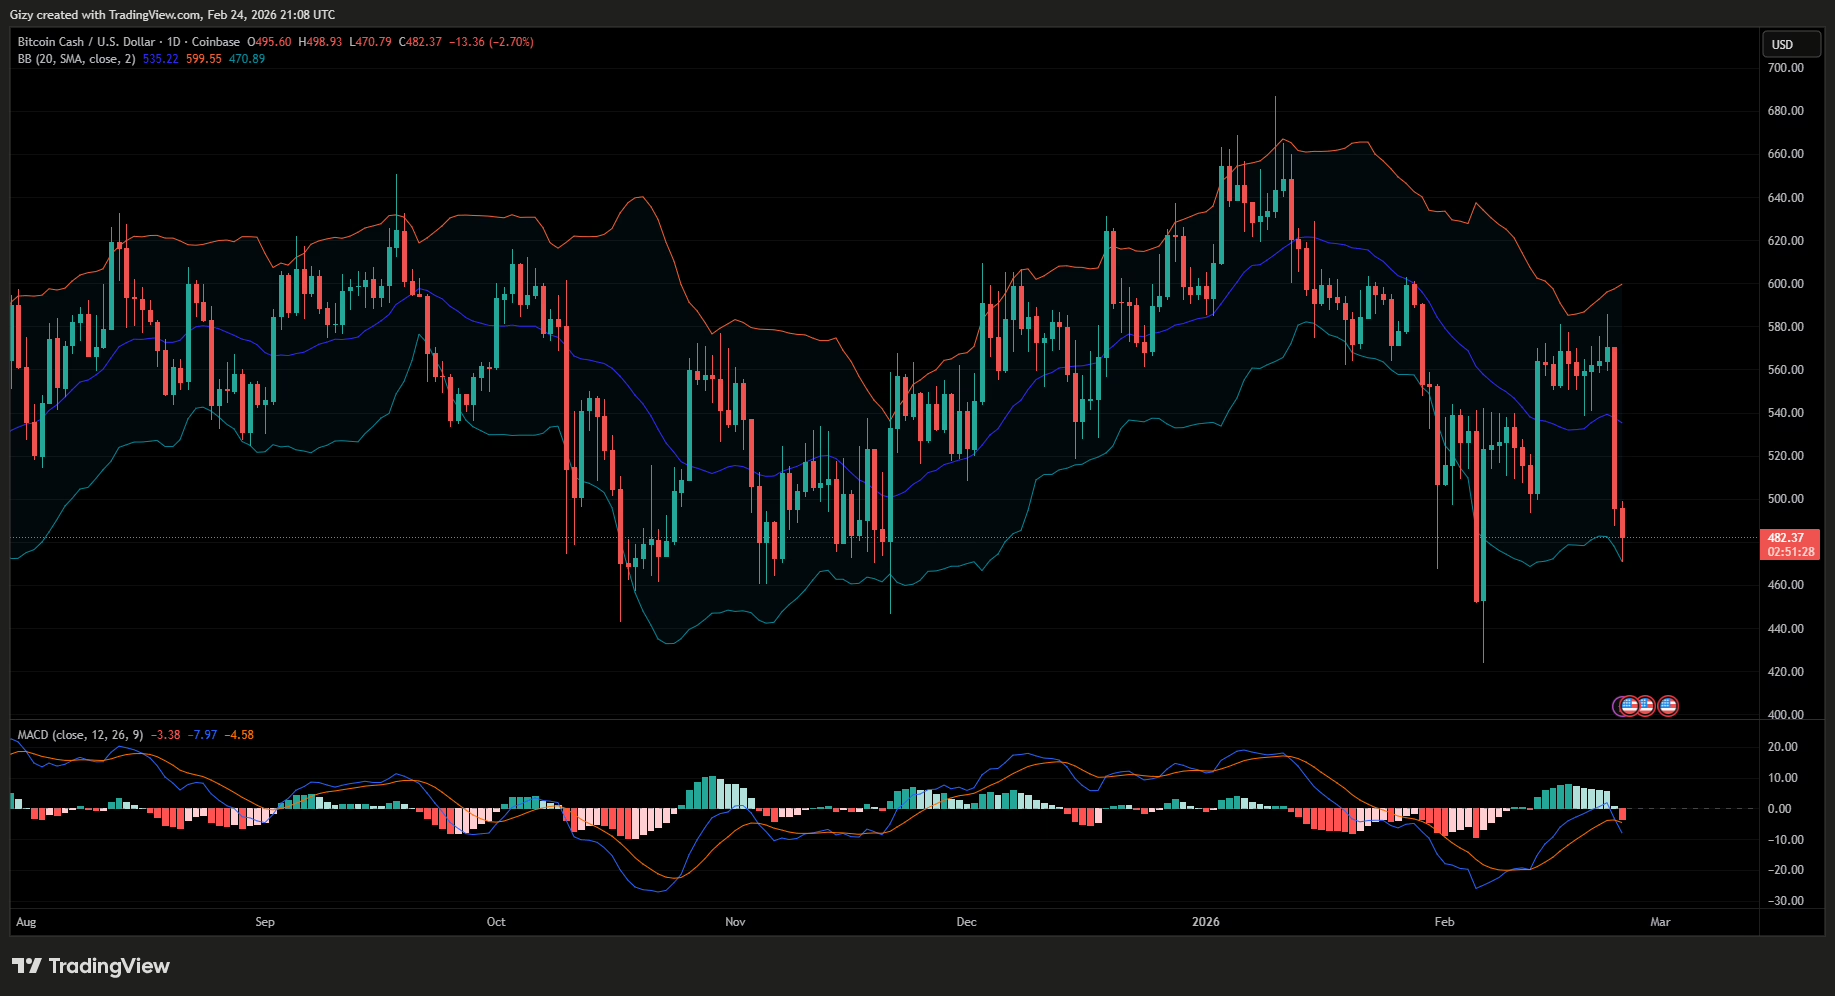
Nonetheless, the BB on the 1-day chart supports their reading. The latest decline followed the altcoin’s failure to break above the upper band. It recently tested the lower band, suggesting that a trend reversal may occur in the coming days.
Bitcoin Cash Remains at Risk
Previous price movements suggest that a retracement to the bollinger’s lower band does not guarantee an instant rebound. Using events in the first week as a reference, the likelihood of further decline remains high.
Nonetheless, it is worth noting that the asset rebounded in January and bounced off the lower band. It remained rangebound for several days before resuming its downtrend, leading to a larger decline. With the BB on the 1-day chart flipping bullish, a repeat of this event may happen—first, consolidation, followed by another massive plummet.
Aside from the BB, the moving average convergence divergence recently flipped bearish. In response to Monday’s dip, the 12-EMA quickly intersected the 26-EMA in a negative crossover. Normally, this signals further downtrend.
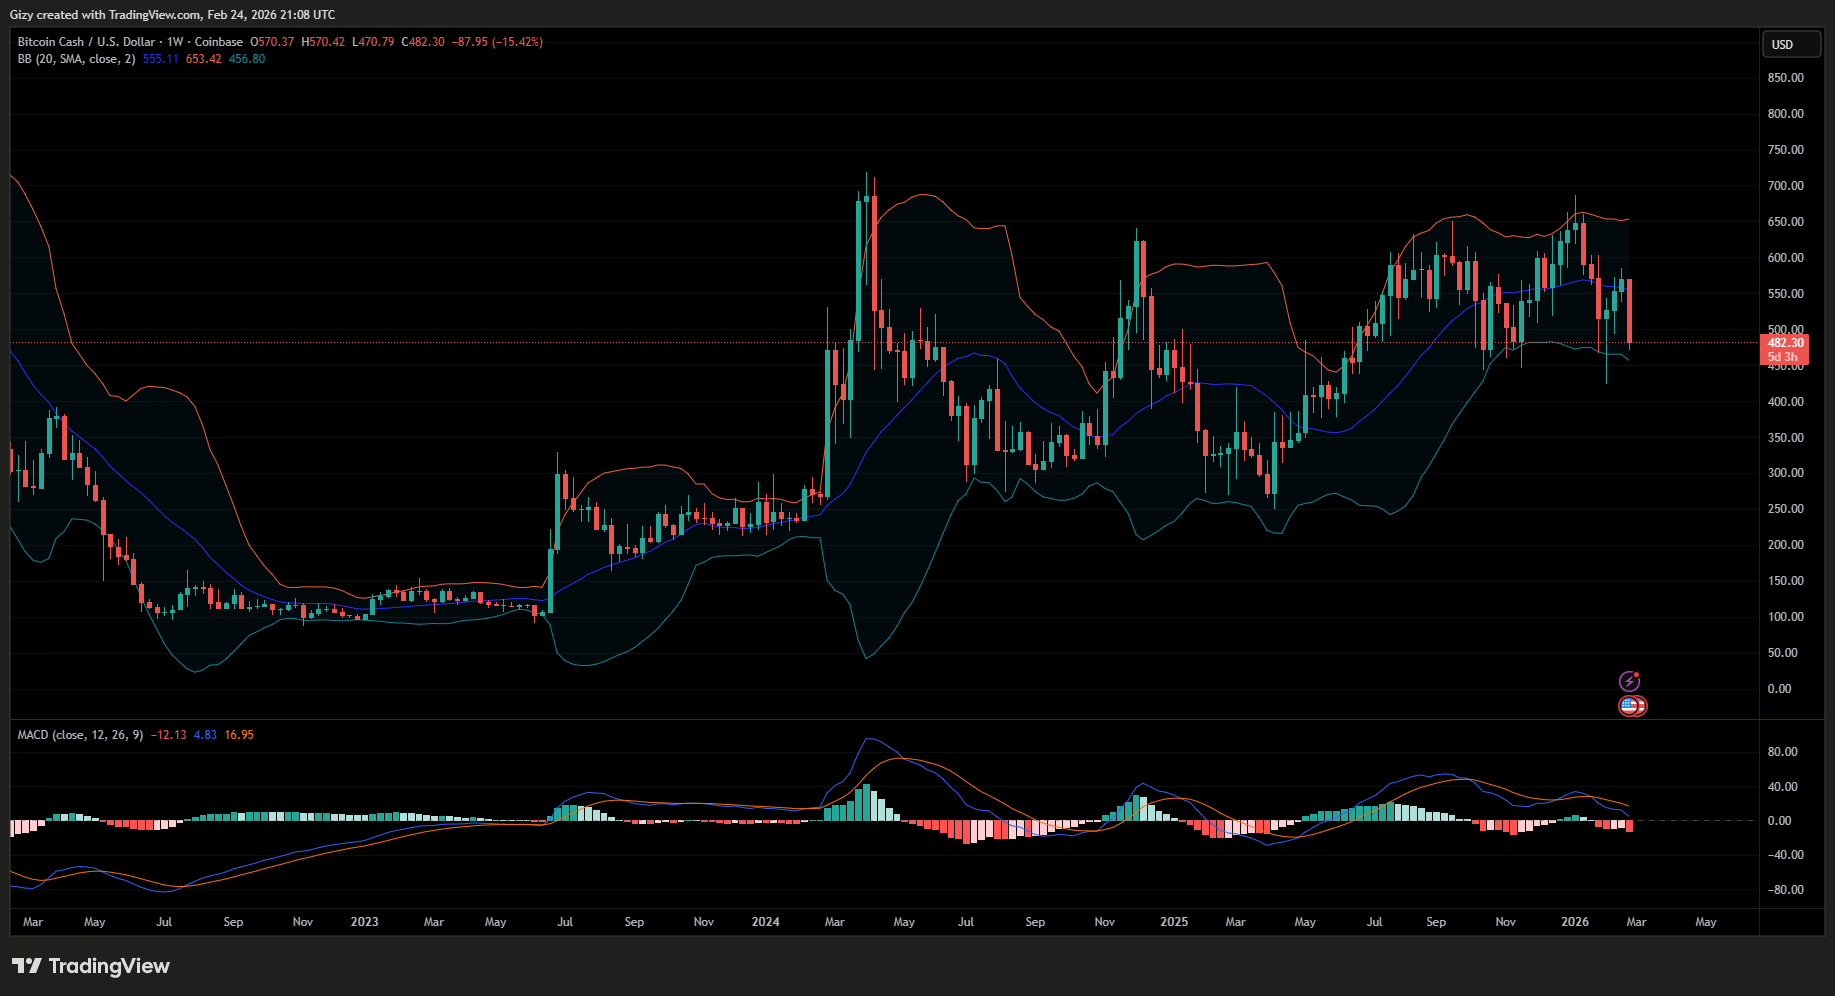
On the 1-week chart, there are more bearish readings. In this timeframe, BCH is yet to retest the lower band. Adding to the fears that the downturn may resume anytime from now.
In summary, BCH will not have any strong uptrends this week. It may experience a slight recovery, then consolidation. In a worst-case scenario, prices will plummet even lower. The 1-week places the target at $456, suggesting a possible $30 drop this week.
While investors struggle to push Bitcoin cash higher, another asset recently registered a new all-time low. For the first time since Optimism became a tradable asset, it dropped below $0.12, hitting a low of $0.114. It has since left the top 100 as its market cap takes a hit.
The post Bitcoin Cash Down by 17% in Two Days. How Low Until Rebound? appeared first on CoinTab News.
0
0

 한 곳에서 모든 암호화폐, NFT 및 DeFi 를 관리하세요
시작하는 데 사용하는 포트폴리오를 안전하게 연결하세요.


