Why Is The Crypto Market Down Today?

0
0

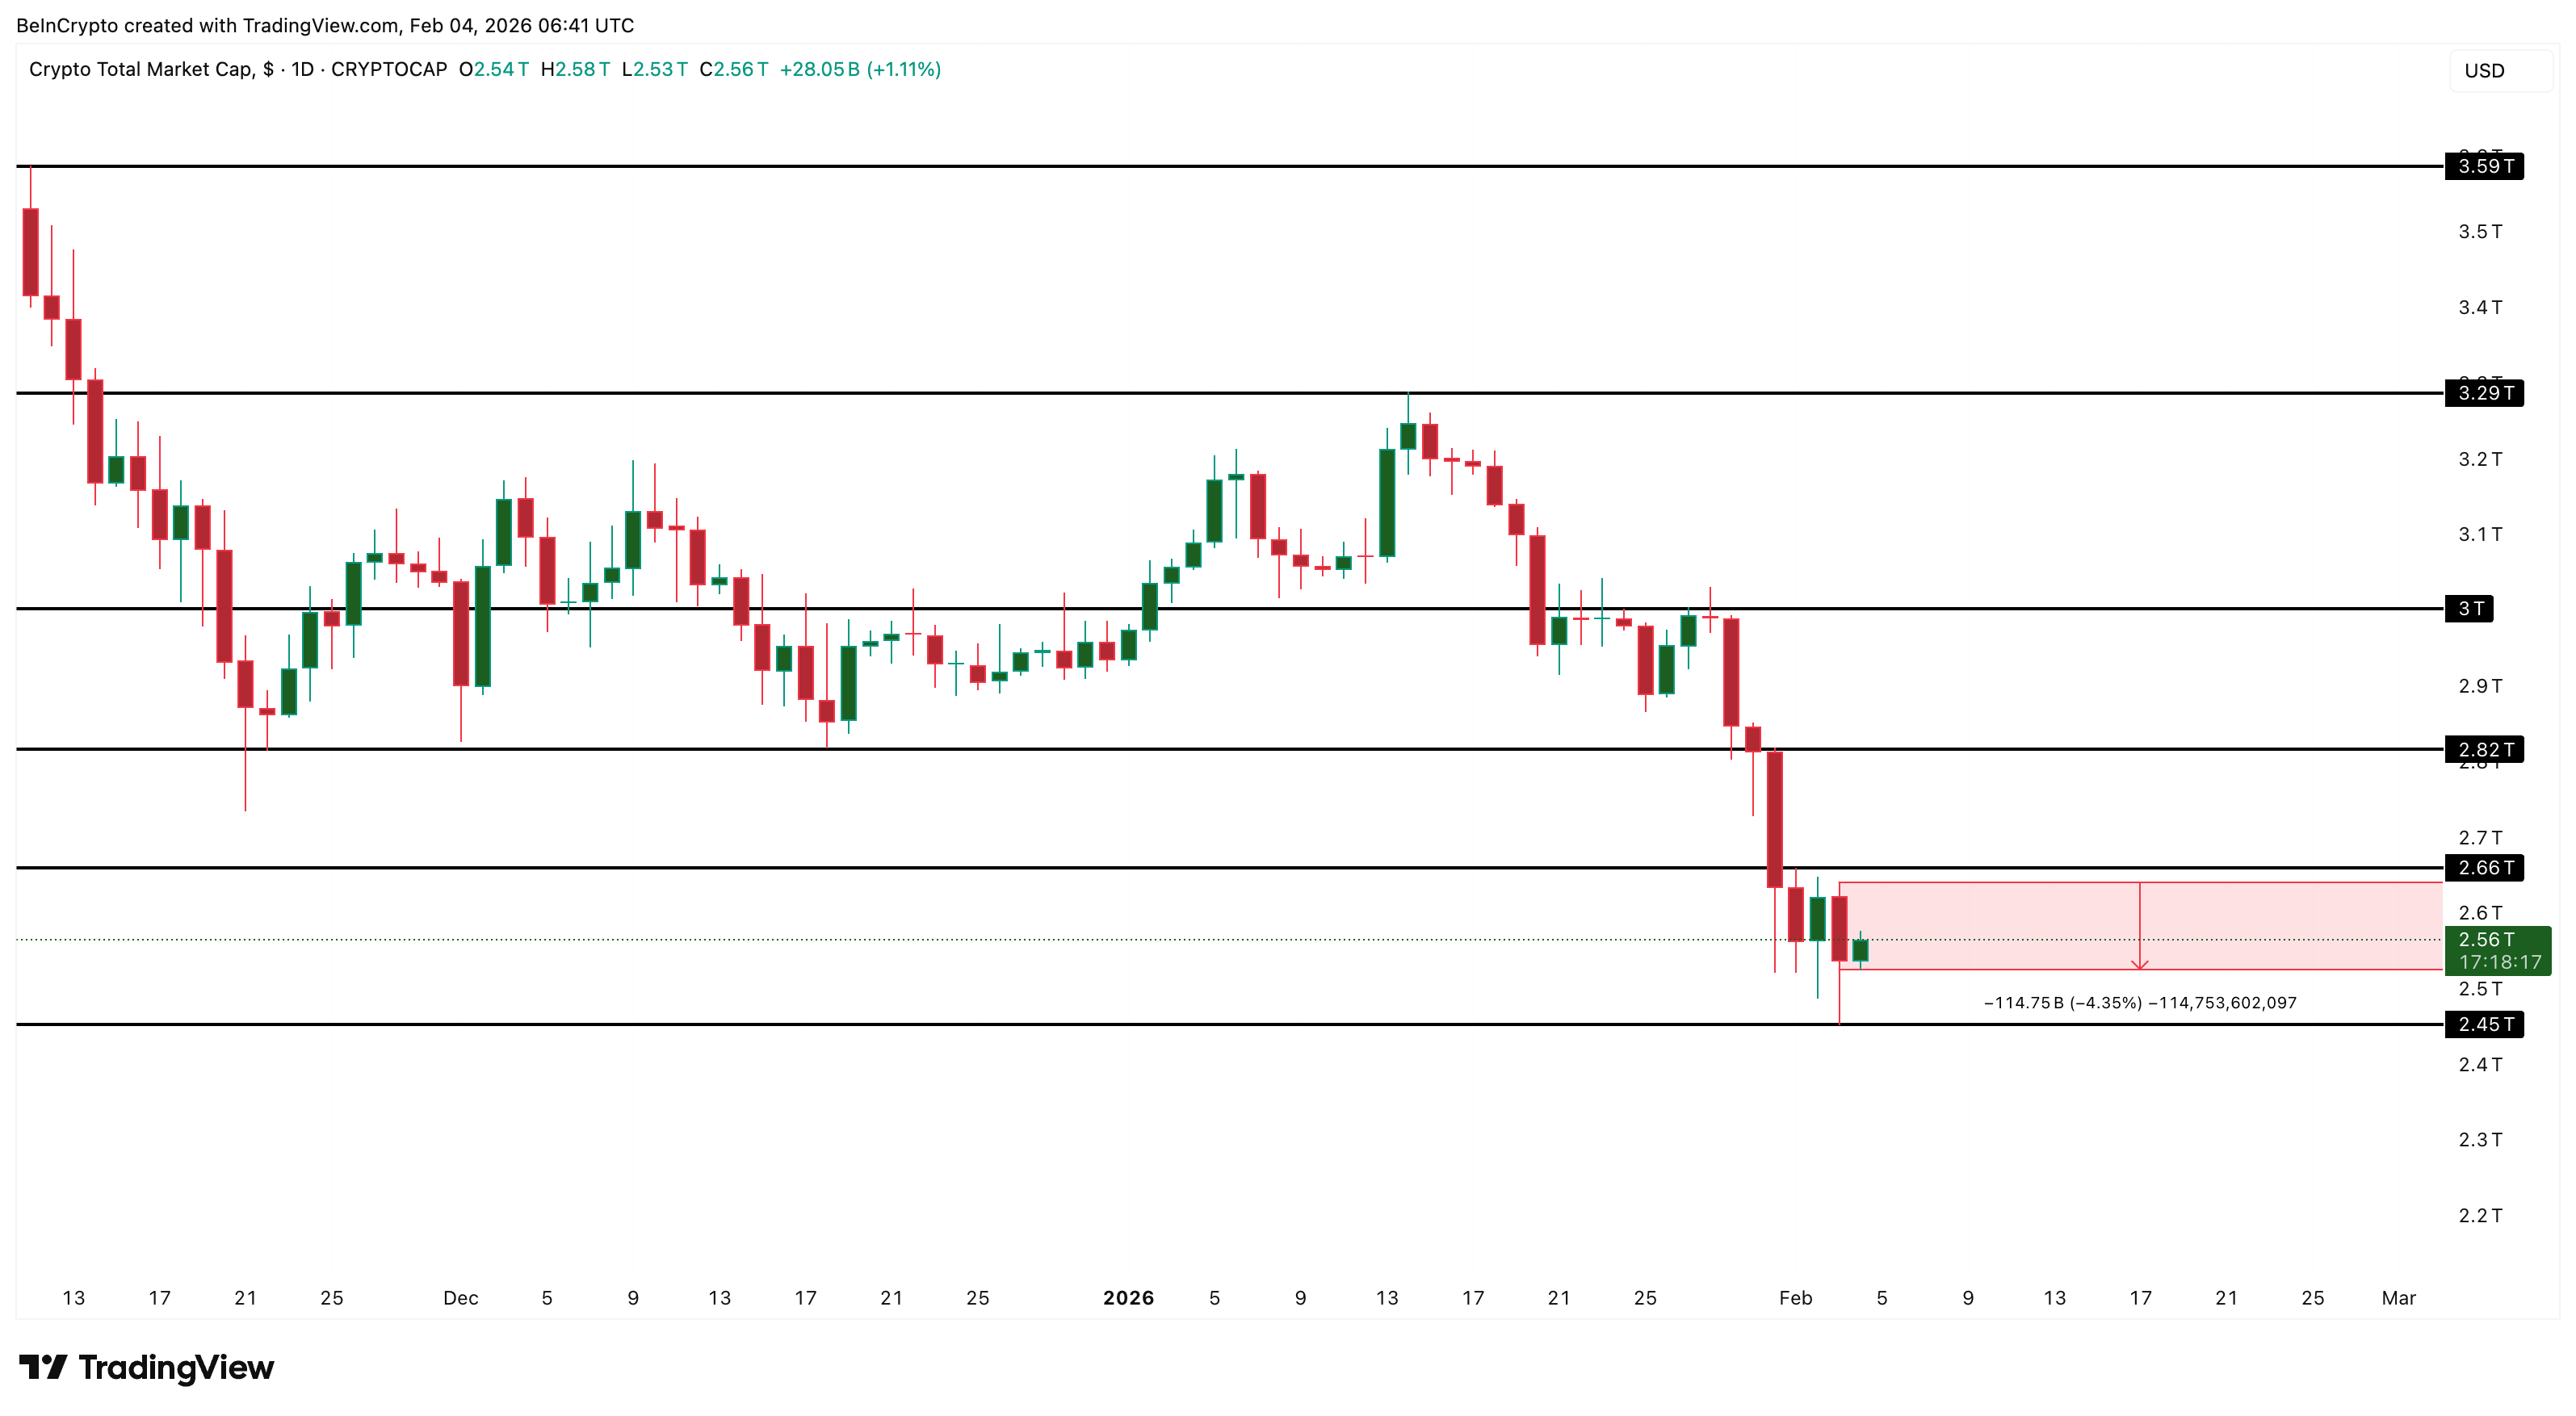
The crypto market slipped again on February 4, shedding nearly $115 billion from its high yesterday as selling pressure spread across major tokens. Bitcoin’s drop toward $72,900 triggered fresh liquidations, dragging the total market cap down to $2.45 trillion before a modest rebound to $2.56 trillion.
Even strong performers like HYPE fell sharply, down almost 12%. Rising leverage stress, macro uncertainty, and weak risk appetite are now keeping investors cautious.
In the news today:
- XRPL activates Permissioned Domains with 91% validator support, boosting institutional access, but offering no immediate catalyst for XRP’s weak price.
- Vitalik Buterin warns Layer 2 networks after active users fell nearly 50%, as Ethereum’s main chain regains dominance.
- Top trader 0x152e opens $71 million in leveraged shorts on ETH and SOL, signaling rising bearish positioning among smart money.
Liquidation Cascade Hits The Crypto Market, Again
The total crypto market cap faced sharp selling pressure over the past 24 hours, slipping to around $2.45 trillion before rebounding modestly toward $2.56 trillion at press time. The move wiped out nearly $114.75 billion from recent highs, reflecting a sudden shift toward risk-off sentiment across global markets.
Want more token insights like this? Sign up for Editor Harsh Notariya’s Daily Crypto Newsletter here.
 TOTAL Price Analysis: TradingView
The decline was first triggered by weakness in traditional assets as the pullback in major indices spilled into digital assets. As Bitcoin dipped below $73,000 overnight, selling pressure intensified across the market.
This initial drop was then amplified by a large liquidation cascade. Derivatives data shows that more than $704 million in leveraged positions were liquidated in the past 24 hours, with long traders taking the biggest hit. Bitcoin and Ethereum accounted for the bulk of these losses, as forced closures and stop-losses accelerated the sell-off in thin liquidity conditions.
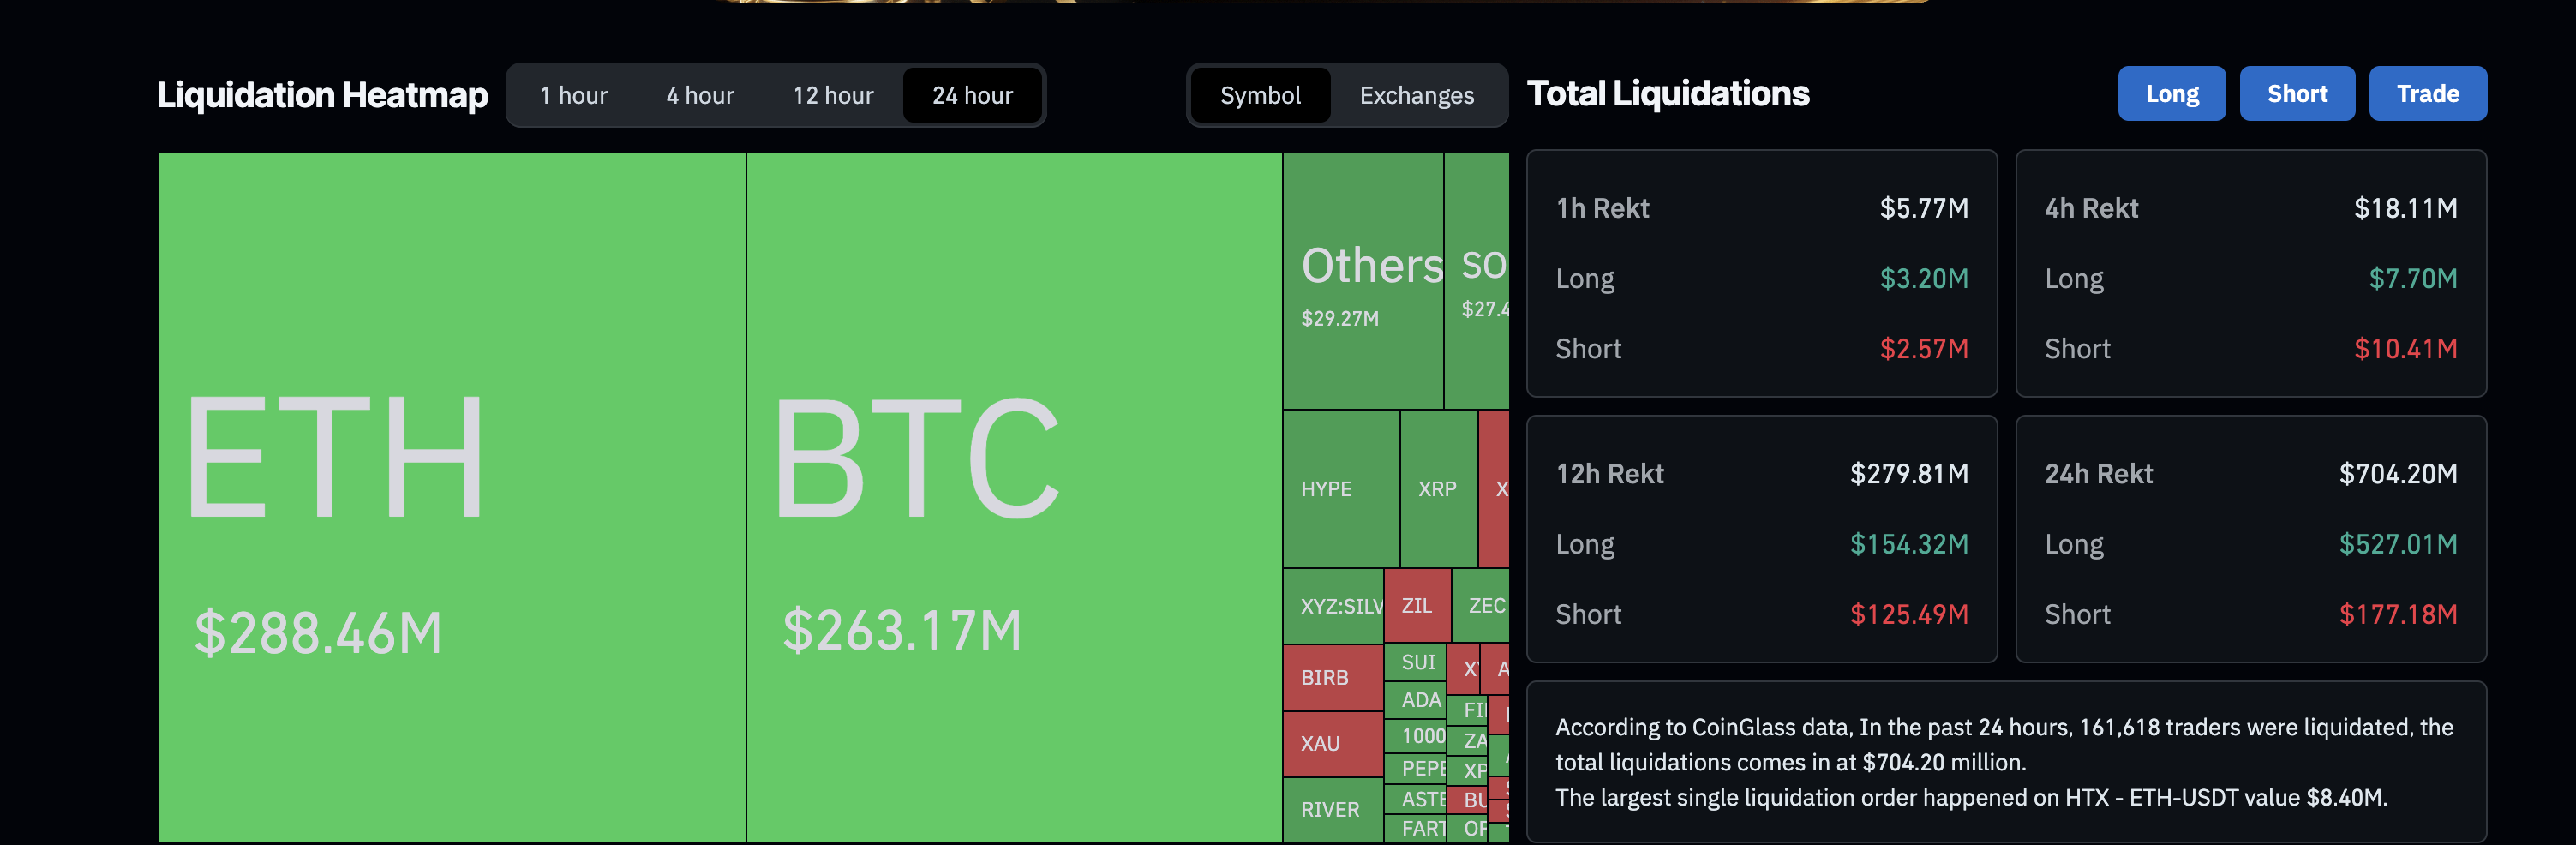 Liquidation Cascade: Coinglass
The liquidation wave pushed TOTAL below the key $2.50 trillion level and briefly toward the $2.45 trillion support zone. While buyers stepped in near this area, the rebound appears driven mainly by short-covering rather than fresh spot demand.
From a technical perspective, the market still faces major resistance. The first recovery barrier stands near $2.66 trillion, followed by a stronger zone around $2.82 trillion. The psychological $3 trillion level remains the key threshold for restoring confidence. Until leverage cools and spot inflows return, the crypto market remains vulnerable to further volatility driven by macro pressure and forced deleveraging.
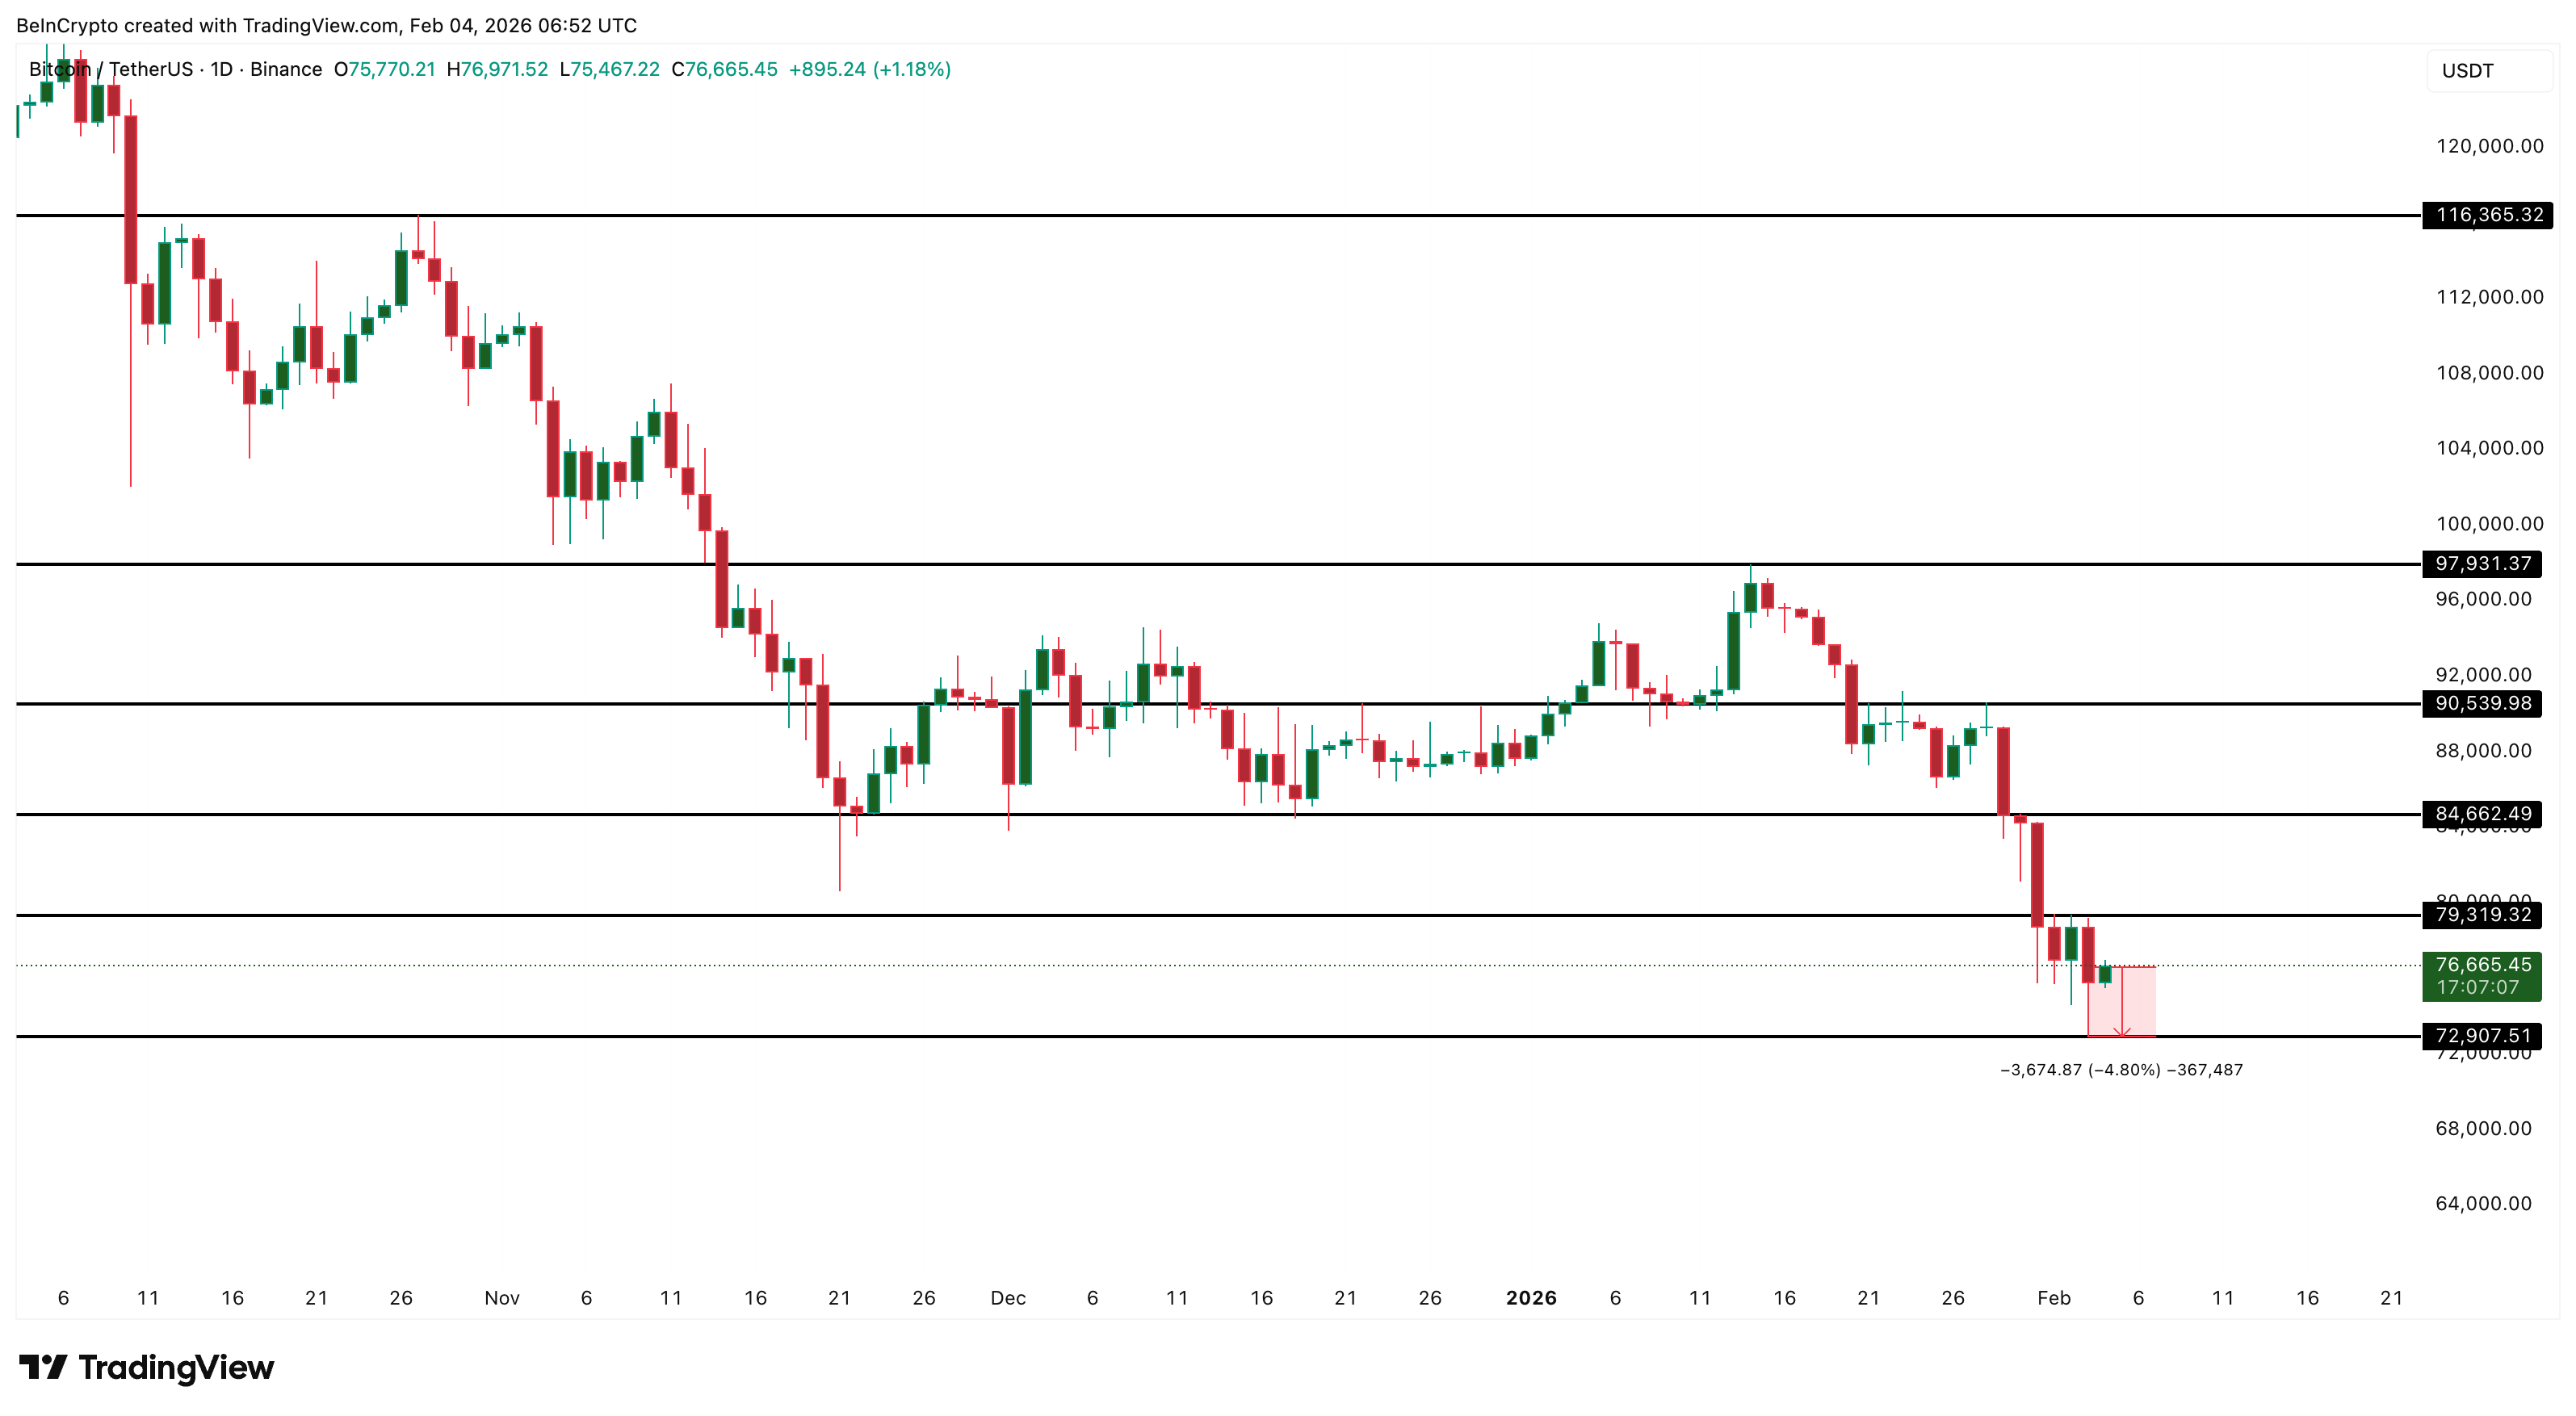
Bitcoin’s Slide Toward $72,900 Weakens Recovery Outlook
Bitcoin’s sharp drop toward the $72,900 zone played a central role in the broader market sell-off. The move marked its lowest level in months and triggered a wave of forced liquidations, as leveraged long positions were flushed out.
Derivatives data shows that more than $260 million in Bitcoin long positions were liquidated over the past 24 hours. As BTC slipped below key short-term support, stop-losses and margin calls accelerated selling, amplifying downside pressure in thin liquidity conditions.
At the time of writing, Bitcoin is trading near $76,660 after rebounding from its lows. While this bounce has eased immediate stress, it remains technically fragile. The first resistance sits near $79,310, where previous support has now turned into a supply zone.
 Bitcoin Price Analysis: TradingView
A stronger recovery would require a sustained move above $84,660. This level marks a major structural barrier and has capped recent rebound attempts. Until it is reclaimed, upside momentum is likely to remain limited.
On the downside, the $72,900 area remains critical. A decisive breakdown below this zone would reopen downside risk and could trigger another round of long liquidations, keeping Bitcoin vulnerable to further volatility.
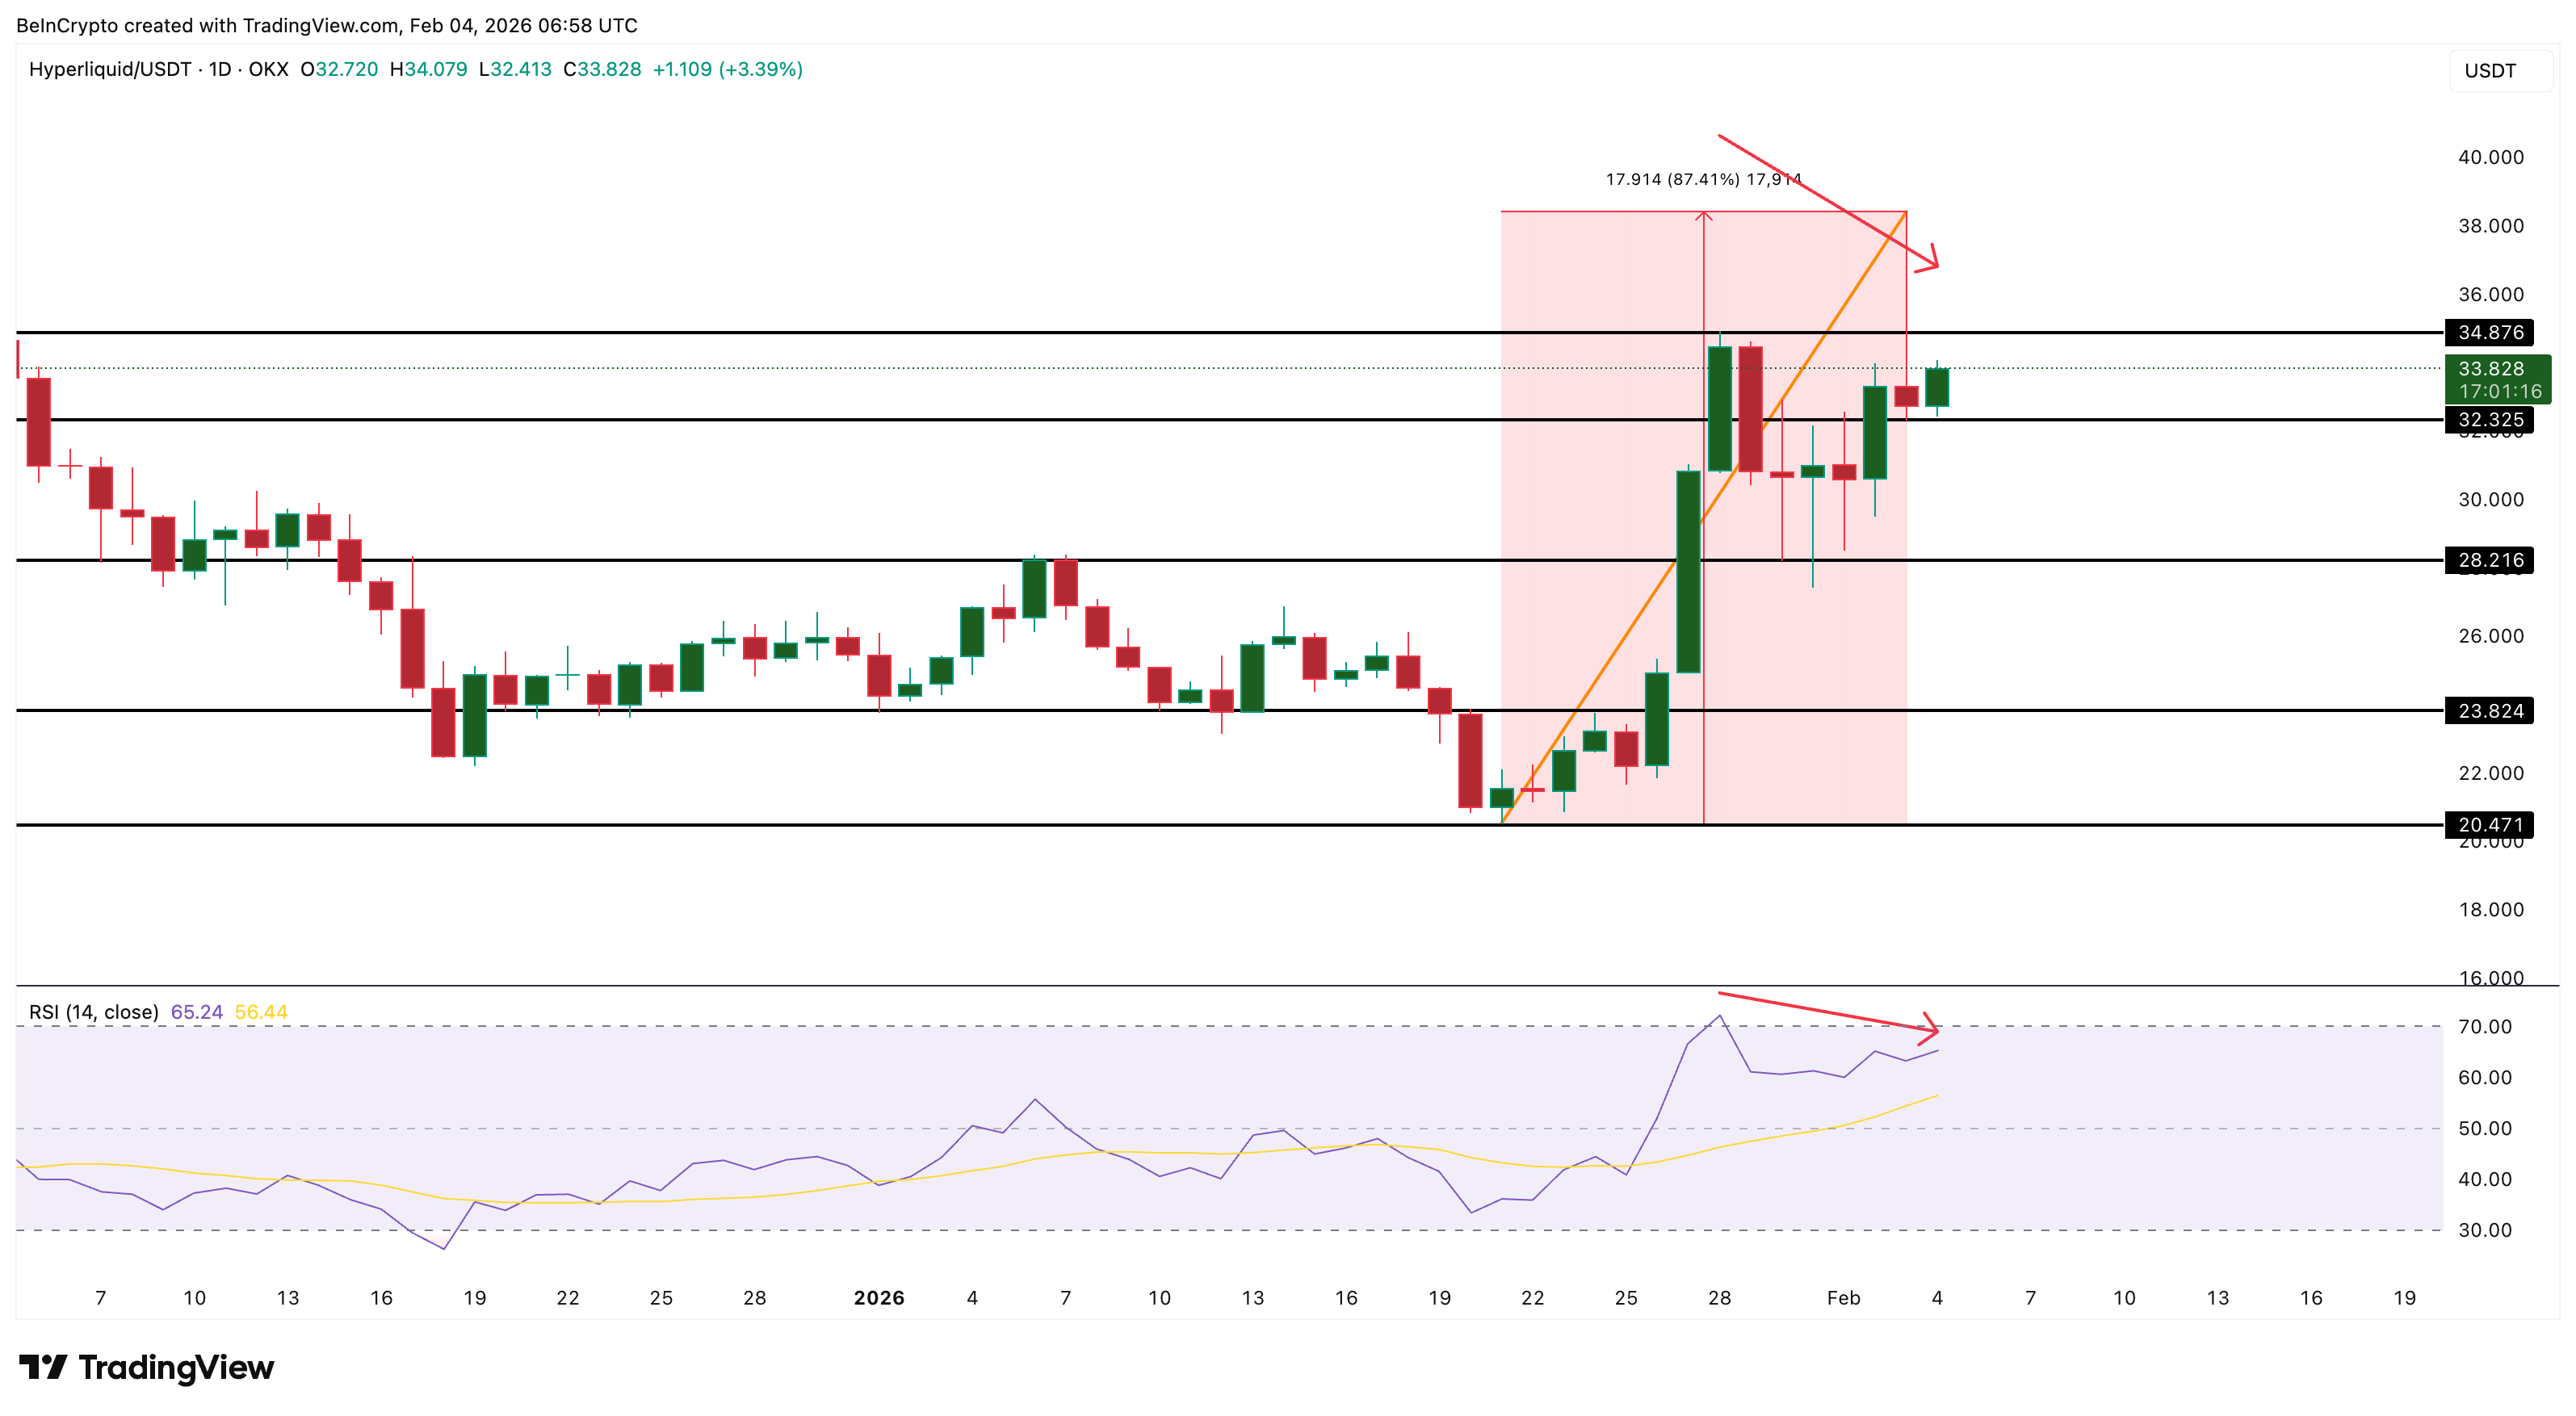
All ‘Hype’ Gone? Hyperliquid Cools After 87% Rally
Hyperliquid (HYPE) has emerged as one of the weakest major performers in the market over the past 24 hours, dropping nearly 12% despite remaining up around 25% over the past month. The pullback reflects growing caution after the token’s explosive 87% rally between January 21 and February 3.
The recent decline appears more like a cooling phase than a trend reversal. After such a sharp advance, periods of consolidation are common as short-term traders lock in profits and momentum resets.
Importantly, momentum indicators do not yet show clear signs of structural weakness. Between January 28 and February 4, price drifted lower while the Relative Strength Index (RSI), a momentum indicator, moved in line with it. This confirms that selling pressure is not diverging from momentum, suggesting controlled consolidation rather than panic-driven distribution.
From a technical perspective, HYPE needs to hold above the $32 level to keep its short-term structure intact. A dip toward $28 would still fit within a healthy consolidation range.
 HYPE Price Analysis: TradingView
However, a sustained break below $28 could expose the $23 support zone and shift sentiment toward a neutral-to-bearish outlook.
On the upside, a reclaim of $34 would signal renewed strength. With RSI still aligned to price, such a move could restart upside momentum once consolidation ends.
0
0


 Gestisci cripto, NFT e DeFi in un unico luogo
Connetti in sicurezza il portafoglio che usi per iniziare.

0
0

0
0

0
0
