
Shiba Inu Price Prediction: $SHIB Could Skyrocket If This Level Breaks

0
0

Shiba Inu launched back in August 2020 as a self-proclaimed "Dogecoin killer," and honestly, it built a massive community faster than almost any meme coin before it.
Today $SHIB trades at $0.00000451, down 3.3% over the past day. That's still a long way from its all-time high of $0.00008845, hit during the 2021 meme coin frenzy.
With a circulating supply of 589.24 trillion tokens, SHIB relies on sheer scale rather than a high unit price, which is why the number looks so small on paper.
This Shiba Inu price prediction looks at where the token stands today against that backdrop, not just where the charts point next.
$SHIB Live Market Data
$SHIB is currently trading at $0.00000451, down 3.3% on the day. The 24-hour range has stayed tight, between $0.00000448 and $0.00000474. 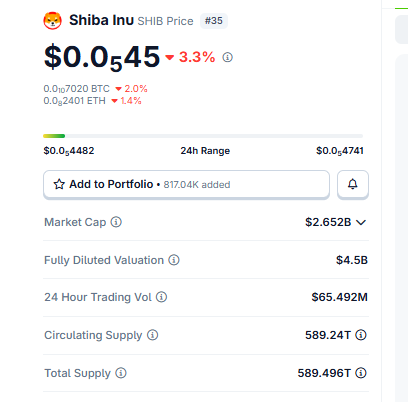
Source: $SHIB market cap data taken from Coingecko, data as of Aug 11, 2026. Figures may vary slightly across other tracking websites.
Market cap stands near $2.652B, with a fully diluted valuation of $4.5B given a total supply of 589.496T tokens against 589.24T circulating.
Trading volume over the last 24 hours came in at $65.492M, decent for a token this size.
Liquidation Data of Shiba Inu
Leverage traders got squeezed hard on the last day. Total liquidations hit $462.56K over 24 hours, and longs absorbed almost all of it at $434.00K against just $28.57K in shorts. 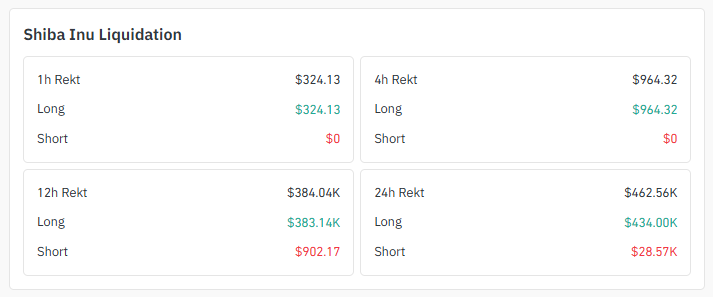
Source: liquidation data taken from Coinglass .
The 12-hour window tells the same story, $383.14K in long liquidations versus barely $902 on the short side.
That kind of lopsided wipeout usually means traders piled into longs too early during the dip, and the market punished the bet.
Exchange Volume of $SHIB
OKX leads Shiba Inu trading volume right now at $16.63M, followed by LBank at $9.46M and MEXC at $6.57M. 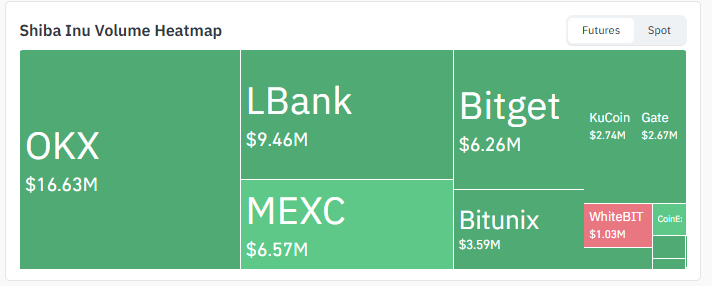
Source: Volume heatmap data taken from Coinglass.
Bitget adds $6.26M, while Bitunix, KuCoin, Gate, and WhiteBIT contribute smaller but steady volume.
Spread across this many venues, liquidity looks healthy enough to support either breakout scenario without major slippage.
Shiba Inu News Today
On-chain watchers flagged a sharp jump in Shibarium's Layer 2 activity this week.
Daily transactions hit 4,480, a 507% spike from just 738 the day before, and the highest count in a month. 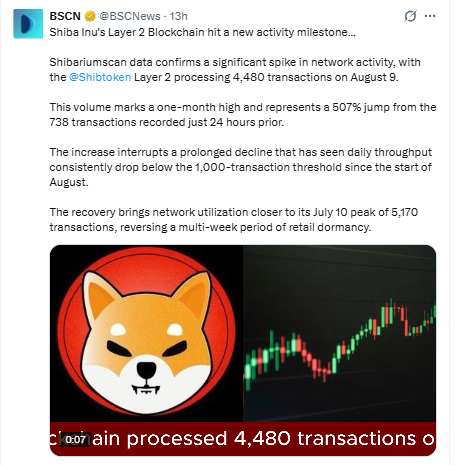
Source: Data Taken From @BSCNews, X Account.
That follows weeks of throughput sitting below 1,000 transactions a day since early August.
The recovery brings usage close to the network's July 10 peak of 5,170 transactions, hinting retail users may be returning after a quiet stretch.
Rising Layer 2 usage doesn't guarantee a price move, but it's the kind of fundamental tailwind that can support a bullish Shiba Inu price prediction if chart levels cooperate.
Key Takeaways
-
SHIB is trading around $0.00000451, down 3.3% in the last 24 hours.
-
On the 4H chart, price sits inside a descending channel, and a breakout above $0.00000506 could open the door toward $0.00000540.
-
The daily chart shows a symmetrical triangle nearing its apex, a classic setup before a bigger move.
-
Longs took the bigger hit lately, over $434K in long liquidations in the past 24 hours alone.
-
Shibarium's Layer 2 activity just spiked 507% day-on-day, a sign retail interest may be waking up.
Technical Analysis of $SHIB
4-Hour Chart Analysis for Shiba Inu Price Prediction
The 4H chart has SHIB boxed inside a descending channel.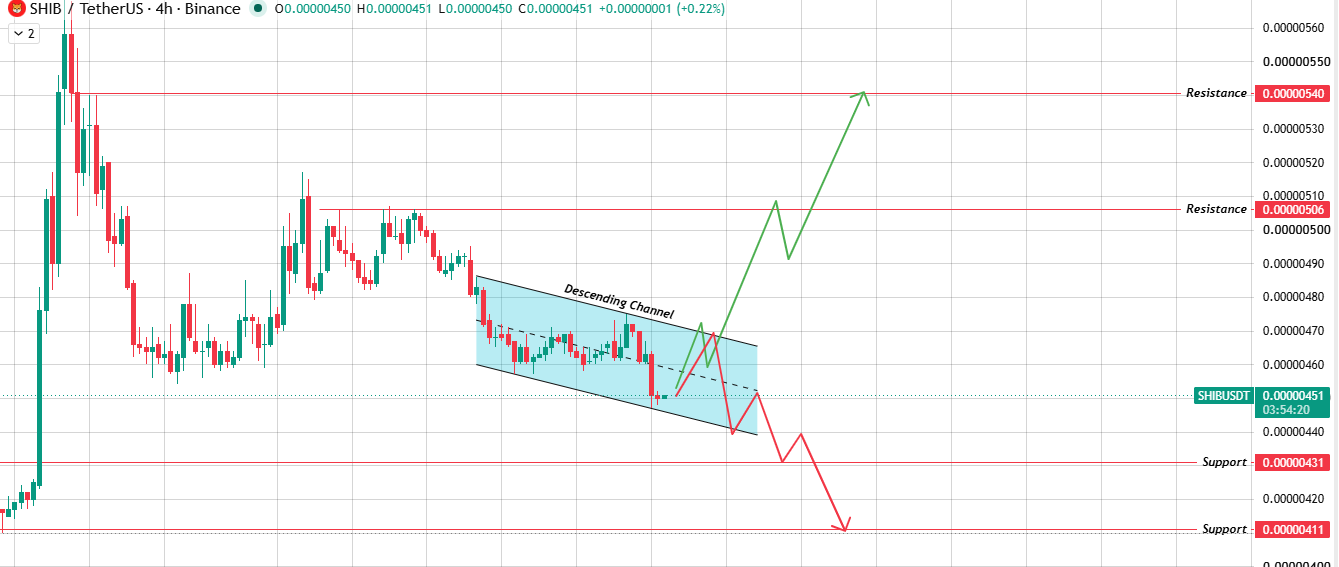
Source: Chart Taken From TradingView.
If the price pushes to the upper boundary and breaks it with strength, the next stop is resistance at $0.00000506, then $0.00000540.
But if that boundary rejects price instead, expect a slide back to the lower boundary.
A breakdown there, backed by volume, sends SHIB toward $0.00000431 and then $0.00000411.
Daily Chart Analysis for Shiba Inu Price Prediction
On the daily chart , a symmetrical triangle is squeezing the price near the apex. 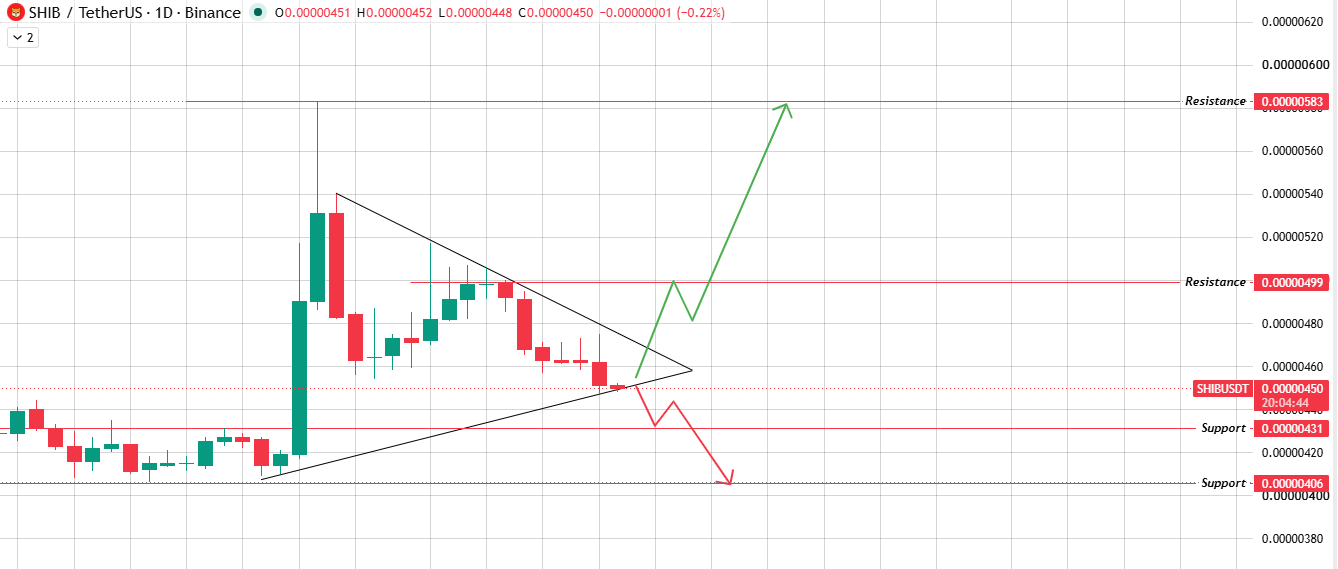
Source: Chart Taken From TradingView.
A volume-backed break above the falling trendline of the triangle levels $0.00000499 first, then $0.00000583.
A break below the rising trendline flips things bearish, with $0.00000431 and $0.00000406 as next levels.
Both setups agree on one thing: SHIB needs a decisive move soon.
Bull / Base / Bear Case
Glossary
Descending Channel: Price moves lower here, bouncing between two downward-sloping lines until it breaks one side.
Symmetrical Triangle: Two converging trendlines squeeze price into a narrowing range, usually right before a sharp move.
Liquidation: This happens when an exchange forcibly closes a leveraged position because the trader ran out of margin.
Support Zone: Think of it as a price floor where buying pressure has historically stepped in.
Resistance Level: The opposite of support, a ceiling where selling pressure tends to cap upward moves.
Methodology
Levels used in this Shiba Inu price prediction come directly from TradingView chart data on the 4H and 1D timeframes.
Liquidation and volume figures are sourced from Coinglass. No price levels are extrapolated beyond what appears on the charts.
Disclaimer: This article is for informational purposes only and should not be treated as financial advice. Cryptocurrency markets are highly volatile, and prices can change quickly. Always do your own research and consult a financial advisor before making investment decisions.
0
0


 Gerencie todo seu criptograma, NFT e DeFi de um só lugar
Conecte com segurança o portfólio que você está usando para começar.

0
0