PlanB’s Stock-To-Flow model off by $130k, Bitcoin trades below trend since 2021

0
0

PlanB’s Stock-to-Flow (S2F) model, known for predicting Bitcoin’s price based on scarcity, has faced scrutiny as the digital asset’s value has remained below the model’s expectations since 2021. The S2F model, which correlates the increasing scarcity of Bitcoin due to halving events with price appreciation, suggested a significantly higher price than the actual market value over the past few years. As of recent data, the discrepancy has reached approximately $130,000, raising questions about the model’s reliability in the face of unpredictable market conditions. The model predicts a price of around $180,000 at present, while Bitcoin remains just above $50,000.
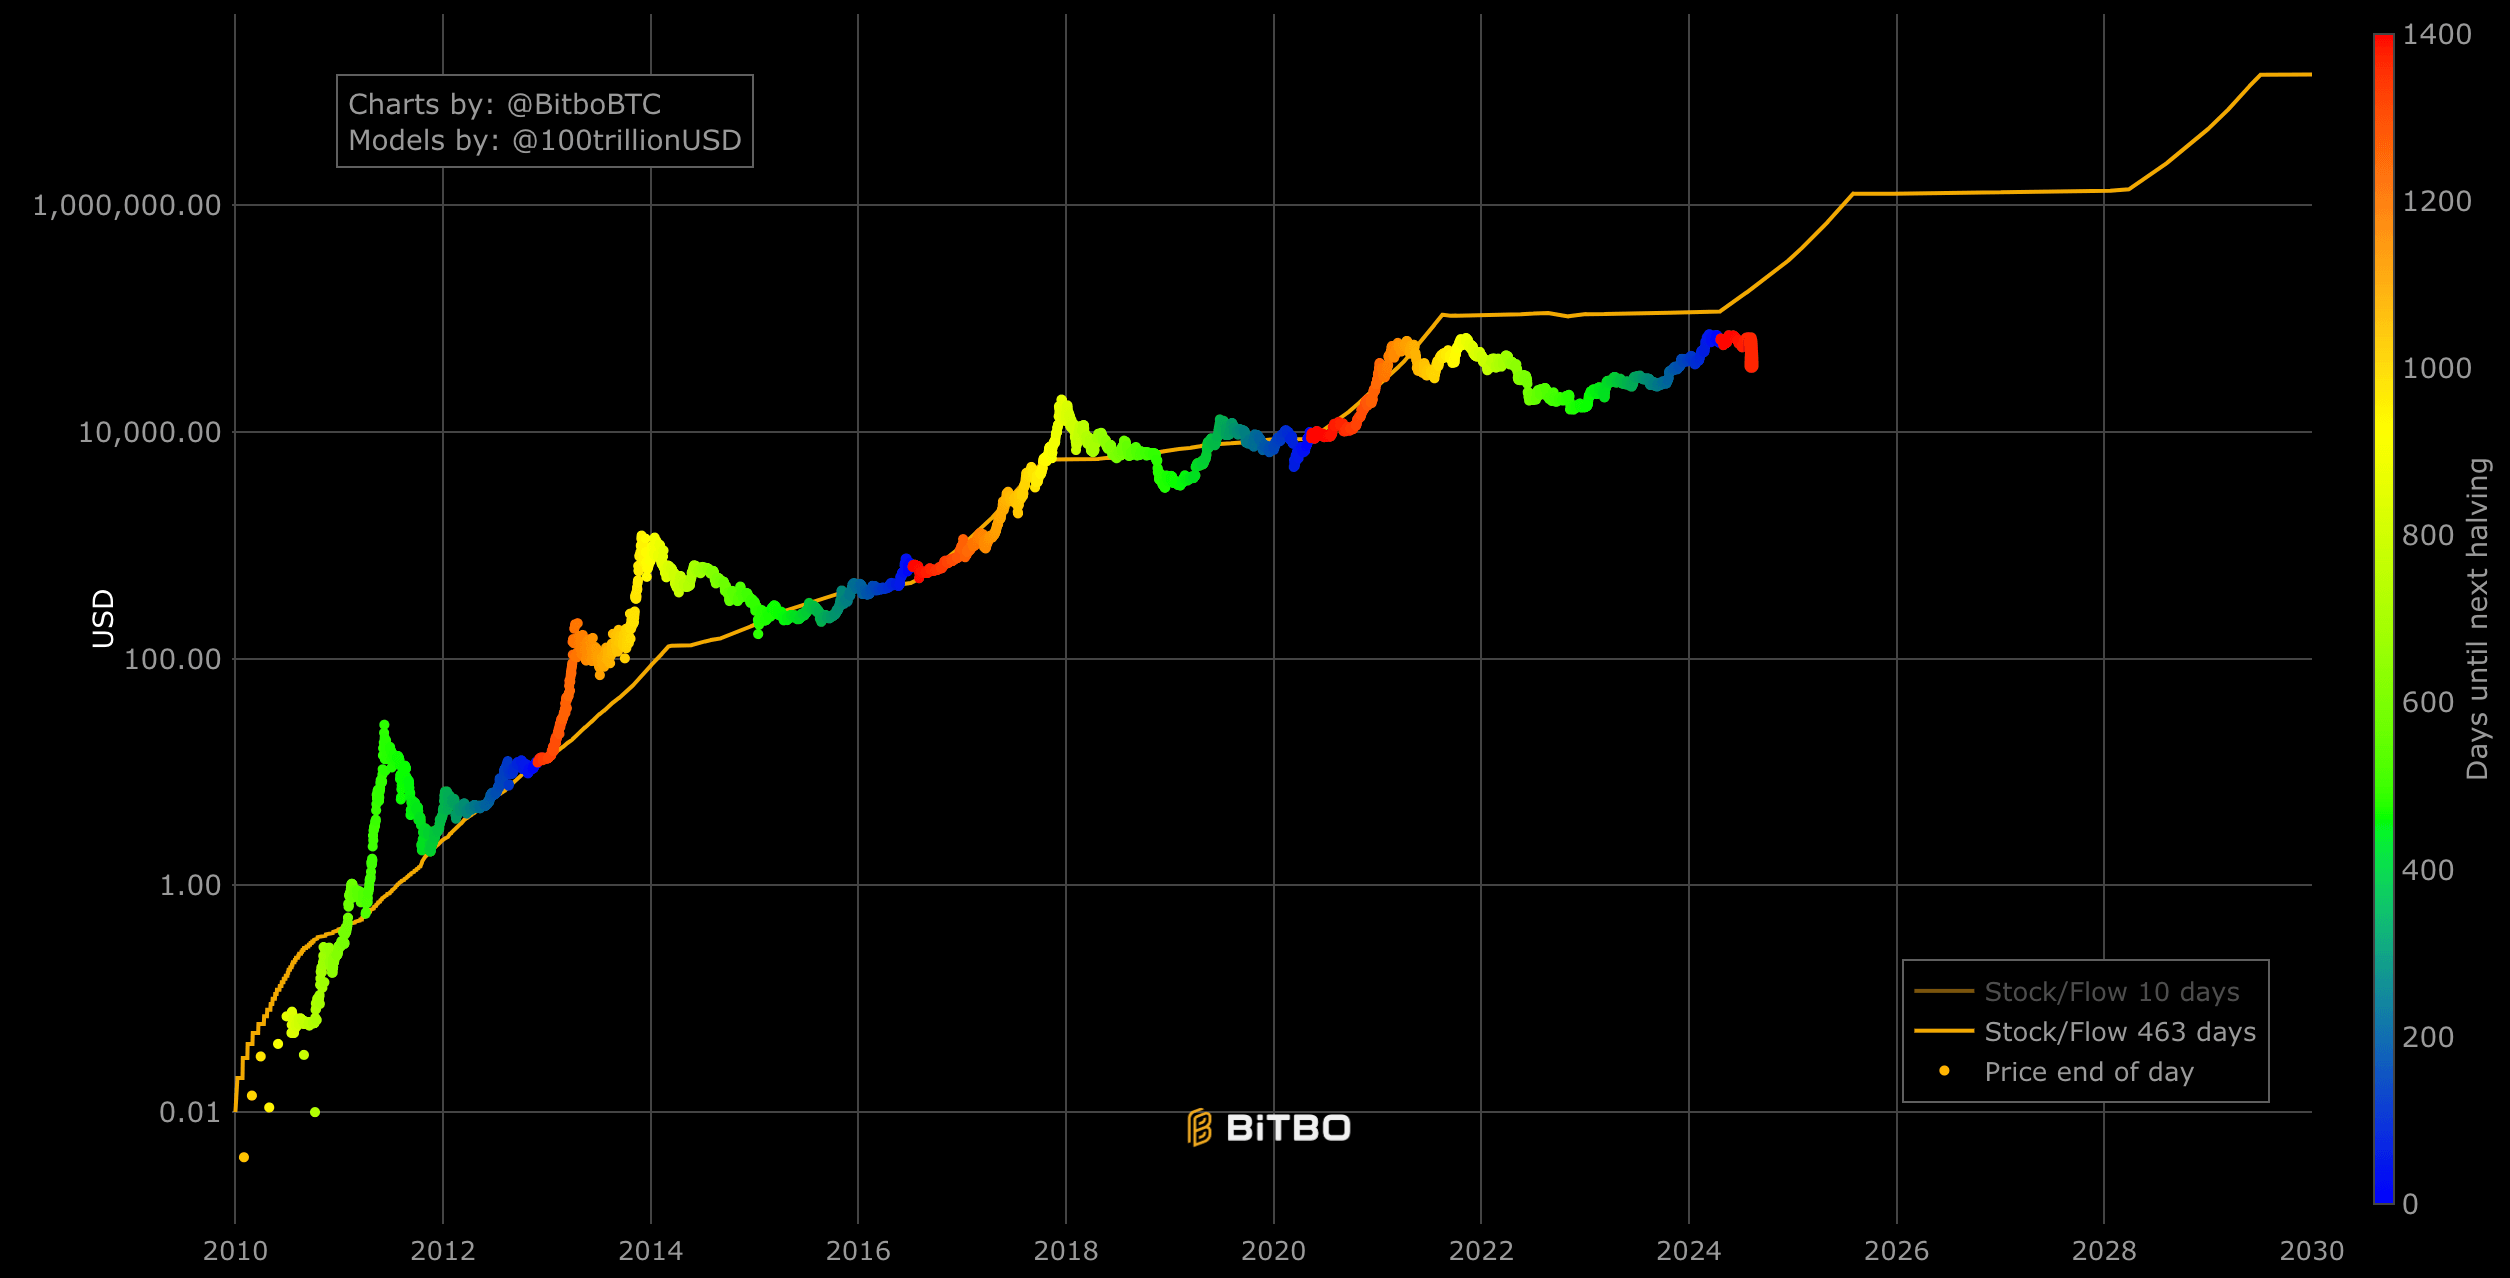
The S2F model operates on the principle that as the flow of new bitcoins decreases, the existing stock becomes more valuable, thus driving up the price. Until 2021, this model historically aligned well with significant price movements, especially around halving events. However, the sustained divergence observed since 2021 indicates a break from this pattern.
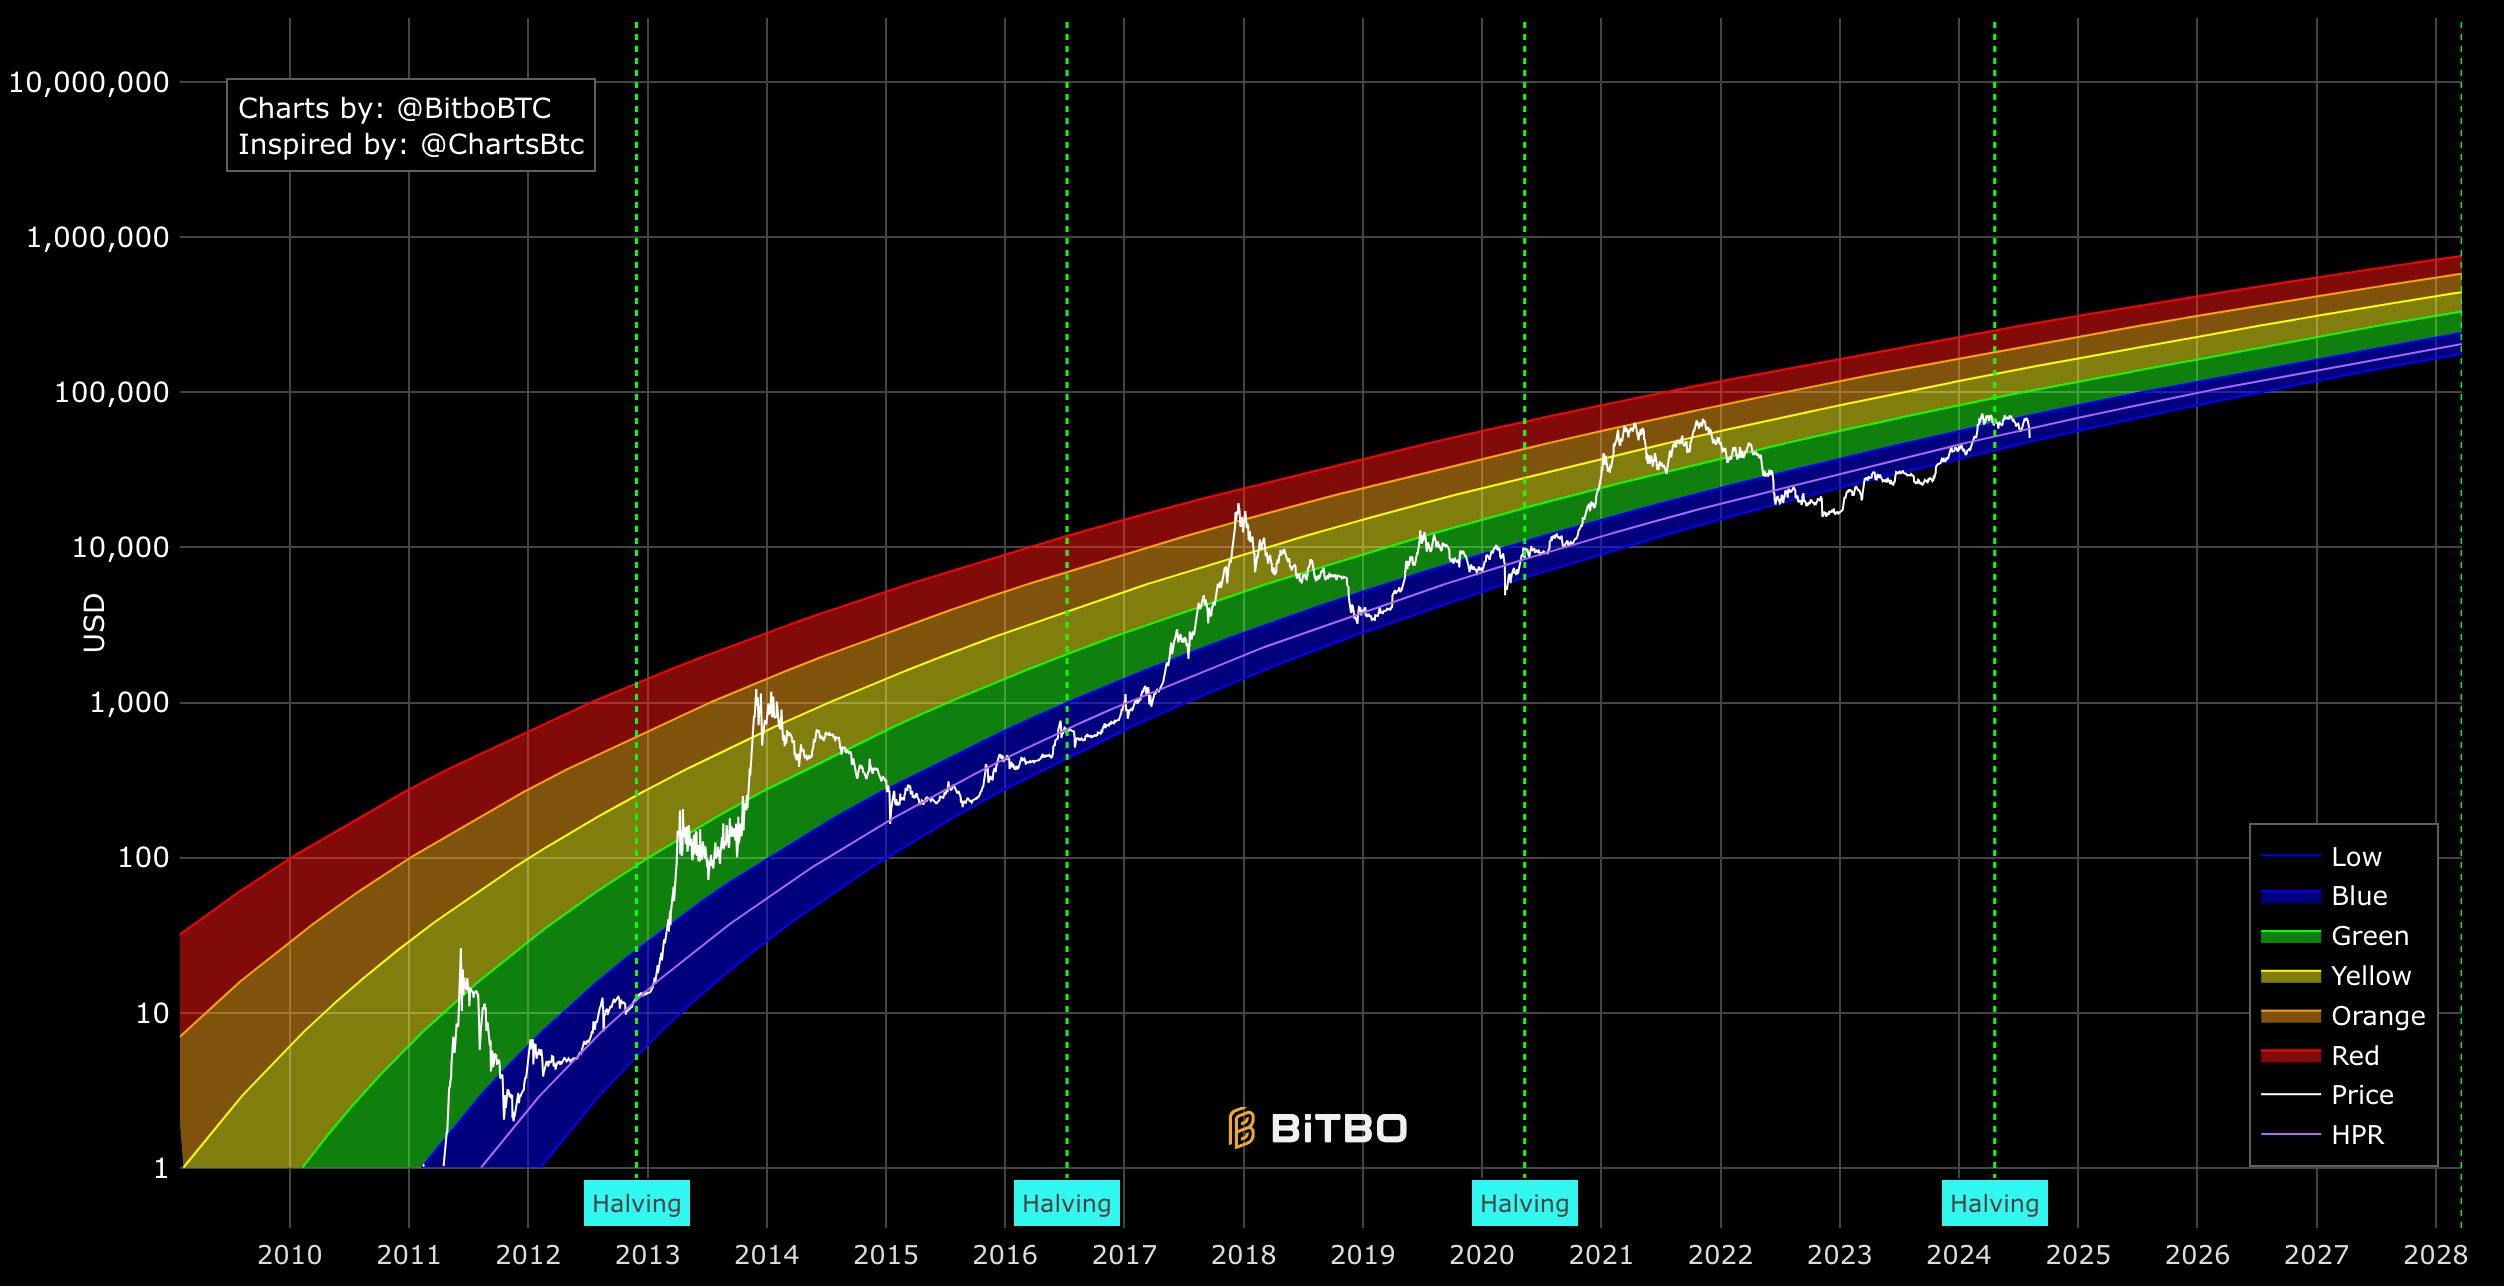
In contrast to the S2F model, other analytical tools, such as the Rainbow Price Chart and Power Law Model, have provided different perspectives on Bitcoin’s valuation. The Rainbow Chart, which categorizes price levels by market sentiment bands ranging from “Low” to “High,” has depicted Bitcoin primarily trading within moderate bands since 2022. This indicates a period of stable growth without reaching speculative peaks, which the S2F model might have overestimated. Bitcoin is moving toward the lower bound of the rainbow chart, which it broke throughout 2022 and 2023. At $50,000, Bitcoin is $220,000 below its upper limit.
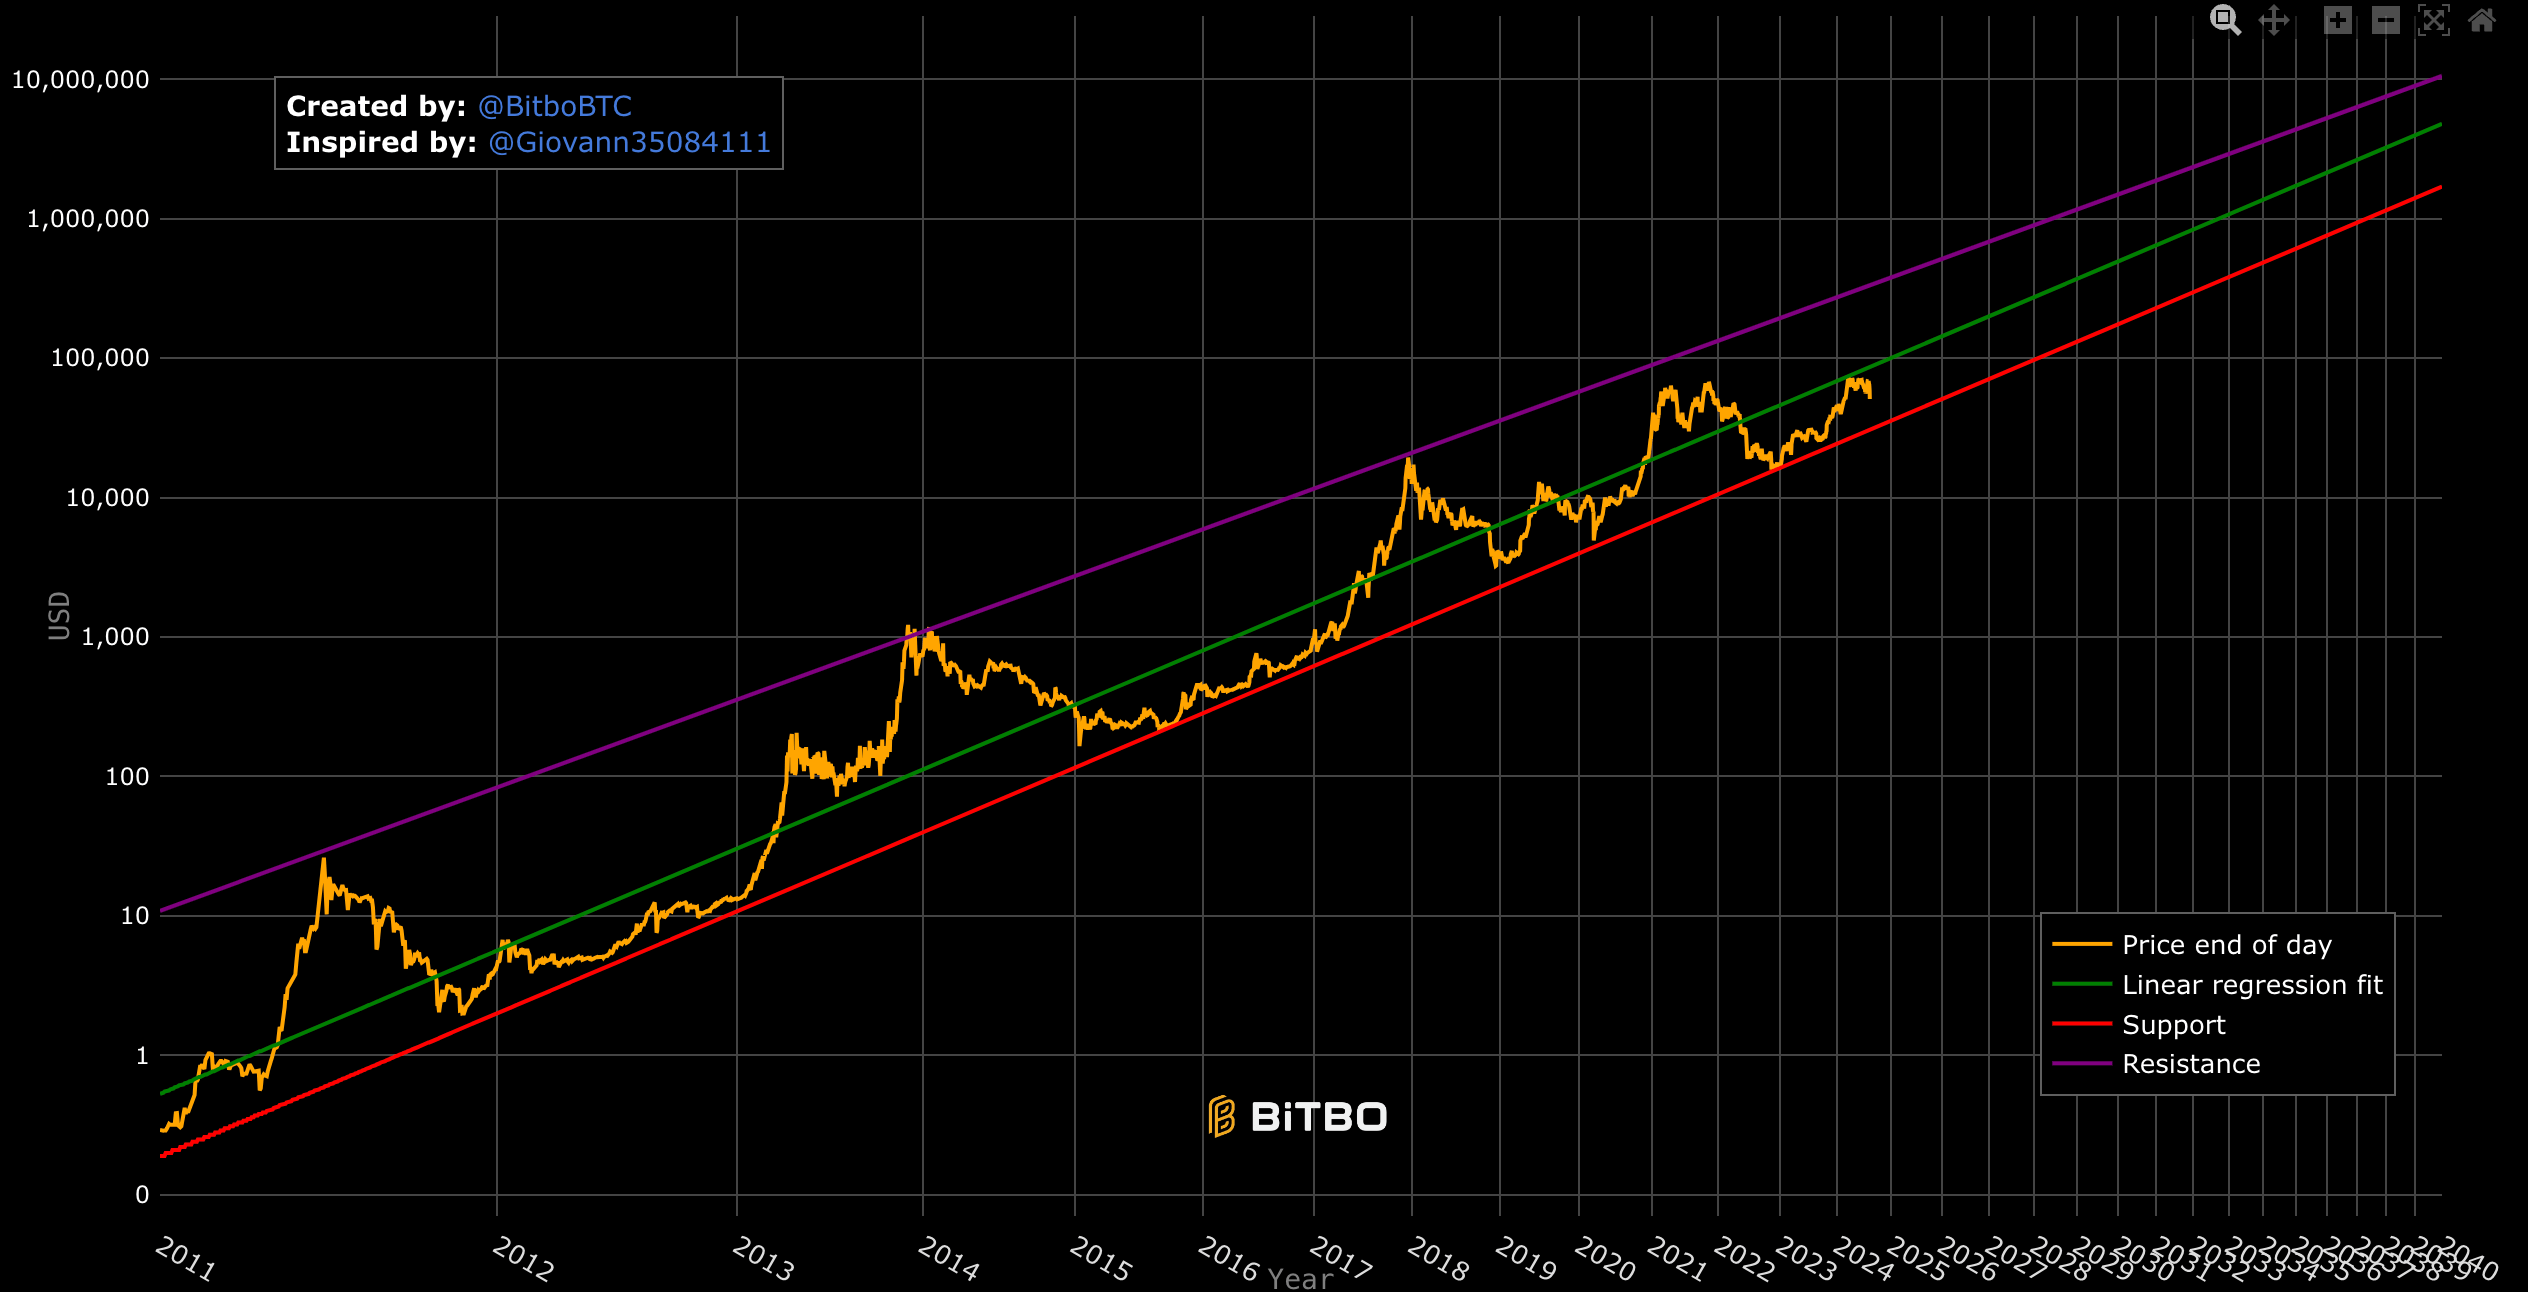
The power law model is a statistical model that describes relationships between quantities where one quantity varies as a power of another. The Bitcoin power law model refers to the relationship between the price and time. It projects a long-term price channel with defined support and resistance levels. Bitcoin’s recent price movements have adhered more closely to this model’s projections, maintaining an upward trajectory within the channel but frequently encountering higher-level resistance.
According to the power law model, Bitcoin is still well within normal limits and just $40,000 below the regression fit or fair price.
These discrepancies highlight the complexity of predicting Bitcoin’s price. While the S2F model has been a popular framework for anticipating market trends, its perceived shortcomings suggest that it may not fully account for the diverse and dynamic factors influencing Bitcoin’s value. The deviation of up to $130,000 from the model’s forecast illustrates the need for a more nuanced understanding of market forces, including the impact of investor sentiment, technological developments, and broader economic conditions. Further, the power law, which also appears in nature and other man-made phenomena, seems to align more closely with Bitcoin, a currency correlated directly to its energy usage.
The post PlanB’s Stock-To-Flow model off by $130k, Bitcoin trades below trend since 2021 appeared first on CryptoSlate.
0
0


 Administra todas tus criptomonedas, NFT y DeFi desde un solo lugar
Para comenzar, conecta de forma segura el portafolio que estés utilizando.


