
Stacks Price Prediction: Can STX Rally Back Toward $1?

0
0

Stacks traders woke up to a chart most people had stopped watching. After months of grinding lower inside a shrinking wedge, $STX broke out with a burst of green candles and volume that finally matched the moment.
This Stacks price prediction looks at what the breakout, the derivatives data, and the daily chart are actually saying about where $STX could head next, without telling anyone to buy, sell, or hold.
What Is Stacks (STX) Market Cap and Trading Volume Right Now?
According to CoinMarketCap, STX is trading at $0.2094, up 33.76% in the past 24 hours. The market cap stands at $380.14 million, also up about 33.75%, while the unlocked market cap is $334.65 million.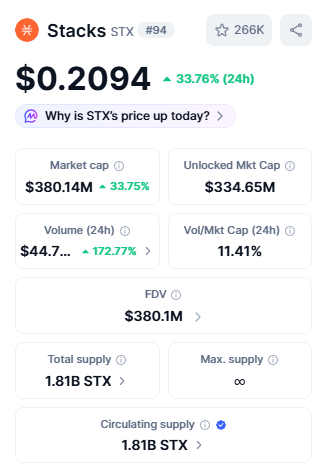
Fully diluted valuation matches the market cap at $380.1 million, since Stacks has no maximum supply cap.
Circulating and total supply are both listed at 1.81 billion $STX. Trading volume over the past day jumped to $44.7 million, up 172.77%, pushing the volume to market cap ratio to 11.41%, suggesting the rally is backed by genuine trading activity rather than thin order books.
What Do Coinglass Derivatives and Performance Metrics Show for STX?
Coinglass data adds more depth to the move. $STX price performance shows gains of 6.85% over 4 hours, 33.54% over 24 hours, and 71.29% over 7 days, alongside a 23.72% climb over 30 days, though the 90-day (-15.66%), 180-day (-14.36%), year-to-date (-14.67%), and 1-year (-68.12%) windows remain negative, with the all-time change at -9.44%.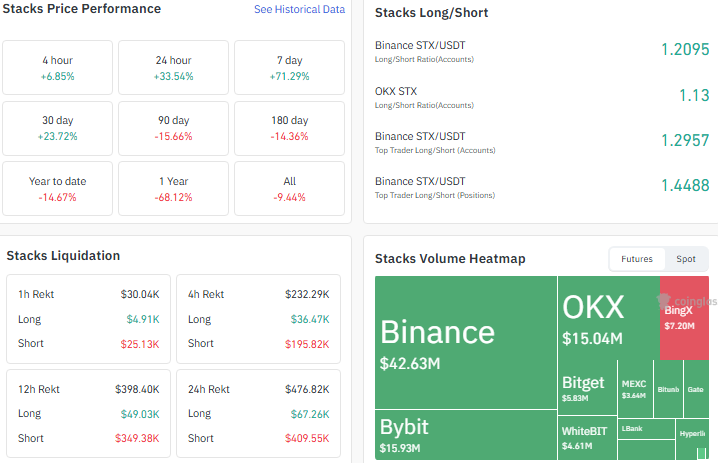
Long/short account ratios lean toward longs on Binance (1.2095) and OKX (1.13), with Binance top traders even more skewed at 1.2957 by accounts and 1.4488 by positions.
Liquidations hit 476.82K over 24 hours, with short liquidation at 409.55K, far outpacing longs ($67.26K).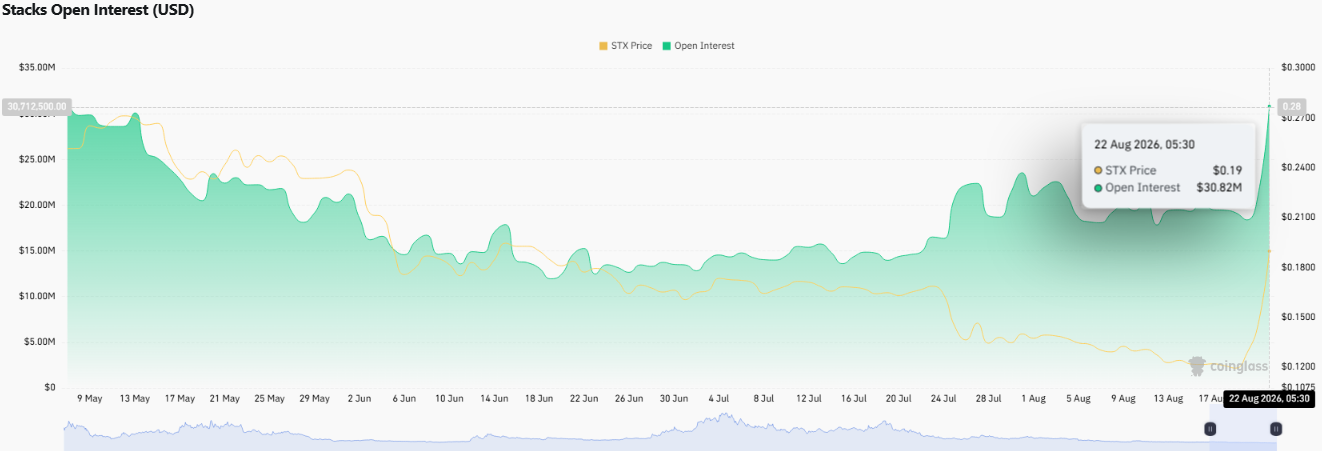
Open interest has surged to $30.82 million alongside the rally. Futures volume is led by Binance (15.93M) and OKX ($15.04M).
What Does the STX Daily Chart Pattern Reveal?
On the TradingView daily chart, STX had been carving out a multi-week descending wedge, a pattern that typically resolves with a sharp move once broken.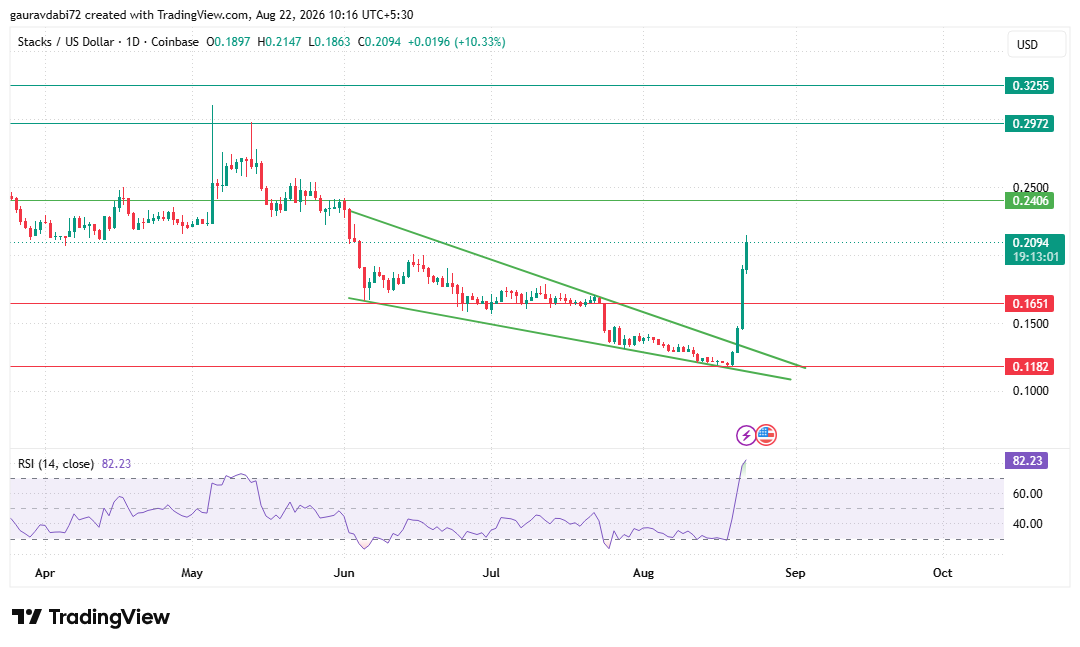
That is exactly what happened: $STX broke above the wedge's upper trendline on strong volume, clearing resistance with a series of large green candles.
The daily candle opened at $0.1897, reached a high of $0.2147, dipped to a low of $0.1863, and is running at $0.2094
The 14-period RSI has jumped to 82.23, deep into overbought territory, reflecting how fast buyers have stepped in over the past sessions.
What Are the Key Resistance and Support Levels for STX?
Immediate resistance sits at $0.2406, a level that also marks the top of the recently broken wedge structure.
Beyond that, the next hurdles are $0.2972 and $0.3255. If buying pressure stays aggressive, a test of the $0.3255 area could come into view relatively quickly.
On the downside, $STX support and resistance levels put the floor at $0.1651 and then $0.1182, the lower boundary of the broken wedge.
Should momentum cool and RSI move back toward neutral, $STX could spend time consolidating within the $0.1651 to $0.2406 range before its next directional move.
Is STX Bullish or Bearish After This Breakout?
Market analysts note that the combination of a confirmed wedge breakout, expanding volume, and heavier short-side liquidations points to near-term bullish momentum for STX.
An RSI reading above 80 also raises the risk of a short-term pullback or consolidation before the next leg higher.
Analysts weighing in on this STX price prediction add that the broader multi-month and yearly trend remains negative, meaning the current move is being read as a recovery attempt within a longer downtrend rather than a confirmed trend reversal just yet.
What Is the Stacks Price Prediction for the Coming Weeks?
As per the CoinGabbar analyst, a continuation of the current volume and buyer aggression could see this $STX price prediction scenario play out toward $0.2406, then $0.2972, and eventually $0.3255 if momentum holds.
A neutral scenario, where RSI cools without a breakdown, points to consolidation between $0.1651 and $0.2406.
A bearish scenario would need a daily close back below $0.1651, which would put the $0.1182 support back in focus and cast doubt on the wedge breakout.
This Stacks price prediction is based purely on the chart structure and derivatives data available at the time of writing and is not a recommendation to buy, sell, or hold $STX.
Disclaimer: This article is for informational purposes only and does not constitute financial, investment, or trading advice. Cryptocurrency markets are highly volatile, and prices can change rapidly. Readers should conduct their own research and consult a qualified financial advisor before making any investment decisions.
0
0

 한 곳에서 모든 암호화폐, NFT 및 DeFi 를 관리하세요
시작하는 데 사용하는 포트폴리오를 안전하게 연결하세요.


