
Audiera Price Prediction: $BEAT Burn Rise, Trendline Retest Next Move?

0
0

$BEAT is having a wild week, and everyone in the space is talking about it. Audiera has been turning heads by blending AI-powered music creation, rhythm gameplay, and a massive built-in audience from its legacy Audition roots into one buzzing Web3 platform.
This Audiera Price Prediction dives into everything driving the hype around $BEAT right now and what could come next. Keep reading to see how far this momentum could carry the token."
BEAT Price Today: Market Overview
| Metric | Value |
|---|---|
| Price (BEAT/USD) | $2.8000 |
| 24h Change | -21.35% |
| Market Cap | $871.58M |
| Unlocked Market Cap | $871.58M |
| 24h Trading Volume | $76.8M (+149.36%) |
| Volume/Market Cap | 8.43% |
| Fully Diluted Valuation | $2.81B |
| Liquidity/Market Cap | 0.39% |
| Circulating Supply | 309.26M BEAT |
| Total Supply | 1B BEAT |
| Max Supply | 1B BEAT |
Source: Data from CoinMarketCap as of 25/07/2026. Figures may vary slightly across other tracking websites.
What Audiera Actually Does
Audiera is a Web3 entertainment project on BNB Chain that reimagines Audition, a rhythm and dance game franchise with roughly 600 million legacy users, as a decentralized platform.
The ecosystem combines rhythm gameplay, AI-assisted music creation with virtual idols, and what the project calls an "agent-native participation economy," where autonomous AI agents hold defined roles and wallets alongside human users.
BEAT is the token that powers rewards, in-platform purchases, voting, and the revenue-funded buyback-and-burn cycle.
Latest Update: Weekly Burn and Revenue
Audiera's official account confirmed its latest revenue and burn cycle for July 20-27, 2026: 799,750 $BEAT was burned this week, funded by 801,250 $BEAT in platform revenue, equivalent to 2,898,121 USDT.
The total burned supply now stands at 17,839,882 $BEAT, permanently removed from circulation. 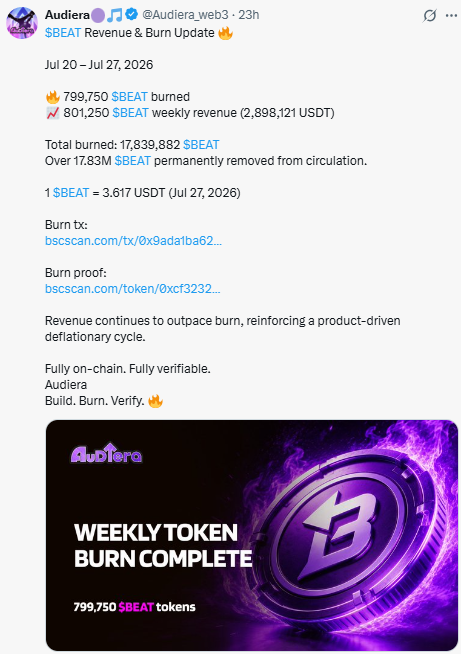
The post included both a burn transaction and a burn proof link on BscScan, making the claim independently verifiable rather than just a stated figure.
Revenue continuing to outpace the burn amount is the core of what the project calls its deflationary cycle.
BEAT Whale Concentration: On-Chain Holder Data
BscScan data shows 151,988 total holders and more than 25 million transfers recorded on-chain.
Concentration among those holders is extreme: the top 100 wallets hold 98.85% of supply, and whales, just 0.09% of all holders, control 99.67% of supply between them. 
The Gini distribution score sits at 0.9999, close to the maximum possible concentration, with only 12 holders owning at least 1% of total supply.
The top 5 holders alone account for 67.99% of supply, and the top 10 account for 84.11%.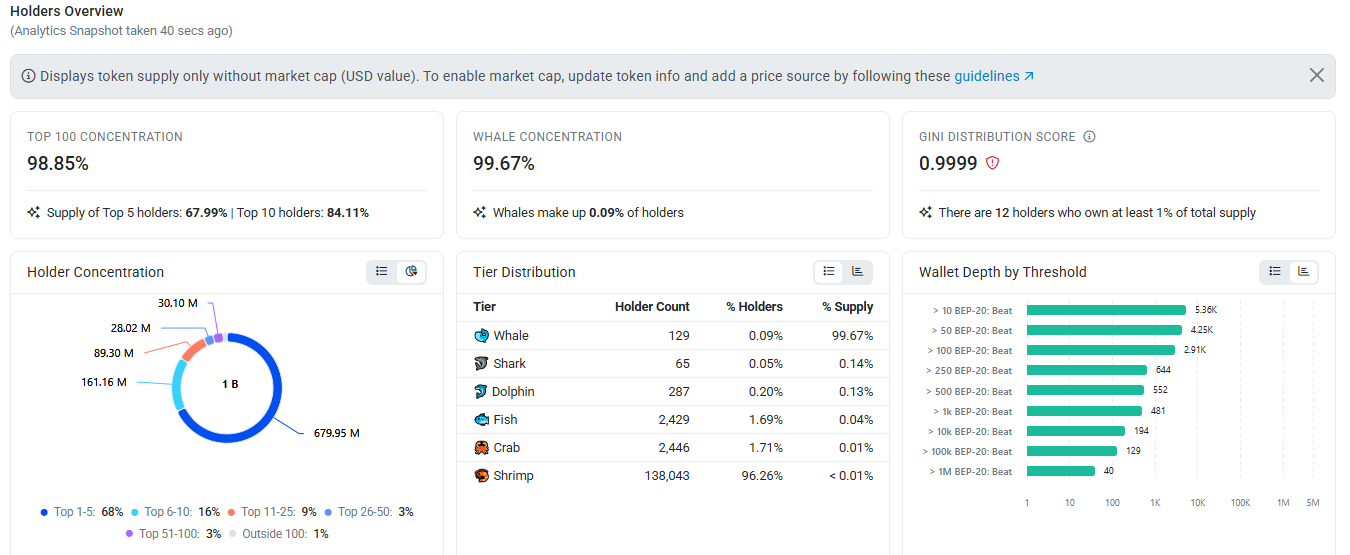
Breaking this down by tier, 129 whale wallets control 99.67% of supply, while the remaining 151,859 holders together hold just 0.33%. Notably, 138,043 wallets, or 96.26% of all holders, sit in the shrimp tier, together holding under 0.01% of supply.
This level of concentration means large-wallet activity can move price independent of retail sentiment.
Source: Data from BscScan as of July 28, 2026.
BEAT Forecast: Chart Analysis
Pair: Audiera/USD | Timeframe: 4H | As of: July 28, 2026, 12:14 UTC+5:30 | Indicators: EMA 20/50/100/200, RSI (14)
BEAT has been climbing inside a long rising trendline stretching back to around June, tracking a steady sequence of higher lows.
Around July 19-22, price tested this trendline and briefly dropped below it, a move marked on the chart as a fake breakdown before recovering back above the line and continuing higher.
That test and recovery is what makes this trendline meaningful rather than just a line on a chart.
From there, price accelerated sharply, spiking to a high of $4.5207 around July 26-27 before a sharp reversal candle dropped it hard, wicking down and closing back near the current $2.8000 level.
Price is now trading right on top of the same rising trendline, in the $2.50 to $2.80 zone, which lines up closely with the trendline and the $2.5059 horizontal support level.
This is the same structural trendline already tested once during the fake breakdown, so how it holds here is a genuine second test.
The EMA readings (20: 3.2829, 50: 3.0798) show the price has fallen below, a shift from the strong uptrend structure seen through most of July.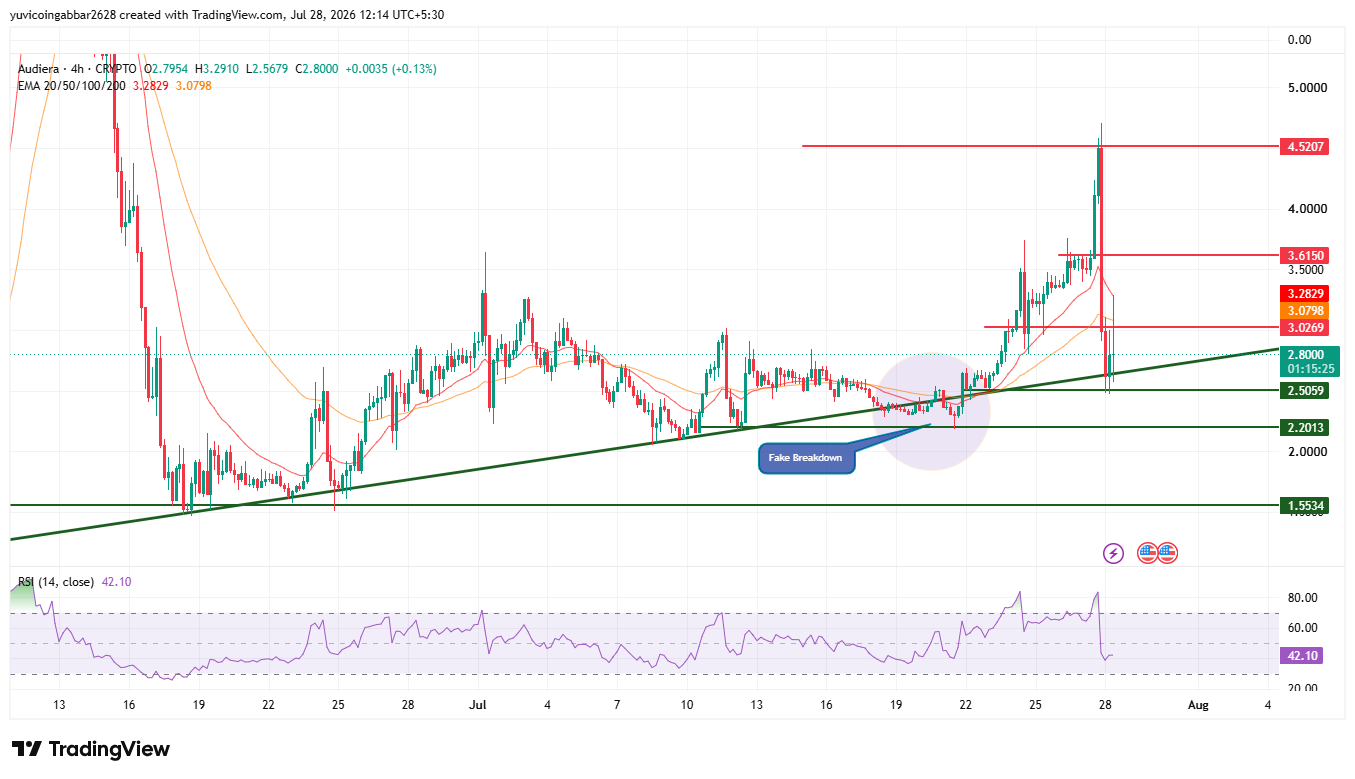
RSI at 42.10 has dropped from overbought territory into the neutral-to-slightly-bearish range, confirming momentum has cooled sharply after the spike.
| Level | Price | Description |
|---|---|---|
| Resistance | $4.5207 | Recent spike high |
| Resistance | $3.6150 | Prior swing high before the spike |
| Immediate price reference | $2.8000 | Current price, sitting on the rising trendline |
| Trendline / first support | $2.50 - $2.80 | Same trendline already tested once in the fake breakdown |
| Deeper support | $2.2013 | Next level if the trendline fails |
| Major support | $1.5534 | Origin zone of the broader uptrend |
BEAT Price Prediction: Price Scenarios
| Scenario | Target | Probability | Trigger | Confirmation Level | Timeframe | Invalidation Level |
|---|---|---|---|---|---|---|
| Bullish | $3.6150 | 30% | Trendline holds again and price reclaims above the EMA cluster on rising volume | Daily close above $3.0798 | 3 to 7 days | Close back below $2.50 |
| Base Case | $2.20 to $3.02 | 45% | Price consolidates around the trendline while the market digests the recent spike and drop | Price holding inside the range for several sessions | 3 to 7 days | Daily close outside either side of the range |
| Bearish | $1.5534 | 25% | Trendline fails for the first time, confirming a genuine breakdown | Daily close below $2.2013 on rising volume | 3 to 7 days | Reclaim of $2.50 on rising volume |
Probability weighting favors the base case since the trendline has held under pressure once before, but the size of the recent reversal candle and the drop below all three EMAs keep the bearish case elevated above what a routine pullback would suggest.
Can BEAT Reach $3.6150 Again?
A retest of $3.6150 is possible within the bullish case, but it depends on BEAT first holding the $2.50 to $2.80 trendline zone and reclaiming the EMA cluster around $3.03 to $3.28.
Without the trendline holding here, a push back toward the prior swing high looks unlikely in the short term.
What Could Invalidate the Bullish Setup?
The bullish case would be invalidated by a daily close below $2.2013, confirming the rising trendline has failed for the first time since it formed in mid-July.
A rejection at the EMA cluster on the first bounce attempt would also be an early warning sign.
Two Scenarios: Trendline Hold vs Breakdown
Hold scenario: If BEAT holds the $2.50 to $2.80 trendline zone and reclaims the EMA cluster on rising volume, the broader uptrend stays intact with $3.6150 as the next test. Invalidation for this view is a daily close back below $2.50.
Breakdown scenario: If the trendline fails this time and price closes below $2.2013, BEAT risks a deeper slide toward the $1.5534 zone, the origin of the broader uptrend. Invalidation for this view is a reclaim of $2.50 on rising volume.
Audiera Price Prediction 2026: Risks Traders Should Watch
BEAT just posted a sharp reversal after spiking over 60% to a new high, a pattern that often reflects a fast, leveraged move unwinding.
The extreme on-chain concentration, with 129 wallets controlling 99.67% of supply, means large holder activity could add further volatility in either direction, independent of the weekly burn narrative.
Treat any bounce with caution until the trendline zone is confirmed to hold on a retest.
BEAT Market Outlook: Expert View
According to CoinGabbar analysts , the fact that this trendline already survived one genuine test during the mid-July "fake breakdown" gives it more credibility than a trendline being tested for the first time.
That said, the scale of this week's spike and reversal, combined with price dropping below every major EMA, means this second test carries real weight. The weekly burn update is a positive, verifiable signal for the token's supply-side story, but with whales controlling nearly all of the supply, near-term price action will likely be decided more by large wallet behavior than by the burn rate alone.
Data Sources
Technical levels are based on the 4H chart via TradingView, as of July 28, 2026, 12:14 UTC+5:30. Price and market data checked via CoinMarketCap as of the same date, holder concentration data via BscScan, and burn/revenue figures from Audiera's official X account with on-chain proof links.
Disclaimer: This article is for informational purposes only and should not be considered financial or investment advice. Cryptocurrency markets are highly volatile, and prices can change rapidly based on market conditions. Readers should conduct their own research and consult a qualified financial advisor before making any investment decisions. CoinGabbar does not guarantee the accuracy of price predictions, and past performance is not indicative of future results.
0
0

 Tüm kripto, NFT ve DeFi varlıklarınızı tek bir yerden yönetin
Kullanmaya başlamak için portföyünüzü güvenli bir şekilde bağlayın.