
SPX6900 Price Prediction 2050: The 75X Moonshot Scenario

0
0
SPX6900 has become one of the most talked-about meme coins in the crypto market, and a lot of investors now want to know where this token could realistically stand decades from now.
This SPX6900 price prediction 2050 article breaks down the coin's chart structure, its Fibonacci levels, and long-term possibilities using the current market setup, so you get a grounded picture instead of pure guesswork.
Whether you already hold SPX or are just watching from the sidelines, this SPX6900 price prediction 2050 outlook should give you a clearer sense of what a multi-decade hold could look like.
SPX6900 Current Market Snapshot
Before jumping into any long-term number, it helps to look at where $SPX6900 actually stands today.
The token price is trading in the $0.35–$0.40 zone, well below its all-time high of $2.27 recorded on July 28, 2025.
It has also moved a long way up from its all-time low of $0.001318, which shows just how volatile this asset has been since launch.
Circulating supply sits around 931 million $SPX out of a 1 billion max supply, and the project has already burned over 69 million tokens, roughly 6.9% of total supply, in a move that fits its satirical "6900 > 500" branding against the S&P 500 index.
Market cap currently hovers near the $360–$375 million range, which keeps $SPX6900 inside the top 100–150 cryptocurrencies by size.
That's a fairly small cap compared to major altcoins, and that's exactly why long-range predictions like this SPX6900 price prediction 2050 piece involve wide ranges rather than a single fixed number; small-cap meme assets can swing dramatically in either direction over a 25-year window.
Monthly Chart and Fibonacci Structure
Looking at the monthly chart , $SPX6900 built its entire price history inside a clear impulse-and-retracement structure.
After the 2025 rally toward the $2.27 peak, the coin corrected hard and has been consolidating in what chartists are calling an ascending channel near the $0.25–$0.40 zone. 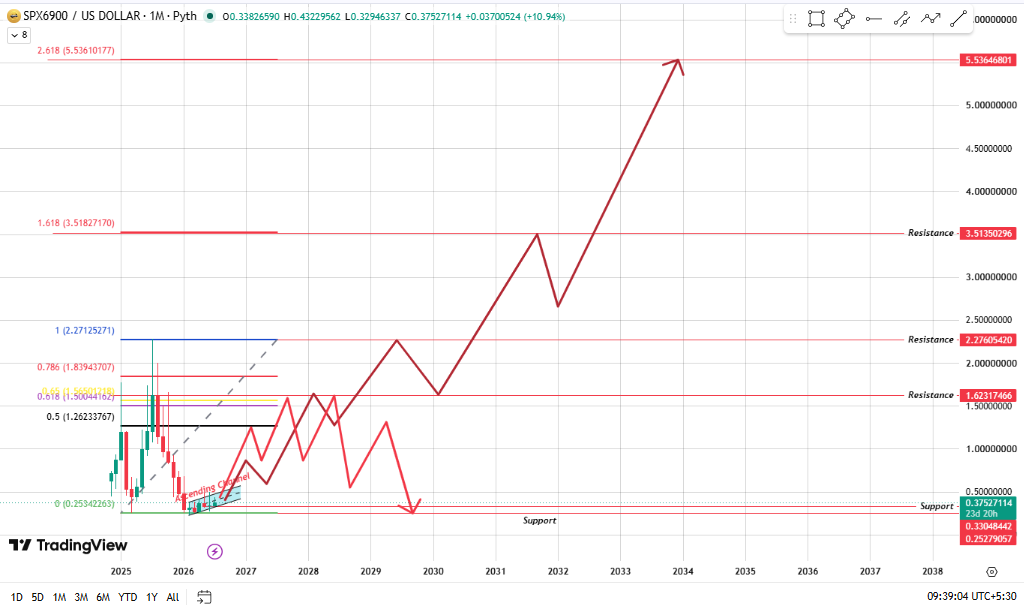
Source: Chart Taken By TradingView
This base-building phase lines up almost exactly with the 0 Fibonacci level (around $0.253), with immediate support sitting near $0.33 and current price action around $0.37.
The Fibonacci retracement drawn from the swing low to the 2025 high maps out the key levels to watch on any future breakout:
| Fibonacci Level | Price Target | Significance |
|---|---|---|
| 0.5 Fib | $1.26 | First major resistance after recovery |
| 0.618 Fib | $1.50 | Golden ratio resistance and key breakout level |
| 0.786 Fib | $1.84 | Strong resistance before a new all-time high |
| 1.0 Fib | $2.27 | Previous all-time high (ATH) |
| 1.618 Extension | $3.51 | First major long-term bullish extension target |
| 2.618 Extension | $5.54 | Next major Fibonacci extension and long-term resistance |
These aren't random numbers; they're the same type of levels that have acted as resistance and support throughout SPX6900's short but eventful trading history.
If the ascending channel holds and buyers eventually reclaim the $0.5–$1 range, these Fibonacci extensions become the realistic roadmap for where the next major $SPX6900 price target could sit.
They're a big part of why a proper $SPX6900 price prediction 2050 has to be built level by level rather than guessed outright.
SPX6900 Price Prediction 2026–2030
Short-term, most analysts covering $SPX6900 expect the coin to stay tied to overall memecoin sentiment and Bitcoin's broader trend.
A recovery back above the $0.5 Fibonacci zone would open the door toward the $0.75–$1 range by the end of 2026.
If that momentum carries into 2027 and 2028, the 0.618 and 0.786 retracement levels near $1.50 and $1.84 become realistic upside targets, especially if the broader altcoin market enters another expansion phase.
Now push that out to 2030; if SPX6900 can actually claw its way back above that old $2.27 high and hold there, the $3.50 mark (the 1.618 extension) starts looking within reach, assuming the broader market cycle plays along.
This is still speculative, since memecoins depend heavily on community momentum and social attention rather than fundamentals.
But the chart structure does support this kind of gradual climb if buyers stay in control at each Fibonacci level.
SPX6900 Price Prediction 2035–2040
Looking further out, the picture gets naturally hazier, but the same Fibonacci framework still gives a useful ceiling to work with.
If SPX6900 survives multiple market cycles and keeps its community and liquidity intact, the 2.618 extension near $5.53 becomes the next major long-term resistance zone.
A move like this wouldn't happen in a straight line; expect sharp pullbacks along the way, similar to the 2025–2026 correction, before any fresh leg higher.
Fast forward to 2040 with crypto adoption spreading wider, liquidity running deeper, and $SPX6900 hopefully earning itself a permanent seat at the meme coin table, something like $4 to $8 isn't out of reach, but only if the token can actually break past that $5.50 resistance and stay there.
On the flip side, if interest fades or a stronger meme coin takes its spot in the market's attention, $SPX6900 could just as easily stay range-bound near its current Fibonacci base for years.
SPX6900 Price Prediction 2050
Now to the number everyone's actually here for. A realistic SPX6900 price prediction 2050 has to account for 24 years of market cycles, technology shifts, and changing investor behavior.
None of which can be forecast with real precision. That said, using the current Fibonacci map as a long-term guide:
Bearish scenario: $SPX6900 loses relevance over the decades, community fades, and the token trades in a low range roughly between $0.10 and $0.50, similar to where many old meme coins end up.
Base scenario: $SPX6900 maintains a loyal community, periodic burns continue reducing supply, and the token oscillates between major Fibonacci zones, landing somewhere in the $5 to $15 range by 2050.
Bullish scenario: Now, if $SPX6900 actually turns into one of those meme coins that just refuse to die.
Something people will still talk about decades from now is the way a handful of older meme coins managed to hold their ground and crypto as a whole keeps pulling in bigger money over the years, so $20 to $40+ isn't a crazy number to throw around.
But let's be honest, getting there means demand has to stay strong for a very, very long time, way beyond what SPX sees right now.
And that's really the catch with any SPX6900 price prediction 2050.
Everything above is built off chart structure and how Fibonacci levels have played out historically; it's not a promise, and nobody can actually know what SPX looks like in 2050.
Meme coins live or die on community energy and whatever's trending that year, so honestly, take these numbers as a rough compass, not something set in stone.
SPX6900 Price Prediction Target Table (2030–2050)
To make the long-term picture easier to scan, here's a year-by-year target table based on the Fibonacci zones and the bear/base/bull scenarios discussed above:
| Year | Minimum Price | Average Price | Maximum Price |
|---|---|---|---|
| 2030 | $1.20 | $2.30 | $3.55 |
| 2035 | $2.00 | $3.80 | $5.60 |
| 2040 | $3.00 | $6.00 | $9.50 |
| 2045 | $4.50 | $9.00 | $16.00 |
| 2050 | $6.00 | $14.00 | $28.00 |
These figures line up with the Fibonacci resistance ladder on the monthly chart; the $3.51 (1.618) and $5.53 (2.618) levels act as the key structural ceilings through the 2030s.
While the 2040s and 2050 numbers assume $SPX6900 eventually breaks past those zones on the back of sustained community demand and continued supply burns.
As always, treat the higher end of this table as an optimistic case rather than a certainty.
Factors That Could Shape SPX6900 by 2050
A few things will likely decide whether $SPX6900 leans toward the bearish or bullish end of this range over the coming decades:
Community strength: meme coins live and die by how active and loyal their holder base stays over time.
Continued token burns: $SPX6900 has already burned 6.9% of supply; further burns would tighten circulating supply and support price.
Broader crypto market cycles: Bull and bear cycles in Bitcoin and Ethereum tend to drag memecoins along with them.
Exchange listings and liquidity: wider availability across major platforms usually supports higher, more stable valuations.
Cultural relevance: SPX6900's satirical "beat the S&P 500" branding needs to keep resonating with new generations of crypto users to stay relevant three decades out.
Final Thoughts
$SPX6900 has already shown it can rally hard and correct just as fast, and that volatility isn't going away anytime soon.
The Fibonacci structure on the monthly chart gives a genuinely useful framework for near-term targets, but stretching that same logic out to 2050 means accepting a wide range of outcomes rather than a single confident number.
Anyone using this SPX6900 price prediction 2050 breakdown should treat it as a starting point for research, not financial advice.
Meme coin markets move on sentiment as much as charts, and that won't be any different a decade or two from now.
Disclaimer: This article is for informational purposes only and should not be considered financial advice. Cryptocurrency investments, especially in high-volatility meme coins like $SPX6900, carry significant risk. Always do your own research before investing.
0
0

 Gestisci cripto, NFT e DeFi in un unico luogo
Connetti in sicurezza il portafoglio che usi per iniziare.

