Ethereum Price Reclaims Crucial Levels as Institutional Rotation Accelerates

0
0

Ethereum Price Shows Bullish Momentum Amid Major Market Shifting
The $Ethereum price has entered a critical phase of price discovery in early March 2026. Following a period of consolidation, the second-largest cryptocurrency by market cap is currently testing the psychological and technical barrier of $2,100. This move comes at a time of significant institutional movement, most notably the high-profile rotation from Bitcoin into Ethereum by major endowments.
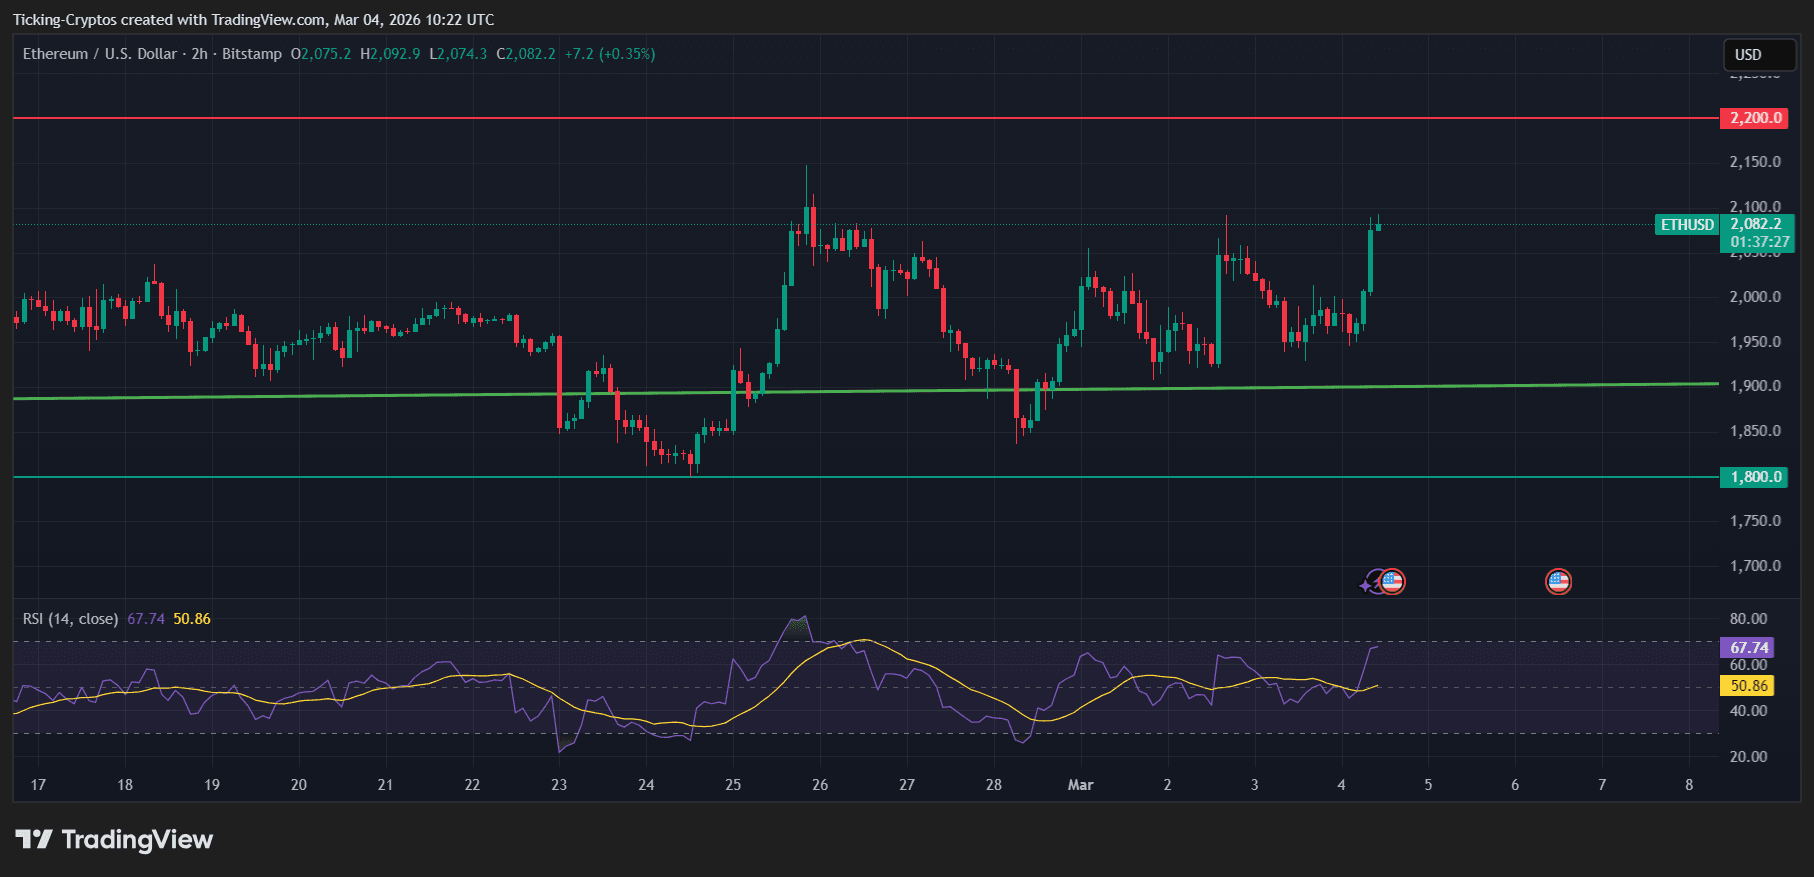
As of today, March 4, 2026, ETH is trading at approximately $2,082, marking a recovery from the recent local lows near $1,800. This analysis explores the technical indicators and fundamental drivers that could propel the Ethereum price toward the $2,200 mark or trigger a retracement to established support zones.
Ethereum Price Analysis: ETH Coin Battles the $2,100 Ceiling
The current 2-hour chart for ETH/USD reveals a series of higher lows, suggesting a gradual buildup of bullish pressure. After a sharp rejection at the $2,150 level in late February, Ethereum found solid ground at the $1,900 support zone.
Key Technical Indicators
- Support Levels: The green horizontal line at $1,900 remains the primary defensive line for bulls. A secondary, deeper support exists at $1,800, which has historically been a "buy the dip" zone for whales.
- Resistance Levels: The immediate hurdle is the $2,100 zone. A sustained candle close above this level is required to open the door for a retest of the red resistance line at $2,200.
- Relative Strength Index (RSI): The RSI is currently hovering around 67.74. While this indicates strong upward momentum, it is approaching the "overbought" threshold of 70. This suggests that while the trend is bullish, a short-term cooling period or minor consolidation might occur before the next leg up.
Institutional Catalyst: The "Harvard Effect"
One of the most significant fundamental drivers for the current Ethereum price action is the recent disclosure regarding institutional portfolios. Reports indicate that Harvard University’s $57 billion endowment has significantly trimmed its Bitcoin ETF exposure to rotate capital into the iShares Ethereum Trust (ETHA).
This $86.8 million entry by one of the world's most prestigious academic institutions signals a shift in sentiment. While $Bitcoin remains the primary macro asset, Ethereum is increasingly viewed as the essential "growth layer" of the digital economy. This institutional validation often precedes long-term price appreciation as other funds look to mirror the strategies of top-tier endowments.
"The rotation from BTC to ETH by entities like Harvard suggests that the market is beginning to value Ethereum's utility and staking yields as a distinct investment thesis from Bitcoin's 'digital gold' narrative." — Market Analyst Insight
Network Growth and Roadmap Milestones
Beyond the charts, the Ethereum network continues to evolve. The recent introduction of EIP-8141 by Vitalik Buterin, aimed at bringing native Account Abstraction to the base layer, has bolstered long-term investor confidence. This upgrade is expected to simplify the user experience significantly, potentially driving mass adoption by removing the need for users to hold ETH for gas fees through the use of "Payment Frames."
Furthermore, on-chain data shows that companies like BitMine have been aggressively accumulating. BitMine recently added over 50,000 ETH to its treasury, bringing its total holdings to over 4.4 million ETH. This corporate "HODLing" reduces the circulating supply, creating a supply-side liquidity crunch that can exacerbate price moves to the upside.
What’s Next for Ethereum?
If the Ethereum price can flip the $2,100 resistance into support, the path to $2,200 is relatively clear. However, traders should remain cautious of the RSI levels. A failure to break $2,100 on the current attempt could lead to a healthy retest of the $2,000 psychological level or the $1,900 technical support.
0
0

 Verwalten Sie alle Ihre Kryptowährungen, NFTs und DeFi an einem Ort
Verbinden Sie sicher das Portfolio, das Sie zu Beginn verwenden möchten.

0
0

0
0

