Litecoin price analysis: Bearish stream has caused LTC down to $76.93 end
3
1

Litecoin price analysis for today shows that LTC is facing strong headwinds from the market, and has fallen to a low of $76.93. The bearish trend in the market is driving prices down across many cryptocurrencies, and it will be interesting to see if LTC can bounce back from these lows or continue its downtrend. There are some key resistance levels at $78.43 and $80.00 levels to watch, as these could provide some resistance for LTC if it begins to recover. However, if the market remains bearish, there is potential for further losses in LTC down to support levels around the $75.75 and $70 mark.
The bullish and the bearish are currently in a tug of war for control over LTC price, with neither side yet gaining a clear advantage. The market opened trading on a bearish side but was quickly reversed, causing LTC/USD to move up towards $78.29. However, as the market turned bearish again, LTC has been unable to regain this level and is currently trading near $76.93
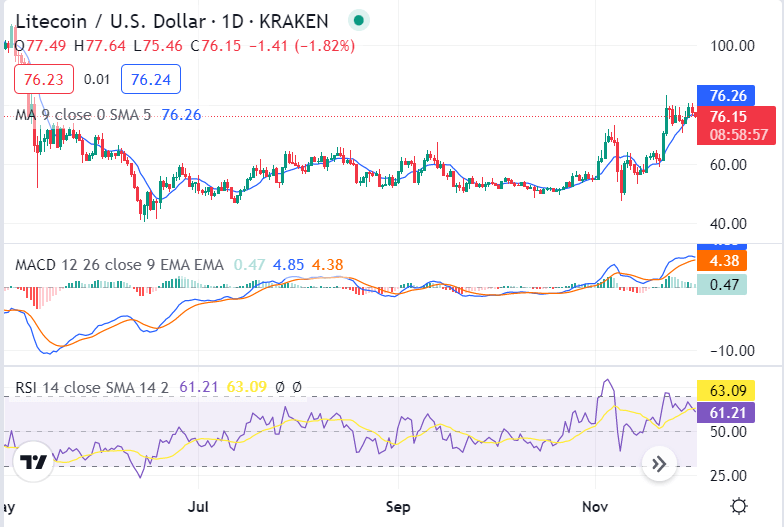
LTC/USD 1-day price chart: Cryptocurrency is struggling to break through bearish resistance as downtrend continues.
The 24-hour, Litecoin price analysis shows that LTC is struggling to break through the bearish resistance as the downtrend continues. Despite some corrective gains yesterday, LTC/USD has been unable to sustain this momentum and has fallen back down toward its support levels at $75.75 level. The LTC/USD has decreased by 0.72 percent in the last 24 hours. Currently, the price for ADA is $76.93, and further losses in the near term are expected.

The moving average (MA) value present in the one-day price chart stands at $76.26 and is showing a bullish crossover with the MA value present in the 50-day price chart, which indicates that LTC might find some support at this level. The MACD indicator is moving downward and remains in bearish territory, indicating that the price for LTC might further decline in the near term. The Relative Strength Index (RSI) is also moving downward and points to increased selling pressure in the market, as it is currently at 63.09, which is an indication that LTC might continue to fall in the near term.
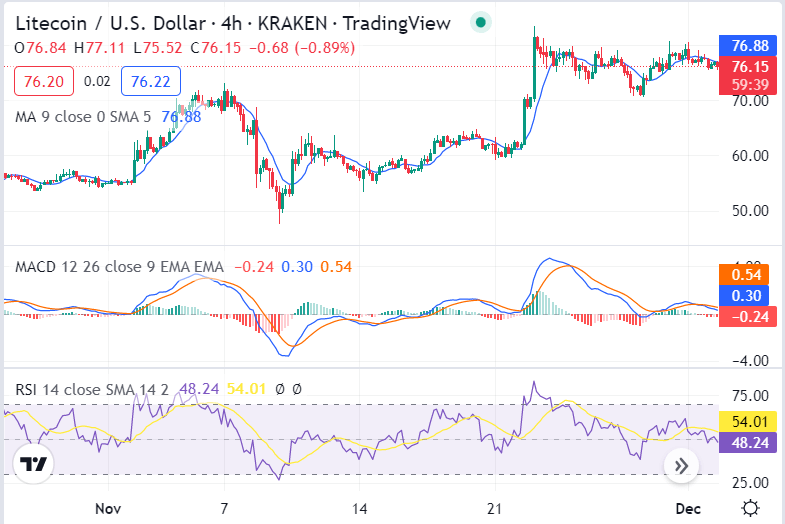
Litecoin price analysis 4-hour price chart: Prices fell to $76.93 in the recent decline
The 4-hour Litecoin price analysis of recent price behavior confirms that a downward trend has developed in the past few hours. Although there was an earlier recovery due to bullish sentiment, the most recent price movement reflects bearishness taking over the market. The value leveled off at $76.93 as a result of this declining trend, and it is likely that selling activity will continue and intensify. Additionally, moving average values are currently standing at the $76.88 position.

The MACD indicator is reflecting a bearish crossover and continues to remain in the negative area, With the signal line crossed below the MACD line, it shows that LTC/USD might continue to fall in the next few hours. The relative strength index (RSI) is just below 70 points and pointing toward increased selling pressure, indicating that further declines are likely.
Litecoin price analysis conclusion
Based on the Litecoin price analysis, it appears that the market is currently bearish and prices are likely to decline further in the near term. There are some key support levels at $75.75 and $70, however, if the downward trend continues then these might not be enough to prevent further losses in LTC. On the other hand, if the market turns bullish once again and breaks through resistance at $78.43, there will likely be some potential for gains in LTC/USD.
Disclaimer. The information provided is not trading advice. Cryptopolitan.com holds no liability for any investments made based on the information provided on this page. We strongly recommend independent research and/or consultation with a qualified professional before making any investment decisions.
3
1
 Gerencie todo seu criptograma, NFT e DeFi de um só lugar
Conecte com segurança o portfólio que você está usando para começar.


