Chainlink Price Analysis of March 13, 2025: Chainlink Fluctuates between $12.65 and $13.80, Is a Breakout on the Horizon?

0
0

Are you tracking Chainlink and wondering what makes its price fluctuate? Then you are at the right place. As we go through the Chainlink price analysis, we will explore different patterns and how the Chainlink price trend reacted to them. We will also analyze RSI and MACD indicators to determine potential support and resistance levels for Chainlink. Without any further delay, let’s dive into Chainlink price analysis and determine where the Chainlink price today might trade.
Chainlink Price Analysis of the Last 24 Hours
At 01:50 UTC, the price broke sharply to the downside, forming a spike and a downward channel pattern, marking the low of the day at $12.65. In the meantime, RSI dropped below the level of 30, indicating an oversold market condition, which was further supported by a golden cross in MACD at 04:50 UTC. This led to a price push to the upside, forming a spike and a downward-moving channel.
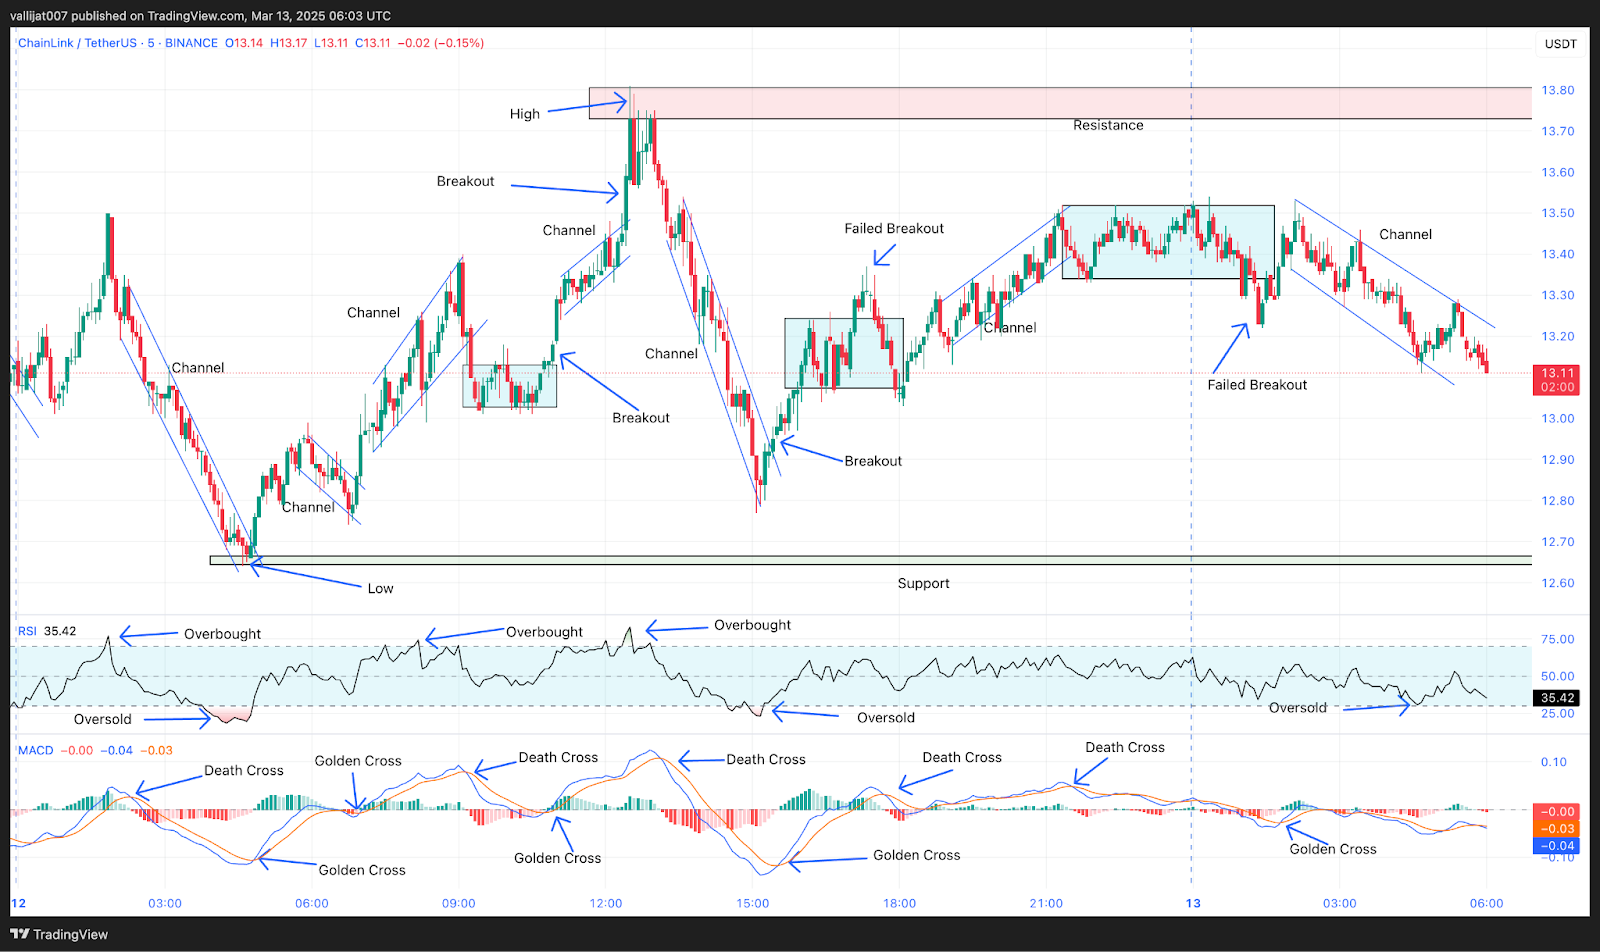
Chart 1: Analysed by vallijat007, published on TradingView, March 13, 2025
The downward-moving channel broke to the upside at 06:55 UTC, corroborated by a golden cross in MACD. The price spiked to the upside and formed an upward-moving channel, which then broke out to the downside at 09:15 UTC, corroborated by another golden cross in MACD. At the same time, the RSI moved above the level of 70, indicating an overbought market condition.
Chainlink Consolidates After Spike
As the price broke out to the downside of the upward-moving channel, it formed a spike and a minor range. The minor range broke out to the upside at 10:55 UTC, supported by another golden cross in MACD, pushing the price further upward into an upward-moving channel. The upward-moving channel broke out to the upside, marking the high of the day at $13.80.
At the same time, RSI moved into an overbought market condition, and at 13:10 UTC, a death cross appeared in MACD, both suggesting that a price drop was imminent. The price spiked to the downside and formed a downward-moving channel. The downward-moving channel attempted to break the support level at $12.65 but failed. Instead, the price broke out to the upside from the downward-moving channel at 15:25 UTC, corroborated by a golden cross in MACD.
The price spiked to the upside and formed a range. At 17:20 UTC, the range had a failed breakout. An upward-moving channel appeared, which later developed into a vertical range. The vertical range attempted to break out to the downside at 01:00 UTC, but the downside breakout failed, and the price again moved to the upper zone of the range.
Chainlink Price Consolidation: Is a Breakout Coming?
The Chainlink price today is consolidating after a strong spike from the downside a few days before. This indicates that bullish momentum is still present in Chainlink. If the Chainlink price breaks out from the resistance level, a strong uptrend could be seen. However, if the support level is broken, then Chainlink might test its recent recovery area again. Chainlink is still in a downtrend in the higher timeframe, and selling pressure could increase if it attempts to break out to the upside. Traders and investors are encouraged to analyze the Chainlink price trend by themselves because the crypto market is subjected to potential risk.
The post Chainlink Price Analysis of March 13, 2025: Chainlink Fluctuates between $12.65 and $13.80, Is a Breakout on the Horizon? appeared first on Coinfomania.
0
0

 Tüm kripto, NFT ve DeFi varlıklarınızı tek bir yerden yönetin
Kullanmaya başlamak için portföyünüzü güvenli bir şekilde bağlayın.