
Bitcoin Price Frozen Near $79,000 as Oil and War Risk Rewrite the Macro Playbook

0
0
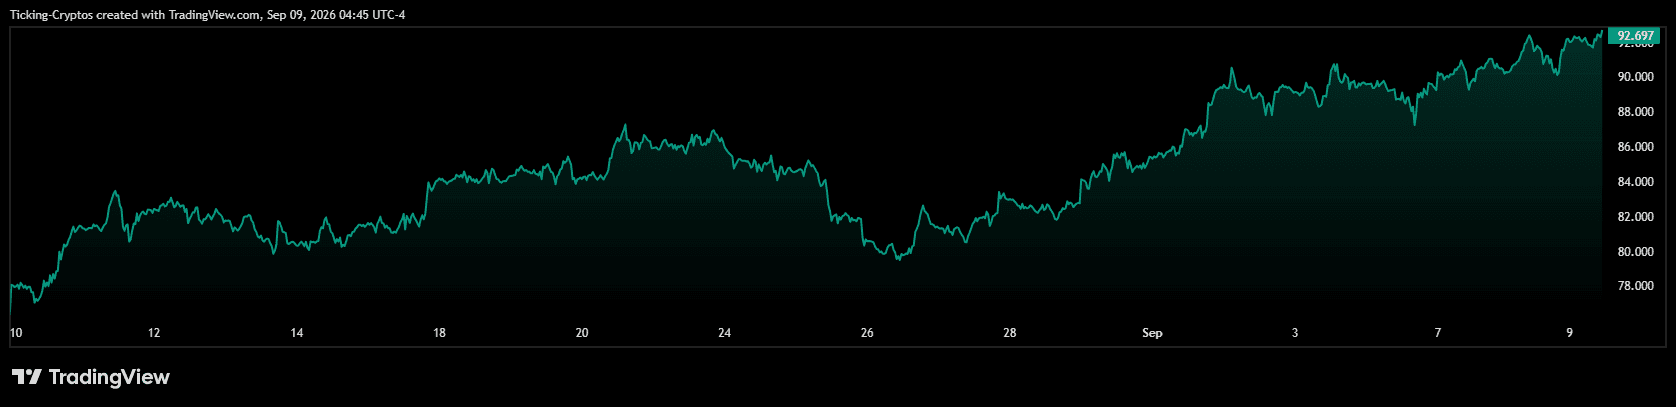
After a 20 percent breakout, one would expect movement. But with Bitcoin, what's happening right now is: nothing. For nearly three weeks, the price has been stuck between around $77,500 and $80,500, after shooting up from the $65,000 range at the end of August. Currently, $BTC is trading at about $78,700, a decrease of around 1.3 percent in the last 24 hours. That's not weakness. The market is waiting for a signal, and it’s not coming from the crypto sector. It’s coming from oil tankers in the Strait of Hormuz and from a Fed chair who has stopped talking about interest rate cuts.
Why is the Bitcoin price consolidating at $79,000?
The short answer: Every attempt to reach $80,500 has been consistently sold off.
The breakout in the third week of August was intense. Within a few days, the price surged from around $65,000 into the upper $70,000 range, and since then, it has been moving sideways. Today's drop below $79,000 coincided with stronger US data and rising yields on US Treasury bonds, which is the classic combination of pressures for risk assets. During the retest of the resistance zone, leveraged long positions worth around $55 million were liquidated. This clearly shows where the majority was positioned.
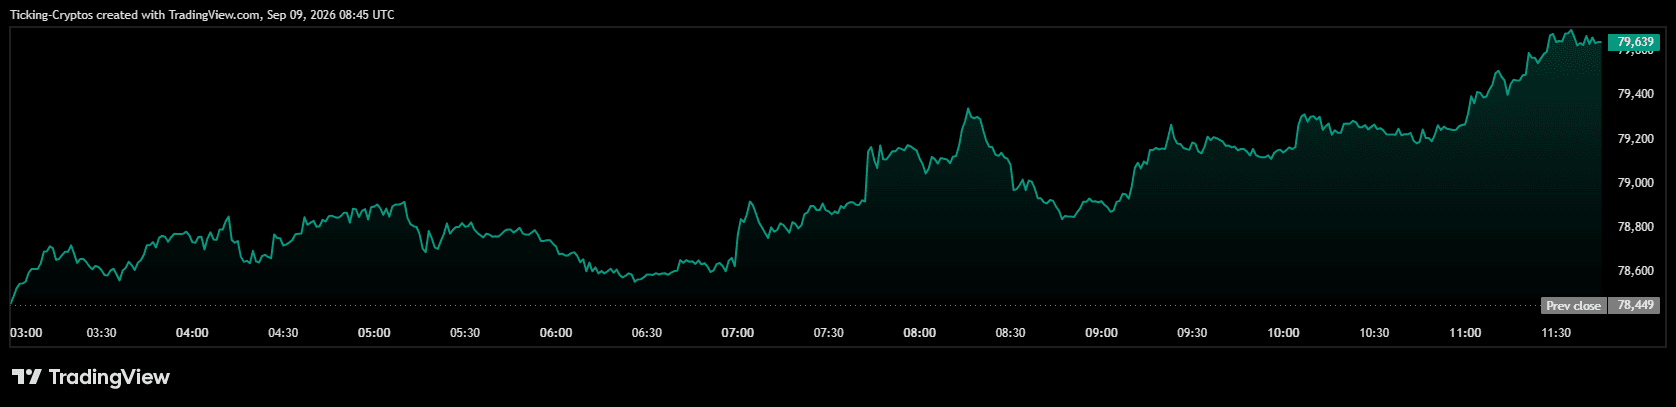
The underlying structure, however, remains healthy. Volume is increasing while the price moves sideways. Selling is actively occurring into strength rather than interest simply fading away. Short-term holders are sitting on billions in unrealized gains, and profit-taking at a round number after a quick movement is exactly what one should expect. The Fear-and-Greed Index stands at 69, clearly in the Greed zone and far from the 31 points a month ago.
A consolidation after a steep rise is not a turning point downward. The market is building a new base at a higher level.
What supports are crucial for the BTC price now?
Three levels matter; everything else is noise:
- Resistance at $80,500. Four attempts have failed here. A daily close above $82,000 would reactivate the breakout and open the path toward $85,000.
- Support at $78,000. The lower boundary of the current range. It has withstood every test since the breakout.
- $75,500. The 20-day moving average and the likely target if $78,000 falls.
As long as $78,000 holds, this is a bull flag with negative headlines in the background. If the level breaks, the August breakout will be seriously retested.
What is the current oil price and why does it matter to the crypto market?
This part is often overlooked in crypto reporting. However, it is currently the most significant influencing factor on the Bitcoin price.
WTI is trading at around $92 per barrel, Brent at just under $97. Just last week, prices rose by about 10 percent, over 12 percent month-over-month, and nearly 50 percent year-over-year. Compared to the lows of late 2025, WTI has more than doubled.
Why should a Bitcoin investor care about a barrel of crude oil? Because oil is the inflation factor that central banks cannot ignore indefinitely. Higher crude oil prices drive transportation and production costs, which ultimately reflect in the inflation rate. Higher inflation rates mean higher interest rates. Higher interest rates mean a greater discount on any long-duration risk asset, and Bitcoin is the longest-duration asset in most portfolios.
Oil at $92 is not just a commodity story. It is monetary policy with a hard hat.
What does the geopolitical situation mean for risk assets?
The crisis in the Strait of Hormuz is now in its seventh month, with no resolution in sight.
The conflict between the US and Iran, which began at the end of February, has effectively severed the world's most important energy corridor. About a quarter of seaborne oil trade and a fifth of global LNG passed through the strait. Over the weekend, the US stated that it had attacked three Iranian oil tankers, destroying one of them in response to missile attacks on US warships. Tehran, in turn, claims hits on three tankers. The US Department of Energy has confirmed that naval presence and blockades will remain. Reports suggest that Iran and Oman are close to an agreement on a monitored tanker route. This is the only constructive thread in the entire story.
At the same time, buffers are thinning. The US strategic oil reserve has fallen below 290 million barrels, the lowest level since 1982. China has scaled back crude oil imports and refinery utilization. The reason oil is at $92 instead of $120 is that the world is tapping into its reserves. And reserves do not refill themselves.
For crypto, this creates a real dilemma. Ongoing geopolitical chaos has historically driven capital into counterparty-free and borderless assets, which is precisely what Bitcoin promises. Conversely, an energy shock that forces central banks to tighten is headwind for anything priced in dollars. At the moment, both forces are balancing each other out, resulting in a chart that looks like a heart monitor between $77,500 and $80,500.
Uncertainty is not the same as pessimism. It is the absence of conviction, and that is exactly what it looks like.
Can a Fed rate hike break the Bitcoin range?
The Fed has kept the key interest rate at 3.50 to 3.75 percent for five meetings. This series is now seriously at risk.
The speech by Fed Chair Kevin Warsh in Jackson Hole at the end of August shifted market expectations. His message: The recently milder price data does not mean that the inflation trend has genuinely improved, and the Fed is not done yet. Markets that had priced in virtually no rate hike before December re-priced within hours. The probability of a hike in September fluctuates between about 55 and 82 percent depending on the data. In July, there were already three dissenting votes in the FOMC calling for a quarter-point increase.
That is 2026 in a nutshell: The year began with priced-in rate cuts and ends with priced-in rate hikes.
Bitcoin has never experienced a rate hike cycle with a $100 billion ETF complex backing it. This very experiment is unfolding over the next two weeks, which is why no one wants to increase their position before the Fed's decision.
Are Bitcoin ETF inflows still the strongest signal?
Yes, and this is the most optimistic data point in the entire market.
Spot Bitcoin ETFs raised nearly $1 billion last week. This brings the total for three weeks to around $3.8 billion, the strongest stretch of 2026. The total assets of the ETFs have surpassed the $100 billion mark, led by BlackRock's IBIT. Compared to the previous week, managed assets saw a slight decline but remain nearly $20 billion above the level from a month ago.
This is the real indication. The price is moving sideways, sentiment among retail investors is nervous, oil is on fire, the Fed is becoming more restrictive, and institutional investors continue to buy about $1 billion per week. Someone with a long-term horizon is using the sideways phase to build positions, and that is not something anyone does when expecting $70,000.
In the broader market, rotation is already underway. Uniswap has risen from around $3.20 in mid-August to about $7. Activity in the futures market for XRP has reached a six-month high. Altcoin volumes are increasing, which temporarily takes some momentum away from BTC but indicates healthy risk appetite beneath the surface.
What should you pay attention to this week?
- The Fed decision. A rate hike is likely to trigger an immediate risk-off sentiment and test $78,000. A hold with a restrictive tone keeps the range intact. A surprisingly dovish Fed sets the stage for $85,000.
- Headlines from Hormuz. Progress on the tanker deal between Iran and Oman would cool oil prices and relieve inflationary pressure from the Fed. This would quietly be the best thing that could happen to Bitcoin this month.
- The yield on ten-year U.S. Treasury bonds. It has risen to around 4.80 percent. Bitcoin has never liked rising real interest rates in its history.
- ETF inflows. If weekly inflows remain around $1 billion even through a restrictive Fed, that would be the strongest institutional conviction signal of this cycle.
The conclusion on the Bitcoin range around $79,000
Bitcoin is not stuck because something is wrong with it. It is stuck because the two largest macroeconomic variables on the planet, an energy shock and a monetary policy shift, are pulling in opposite directions, and neither has been resolved.
The range is the message. $78,000 is the line that matters. Institutional money is building positions into the uncertainty, while leveraged traders are repeatedly getting liquidated at the highs. Historically, this combination does not resolve downward.
Watch the Fed. And then watch the oil tankers.
0
0

 한 곳에서 모든 암호화폐, NFT 및 DeFi 를 관리하세요
시작하는 데 사용하는 포트폴리오를 안전하게 연결하세요.


