
AAVE Price Prediction August 2026: Forecast and Catalysts

0
0
This Aave price prediction August 2026 starts with a simple question: does the daily chart's neckline hold, or does the weekly trendline give way first?
Both charts are flashing setups worth watching right now, and this piece walks through both before landing on real bull, base, and bear ranges instead of one confident number pretending to know exactly what August holds.
Aave Price Today
$AAVE sits near $97.41, down 3.9% on the day, inside a $96.87 to $101.83 range.
Market cap runs around $1.502B, fully diluted value is $1.559B, and 24-hour volume is $227.58M. 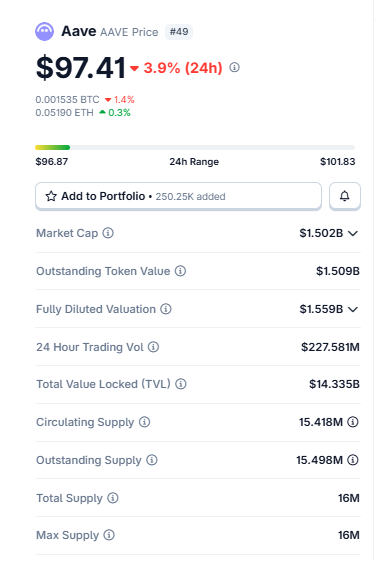
Source: Aave Market Cap Data Taken From Coingecko, data as of July 28, 2026. Figures may vary slightly across other tracking websites.
Total value locked across the protocol holds at $14.335 billion, which is still healthy for a lending protocol this size. The circulating supply is 15.418M against a 16M max, so there's barely anything left to unlock.
Daily Chart: Aave Price Chart Analysis
In this $Aave price prediction August 2026, the daily chart is shaping an inverse head and shoulders pattern.
A deeper low in the middle, two shallower lows on either side, and the price has now pushed right up into the neckline near $101.
This is the price moment that decides things. Volume shows up, and buyers actually break that neckline, and the measured move points toward $113, the same target a Wolfe wave projection on this chart is flagging too. 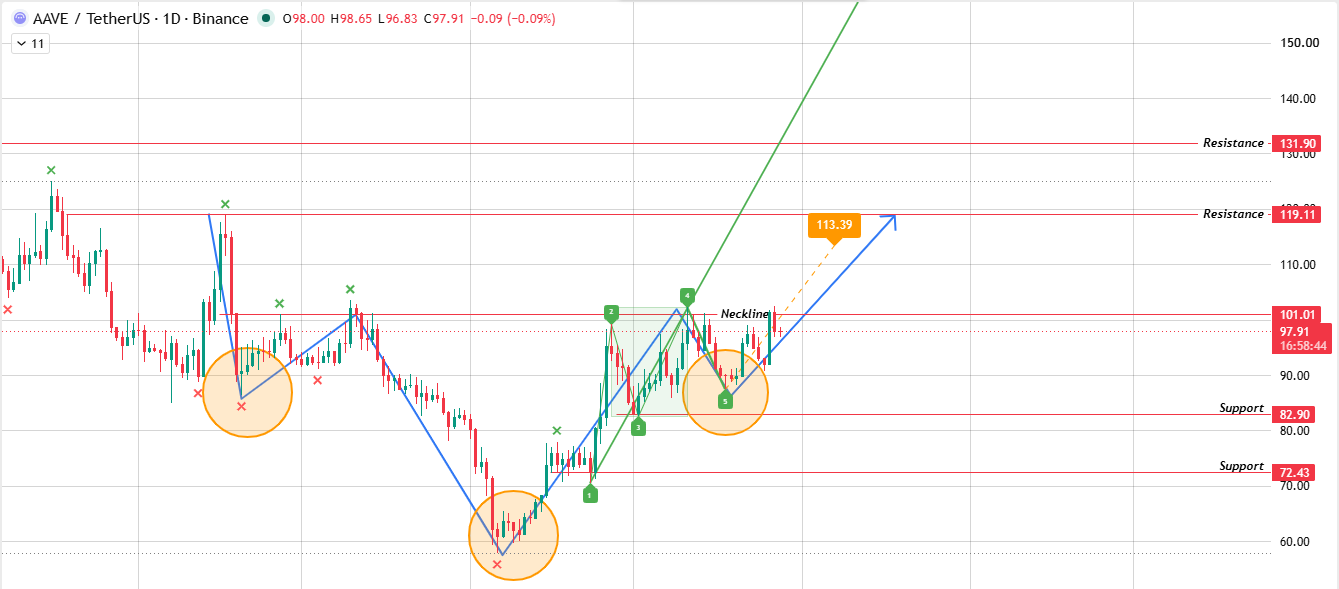
Source: Chart Taken From TradingView.
Both readings lining up on the same number is a decent sign, not proof, just a decent sign. Clear $113, and the path opens toward resistance level zones at $119.11 and $131.90.
But if the neckline holds as resistance instead of flipping to support, expect the price to fall back toward $82.90, with $72.43 as the deeper floor if that breaks too.
Weekly Chart: $Aave Trend Analysis
Zooming out to the weekly timeframe, $AAVE has been respecting an ascending trendline since its base near $60. The price is testing that trendline again right now. 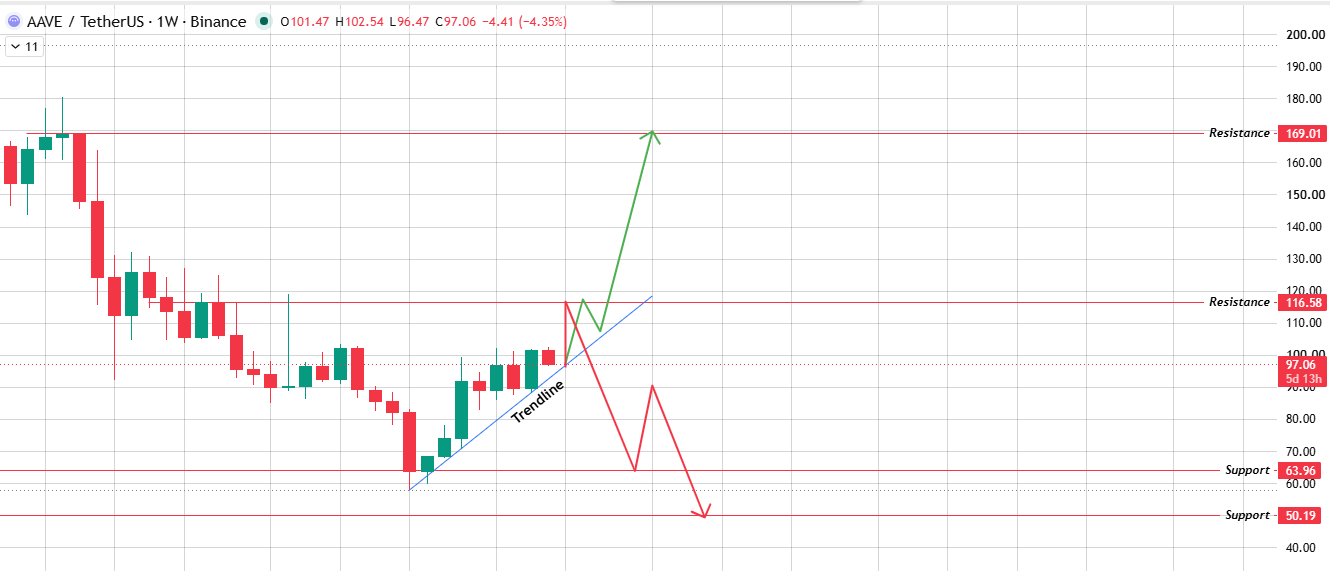
Source: Weekly Chart Taken From TradingView.
Hold it, and volume coming back in would likely push $AAVE through the first weekly resistance at $116.58, then on toward $169.01 if the broader Aave rally actually has legs.
Lose this trendline instead, and the drop could be sharp, back down to weekly support at $63.96, with $50.19 as the level beneath that.
Bull, Base, and Bear Cases
| Scenario | Trigger | Target |
|---|---|---|
| Bull Case | The neckline and weekly trendline both hold as volume returns. | $113 - $169 |
| Base Case | Price chops between the neckline and weekly trendline support. | $87 - $102 |
| Bear Case | Neckline is rejected and the weekly trendline breaks. | $63.96 - $50.19 |
What's Driving $Aave This Month
Lending activity and protocol revenue give this Aave price prediction August 2026 more substance than a pure hype-driven token would have.
Watching whale accumulation and exchange net flow heading into August matters; large wallets tend to move before price does, not after.
There's no major token unlock this cycle either; supply is already close to its cap, so that risk is smaller here than for younger projects still emitting heavily.
The bigger swing factor is probably broader market risk appetite rather than anything $AAVE-specific, and that's true of most Aave Price forecast August 2026 scenarios floating around right now, not just this one.
Risks to This Forecast
A security incident anywhere in DeFi, even one unrelated to Aave directly, tends to spook the whole sector fast.
A sharp shift in funding rates across crypto derivatives toward risk-off would likely drag $AAVE down with everything else.
And if neither chart pattern resolves cleanly, a long stretch of sideways chop between $87 and $102 is just as real an outcome as either the bull or bear case.
That range-bound scenario is honestly the most likely single outcome for any Aave price prediction August 2026, covering the full month rather than just the next breakout attempt.
Disclaimer: This Aave price prediction august 2026 is for informational and educational purposes only and should not be considered financial or investment advice. Cryptocurrency markets are highly volatile, and prices can change rapidly. Always conduct your own research and consult a qualified financial advisor before making any investment decisions.
0
0

 Gérez tous vos cryptos, NFT et DeFi à partir d'un seul endroit.
Connectez de manière sécurisée le portefeuille que vous utilisez pour commencer.

0
0

0
0


0
0