
Jupiter Price Prediction September 2026: JUP Outlook

0
0

This Jupiter price prediction September 2026 arrives at a moment where the chart has quietly been telling a patient story.
An ascending trendline has been holding as support through repeated tests, and the way price responded to the most recent one is different from the last.
What looked like hesitation at first has turned into something that has traders paying much closer attention. Here's the full picture.
Position disclosure: This piece is prepared for informational purposes only. The author holds no position in JUP at the time of publication.
JUP Price Today: Live Data and 24-Hour Change
JUP is trading near $0.2180 on the weekly chart.
Separate live data from CoinGlass puts the coin around $0.2186, down close to 1.26% over the past 24 hours, with futures volume of $154.38 million against spot volume of $9.50 million and open interest at $56.71 million.
Market cap stands at $722.99 million on a circulating supply of 3.32 billion JUP against a total and max supply of 6.86 billion tokens, meaning close to 3.54 billion tokens, roughly 51.6% of the eventual max supply, remain outside current circulation.
Source: TradingView (JUP/USDT perpetual, Binance, weekly chart) and CoinGlass, both accessed August 25, 2026, IST.
JUP Holder Concentration Data
Holder concentration data shows JUP's top wallets skew heavily toward project-controlled addresses rather than independent whale investors.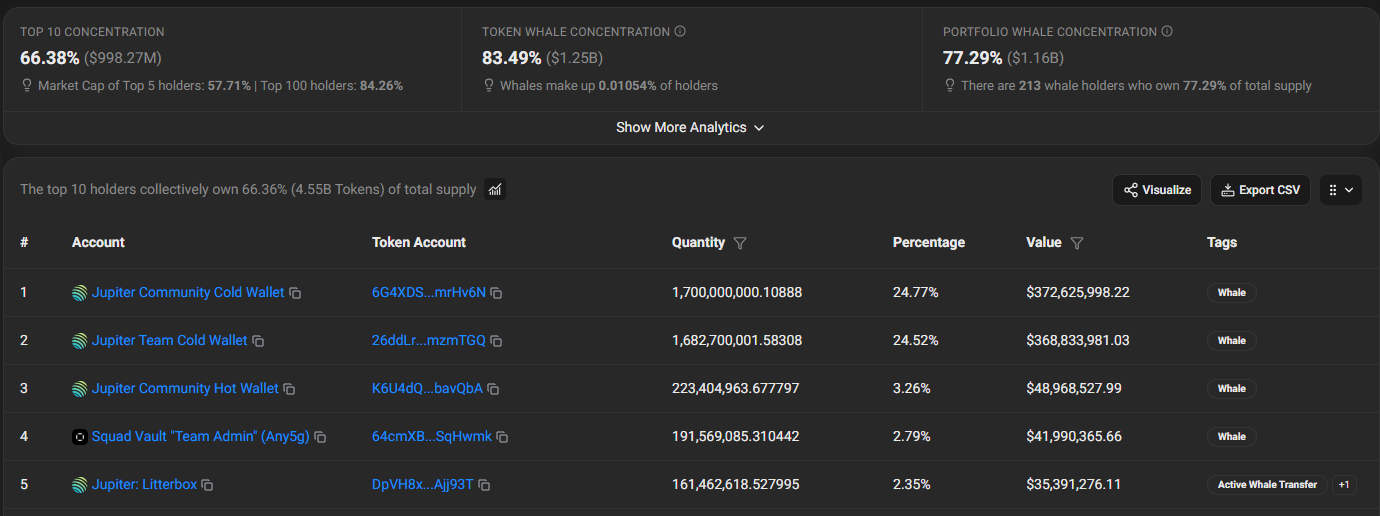
The top 10 holders combined control 66.38% of tracked supply, worth close to $998.27 million, with the top 5 alone accounting for 57.71% of market cap and the top 100 holders reaching 84.26%.
Broader whale-tier wallets, just 0.01054% of all holders, control 83.49% of tracked value, translating to 213 addresses holding roughly 77.29% of total supply.
Looking at the actual top holders, the largest positions belong to the Jupiter Community Cold Wallet and Jupiter Team Cold Wallet, each holding close to 24.5% to 24.8% of supply, alongside the Jupiter Community Hot Wallet and a Squad Vault team admin multisig.
These are largely project treasury and team-controlled addresses rather than external accumulation, which is an important distinction when reading concentration numbers for JUP coin.
Source: Solscan holder analytics, accessed August 25, 2026.
Quick Take
CMP: $0.2180
Weekly trigger: close above $0.2755, opens $0.4527, then $0.6839
Weekly failure: close below $0.1351 invalidates the bullish structure
Data as of August 25, 2026, IST
Short risk note: these levels come from the weekly chart and depend on confirmed weekly closes, not intraday wicks.
Leveraged positions around these zones carry liquidation risk if price whipsaws before a level is confirmed.
Jupiter Technical Forecast September 2026
JUP has been taking support from an ascending trendline for a while now, and the way price has responded to that trendline across its retests tells an interesting story.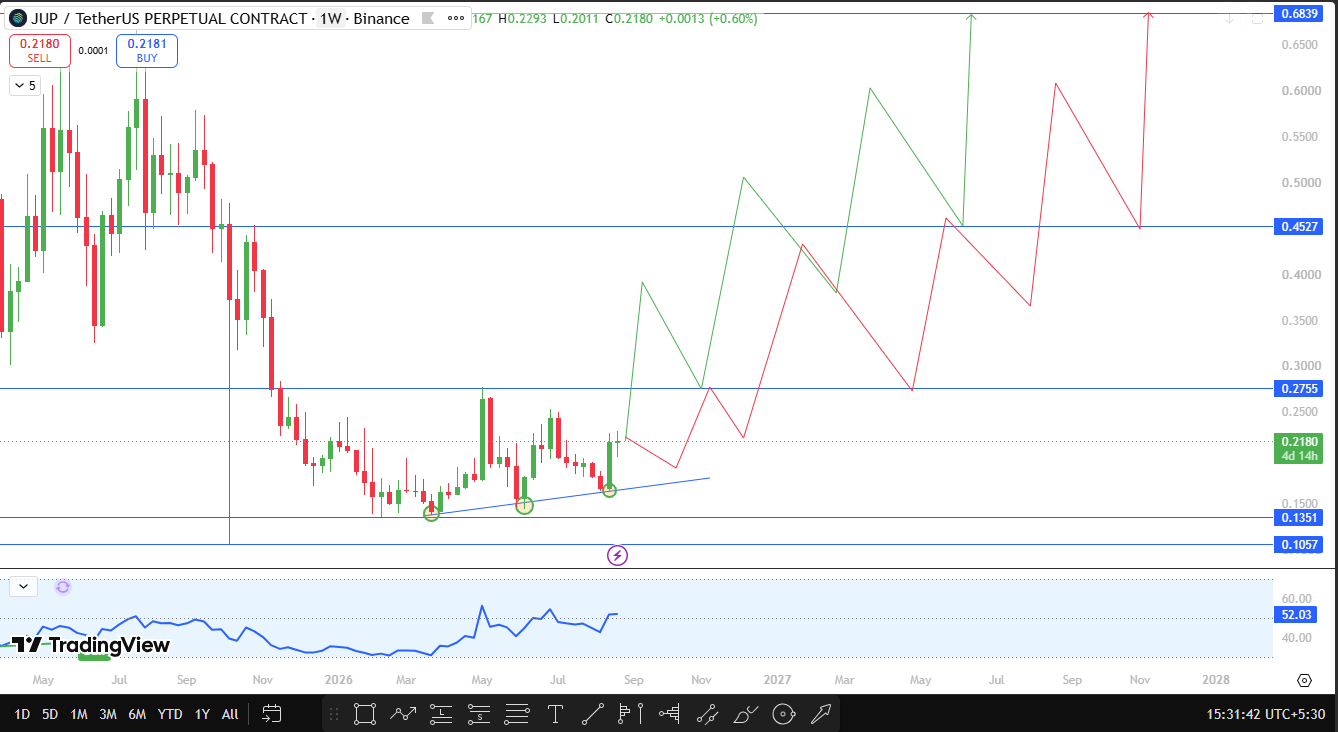
At the first retest, price held the trendline but failed to push through to a new high, a hesitant response that could have easily rolled over into another leg down.
At the second retest, the response was completely different. Price formed a large bullish candle right off the trendline, a much more decisive reaction that suggests buyers stepped in with real conviction rather than just defending the line passively.
That kind of escalating strength between retests, from hesitation to a decisive bullish candle, is often read as a sign that an uptrend is gaining momentum rather than losing it.
The chart's momentum indicator is currently reading near 52.03, sitting just above the midpoint, consistent with a market building strength without yet being overheated.
If JUP breaks and closes a weekly candle above $0.2755, roughly 26.38% above current price, it opens the door to $0.4527 as the next resistance, a level around 107.66% higher.
Beyond that, $0.6839 stands out as the major resistance on the chart, sitting close to 213.72% above the current price, and would mark a significant milestone for this JUP price forecast for September 2026 if the ascending trendline structure continues to hold.
On the downside, a weekly close below $0.1351, about 38.03% under current price, would invalidate this bullish setup entirely, suggesting the ascending trendline has finally failed to hold as support after multiple successful defenses.
Source: TradingView, JUP/USDT perpetual chart, 1-week timeframe, Binance, captured August 25, 2026, IST.
JUP Support and Resistance Levels to Watch
Level Type | Price | Change from CMP | Note |
Support | $0.1057 | -51.51% | Deeper swing low if the trendline breaks |
Support | $0.1351 | -38.03% | Weekly close below this invalidates the bullish setup. |
Resistance | $0.2755 | +26.38% | The weekly close above this confirms continuation. |
Resistance | $0.4527 | +107.66% | First target after breakout confirmation |
Resistance | $0.6839 | +213.72% | Major resistance |
JUP Price Prediction: Bull, Base, and Bear Cases
The base case has JUP continuing to grind along the ascending trendline through most of September, without a confirmed weekly close above $0.2755 or below $0.1351.
The bull case activates on a weekly close above $0.2755, which opens a path toward $0.4527 and eventually the major resistance at $0.6839.
This JUP technical analysis September 2026 case gets support from the increasingly decisive bullish reaction seen at the trendline's second retest, a pattern that often precedes a stronger breakout attempt.
The bear case needs a weekly close below $0.1351, which would break the ascending trendline that has supported this entire structure and put a deeper pullback in focus.
Every one of these JUP breakout prediction September 2026 scenarios depends on a confirmed weekly close, not a temporary wick through any level.
On-Chain and Fundamental Drivers
Jupiter's role as one of the largest DEX aggregators in the Solana ecosystem gives JUP a use case tied directly to trading volume and swap activity across the network, rather than pure speculation alone.
As long as Solana-based trading activity stays healthy, Jupiter's aggregator and perpetuals products have a built-in reason for continued relevance.
The concentration data is worth keeping in view here too.
With the largest holders being project treasury and team wallets rather than independent whales, JUP's float dynamics depend heavily on how and when those addresses choose to distribute or vest tokens, which is a different kind of risk than concentration driven by outside speculative accumulation.
September 2026 Catalysts
Traders will likely be watching whether JUP can build enough momentum off the ascending trendline to test $0.2755 in the coming weeks.
Beyond that, any movement from Jupiter's large community and team-controlled wallets, along with broader shifts in Bitcoin dominance, Solana ecosystem activity, and overall crypto market liquidity, could meaningfully influence this JUP price outlook September 2026 through the month.
Risks That Could Invalidate This Forecast
This bullish setup fails if JUP cannot close a weekly candle above $0.2755 and fails more seriously if the price closes below $0.1351, which would break the ascending trendline that has supported the price through multiple successful retests.
Broader risks include large movements from Jupiter's project-controlled treasury wallets, a slowdown in Solana ecosystem trading volume, shifts in Bitcoin dominance, macro liquidity conditions, and general crypto market volatility, any of which could override JUP's own chart structure regardless of where its levels sit.
Glossary
Ascending trendline: an upward-sloping line connecting a series of higher lows, used to track a prevailing uptrend
Trendline retest: a moment when price returns to touch a trendline again after an initial move away from it, testing whether it still holds
Weekly close: the final traded price when a weekly candle finishes, used to confirm whether a breakout or breakdown is genuine
Open interest: the total number of outstanding futures or options contracts that have not yet been settled
Support: a price zone where buying pressure has previously stepped in
Resistance: a price zone where selling pressure has previously capped upside
Invalidation level: the price point at which a forecast scenario is considered incorrect.
DEX aggregator: a protocol that routes trades across multiple decentralized exchanges to find the best available price
Disclaimer
This article is for informational purposes only and does not constitute financial advice. Cryptocurrency markets are highly volatile, and all price levels discussed are based on technical chart analysis, not a guarantee of future performance. Readers should conduct their own research before making any investment decisions.
0
0

 Gérez tous vos cryptos, NFT et DeFi à partir d'un seul endroit.
Connectez de manière sécurisée le portefeuille que vous utilisez pour commencer.