
RollX Price Prediction: Can This 161% Rally Actually Hold

0
0
Anyone searching for a RollX price prediction right now is landing in the middle of a story that changed overnight, and the chart alone won't tell you whether that's a story worth trusting.
Something clicked for ROLL in the last 24 hours that most holders never saw coming. The move came fast, it came loud, and it's already splitting opinion between traders calling it the next breakout play and skeptics who think the wallet data tells a very different story. So which side is right?
Why RollX Is Trending Today and What Happens After the Spike
RollX doesn't need an introduction the way it did a week ago. It's up over 161% in 24 hours, sitting near $0.1488, and every crypto screener with a "top gainers" tab now has it front and center.
Trading volume jumped over 400% in that same window. That's not noise, and it's landed during a stretch where broader altcoin market moves have been unusually sharp across smaller-cap tokens.
But volume alone doesn't explain a move like this, and neither does hype. Part of it lines up with crypto market rally today more broadly this week, but that's not the whole picture either. There's more underneath it, some encouraging, some genuinely concerning, and we'll walk through both.
Where this goes next depends less on the chart pattern and more on who's actually holding the supply. Keep that in mind as you read on.
KEY TAKEAWAYS
Direction: Short-term momentum is bullish and overheated; long-term outlook is high-risk due to extreme supply concentration.
Why it moved: A 24h volume surge of over 400% pushed ROLL out of a multi-week base and into a parabolic breakout.
Near-term range: Roughly $0.109 to $0.196 while the current structure holds.
Invalidation: A daily close below $0.057 breaks the bullish weekly channel and flips the setup bearish.
Coin Overview
Metric | Value (as of Jul 21, 2026) |
Name / Ticker | RollX / ROLL |
Blockchain | Base |
Contract Address | 0xab6363da0c80cef3ae105bd6241e30872355d021 |
Price | $0.1488 (+161.37% 24h) |
Market Cap | $23.07M |
Fully Diluted Valuation (FDV) | $148.87M |
24h Volume | $1.34M (+408.78%) |
Vol/Mkt Cap (24h) | 4.74% |
Liquidity/Mkt Cap | 7.83% |
Circulating Supply | 155M ROLL |
Total / Max Supply | 1,000,000,000 ROLL |
Holders | 50,328 |
CertiK Rating | 4.2 / 5 (audited) |
All-Time High | $0.1857 (Jul 21, 2026) |
All-Time Low | $0.02131 (May 18, 2026) |
Data pulled from live RollX market data and the RollX Base token contract. Prices move fast, so treat anything more than a few hours old as historical.
Technical Analysis: What's Driving the Move
FDV, TVL, RSI, EMA Quick definitions: FDV is what the market cap would be if every token that will ever exist were already in circulation. RSI measures how overbought or oversold a token is on a 0-100 scale. EMA is a moving average that weights recent price action more heavily than older data.
On the 1-hour RollX chart, ROLL broke out of a multi-day base on a huge volume spike, then coiled into what's shaping up as a bullish pennant, a tight consolidation after a sharp move that often (not always) resolves in the direction of the original breakout.
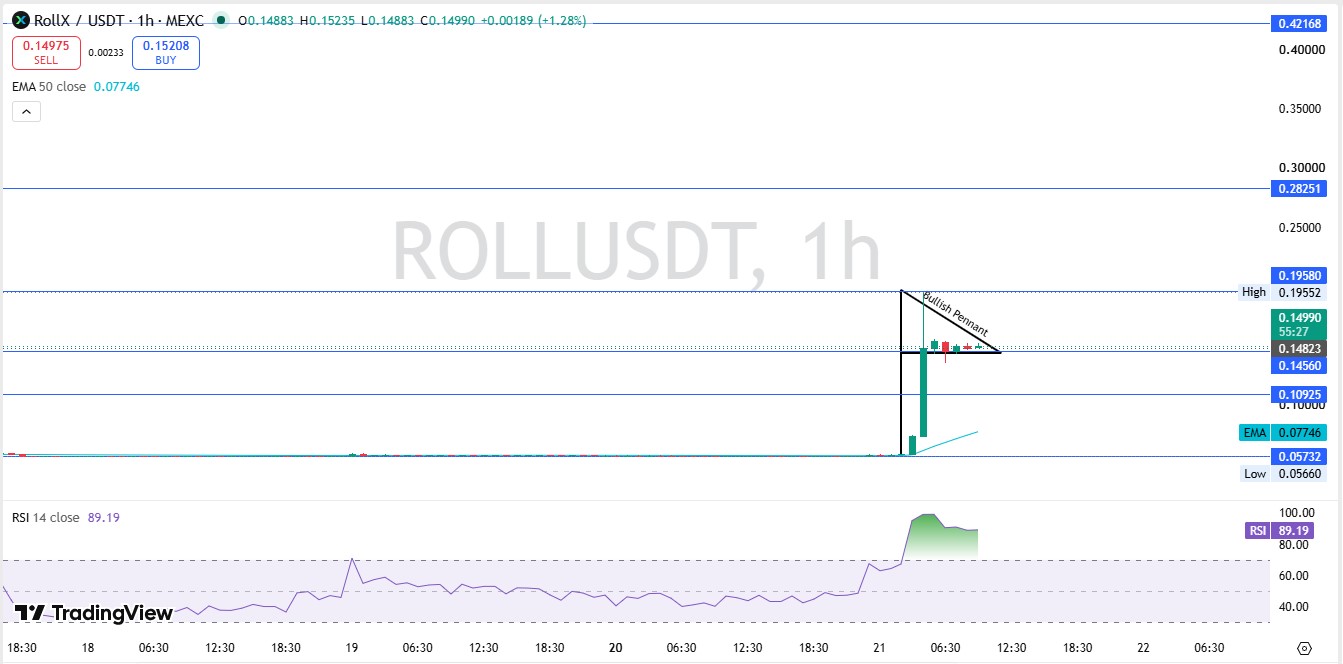
RSI on the 1-hour is sitting at 89.19. That's deep, overbought territory.
Here's the thing: overbought doesn't mean "sell now." It means the move is stretched, and stretched moves either consolidate or snap back hard. There's rarely a middle ground.
Zooming out to the weekly ROLL chart structure, ROLL has been carving an ascending channel since May, and this week's candle pushed price to the top of that channel. Weekly RSI reads 63.62, which is healthy, not extreme.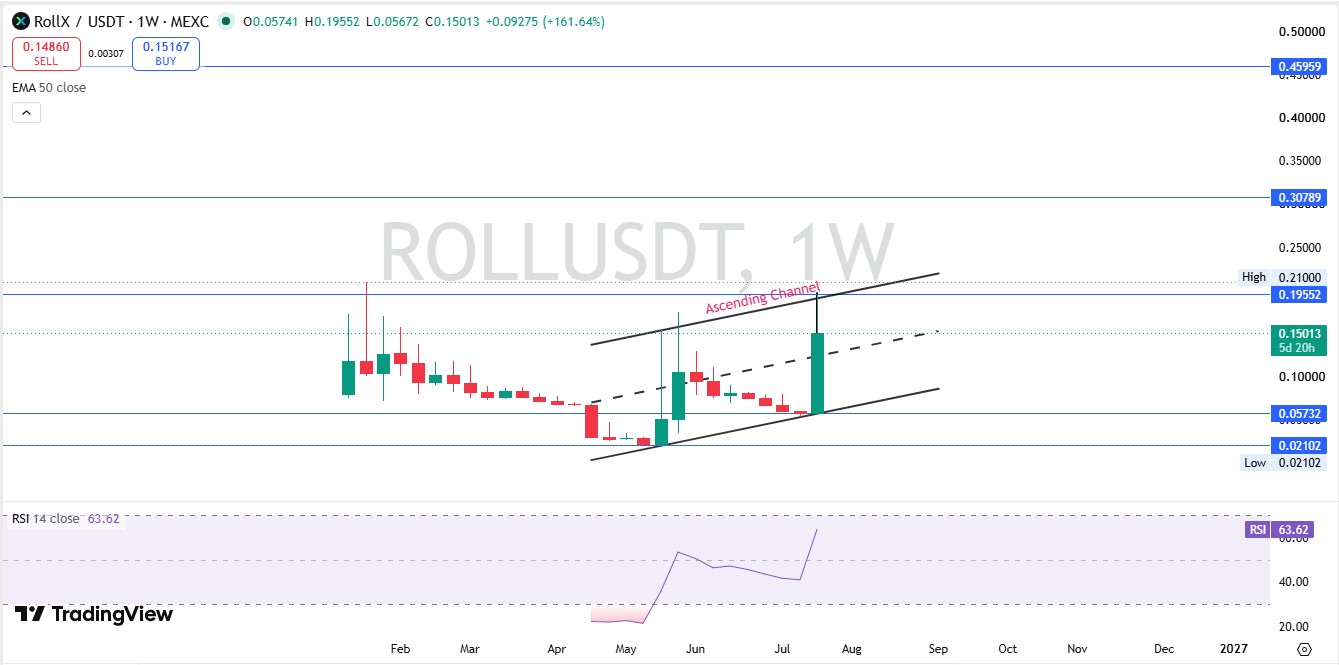
That gap between an exhausted 1-hour RSI and a calm weekly RSI matters. It tells us the pump is a short-term event sitting on top of a longer, more gradual uptrend. The daily chart is where you'd want to watch for the next real signal.
Key levels on the current structure:
Immediate resistance: $0.1958 (1h swing high), then $0.2825
Immediate support: $0.1093, followed by $0.0573
Weekly channel resistance: roughly $0.30 to $0.46
Weekly channel support: roughly $0.021 to $0.057
And no, none of these levels guarantee anything. They're where reactions have happened before, not where they must happen again.
On-Chain Reality Check: The Number That Should Slow You Down
We pulled the holder data expecting a normal, if slightly concentrated, distribution. What we found, checked directly against the RollX holder wallet data, was not that.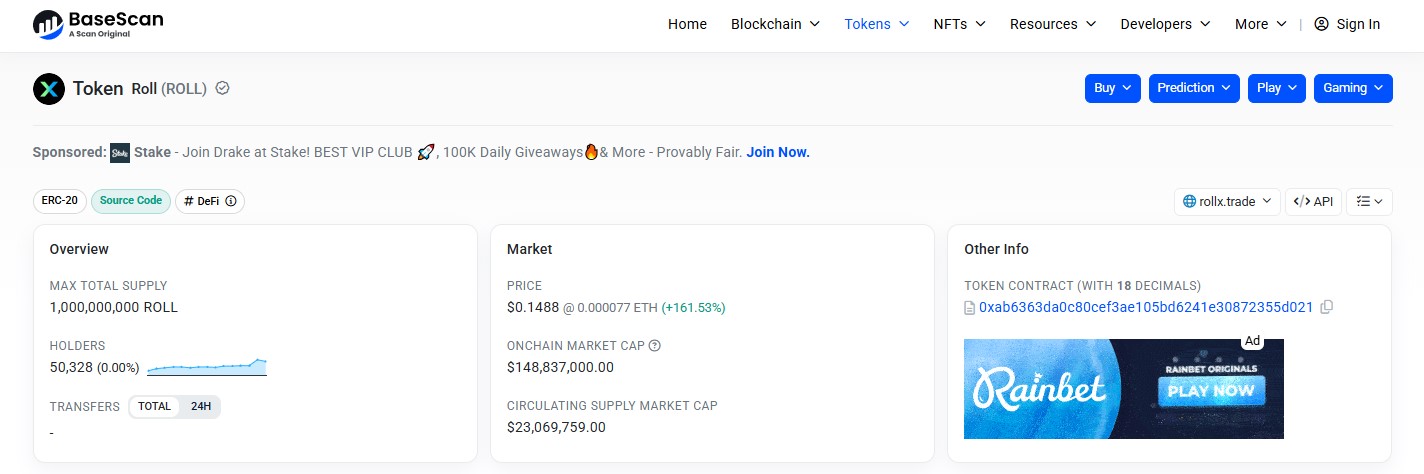
One single wallet holds 84.50% of the entire ROLL supply. That's 845,000,001 tokens, worth roughly $125.7 million at the FDV price, sitting in one unlabeled address.
Turns out the concentration problem doesn't stop there. Top 100 wallets control 96.59% of supply. Whale-tier wallets, just 114 addresses out of over 50,000 holders, control 96.73% of total value. The Gini distribution score sits at 0.9989, where 1.0 would mean a single wallet owns everything.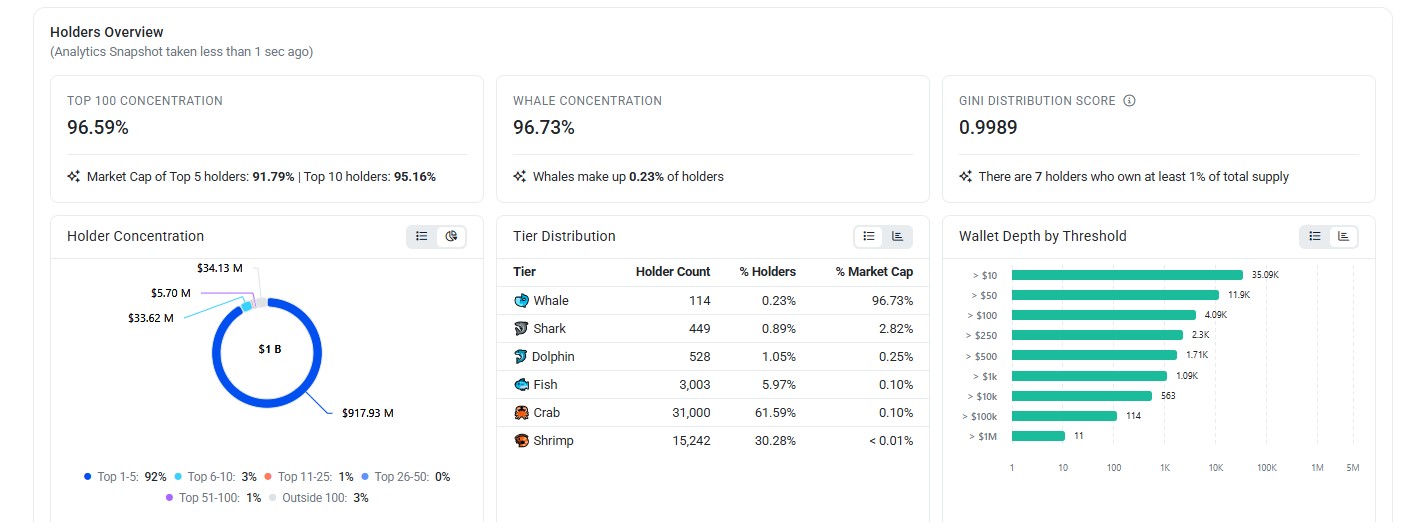
Basically, the other 50,000+ holders are splitting scraps.
To be fair, not every large wallet is a red flag. The fifth-largest holder is the Uniswap V4 Pool Manager, holding about 1.09% of supply, which is just liquidity doing its job. That one's fine.
The top wallet is different. It's unlabeled, it's not a known exchange or liquidity contract, and it holds more than eight times what the next nine largest wallets hold combined. If that wallet is a team, treasury, or early-investor allocation without a public vesting schedule, a single transaction could crush this chart in minutes. We couldn't find a published unlock schedule confirming otherwise, and that absence is itself the risk. Assume it's unlocked until proven locked.
This is the single most important data point in this entire article. Everything else is secondary to it.
Original Analysis: Holder Concentration vs. Liquidity Depth
Here's an angle most trackers won't hand you directly. We compared the top wallet's holdings against the pool's actual liquidity.
Liquidity sits at 7.83% of market cap, or roughly $1.8M against a $23.07M market cap, per current RollX liquidity figures. The top wallet's position is worth over $125M at current FDV pricing, more than 65 times the size of total liquidity.
What that means in practice: that wallet could not exit its full position through this pool without collapsing the price by an extreme margin. Either it never moves, it moves through OTC deals, or it moves in a way that devastates every holder still in the pool when it does. There isn't a fourth outcome that's good for retail holders.
Fine. That's the risk laid bare. Now let's talk fundamentals, because there's a legitimate side to this story too.
Fundamentals: What's Actually Real Here
RollX is built on Base, Coinbase's Ethereum layer-2, which at minimum means it inherits Base's cheaper fees and faster settlement versus mainnet Ethereum. How the wider Ethereum ecosystem performs tends to filter down into activity and liquidity on base-based tokens like this one. The contract carries a CertiK audit with a 4.2-star rating, which is a genuine trust signal. Audits don't eliminate whale risk, but they do rule out a large category of smart-contract exploits.
The project markets itself around prediction, gaming, and play-related products (based on the navigation labels on its own token page: Prediction, Play, Gaming). Moves like this often line up with periods when capital rotating into altcoins, which can inflate small-cap volume without reflecting real product demand. We don't have independently verified usage, revenue, or TVL data for these products at the time of writing, so we're not going to invent numbers that don't exist. If you're evaluating this as a long-term hold, that missing fundamental data is a gap you need to fill yourself before committing capital, not something to take on faith.
Tokenomics and Supply Risk
Total and max supply are both fixed at 1 billion ROLL, so there's no ongoing inflation from new minting. Circulating supply currently sits at 155 million, about 15.5% of max supply, based on on-chain supply data verified directly against the contract.
That gap between circulating and max supply, combined with an FDV of $148.87M against a $23.07M market cap, is the second red flag here. Roughly 84.5% of total supply exists outside the current circulating figure, and we already know where the overwhelming majority of it sits: that one wallet.
We found no public vesting or unlock schedule for this token. If one exists and isn't publicly listed on standard trackers, that's a transparency problem on its own. Treat any long-term price target here as conditional on that supply staying put, because if it doesn't, none of the technical levels above will matter.
Historical Context
ROLL printed its all-time high of $0.1857 just four hours before this data was pulled, meaning the price is currently trading about 19.65% below a high made earlier the same day, according to ROLL's all-time high data. That's a fast round trip, not a slow grind to new highs.
The all-time low of $0.02131 was set on May 18, 2026, roughly two months ago. From that low to today's price, ROLL is up over 600%. The weekly chart shows this wasn't a straight line; there was a real drawdown back toward the $0.02 to $0.06 zone in June before the current leg started.
That prior base-and-breakout pattern is part of why the ascending channel on the weekly chart looks technically legitimate. It's also exactly the kind of chart that low-float, whale-controlled tokens can produce without any organic demand behind them. Both explanations fit the same candles.
Scenarios: Bull, Base, and Bear
Using the same bull-bear base case approach we apply across major assets, here's how ROLL's setup breaks down:
Scenario | Conditions | Target | Timeframe | Invalidation |
Bull Case | The top wallet stays inactive, weekly channel holds, volume stays elevated, and the broader crypto market stays risk-on | $0.28 to $0.46 (top of weekly channel) | 3 to 6 months | Daily close back below $0.11 with falling volume |
Base Case | Price consolidates inside the current channel, whale wallet stays dormant but unresolved, volume normalizes | $0.11 to $0.20 range-bound | 1 to 3 months | Break of either channel boundary on volume |
Bear Case | Top wallets move any meaningful percentage of its position, or broader markets turn risk-off | $0.02 to $0.057 (retest of prior range) | Days to weeks if triggered | Recovery only if price reclaims $0.11 and holds it for multiple days |
The bear case here isn't theoretical padding. With one wallet controlling more value than the entire liquidity pool can absorb, it's the most realistic tail risk on this entire list, more realistic, honestly, than the bull case playing out cleanly.
What Would Actually Change This Thesis
Bullish confirmation: A daily close above $0.1958 on volume higher than the current 24h average, holding for 48 hours.
Key support to watch: $0.1093 on the hourly and $0.0573 on the weekly.
Hard invalidation: A daily close below $0.0573, which breaks the multi-month ascending channel entirely.
Fundamental invalidation: Any on-chain movement out of the top wallet exceeding roughly 2-3% of total supply. Given the liquidity depth, even a small transfer from that address is meaningfully different from normal chart noise and worth checking BaseScan for directly rather than relying on price action alone. It's also worth tracking the crypto events calendar for any scheduled unlocks or listings that could move that wallet.
RollX Long-Term Outlook: The Honest Version
Long-term, technically, is where this gets uncomfortable, because most of what would make a strong long-term case, usage data, revenue, and a transparent unlock schedule doesn't currently exist in public form for this token.
The chart structure is legitimate. The audit is real. The base ecosystem tailwind is real.
None of that offsets one wallet holding 84.5% of supply against 7.83% liquidity depth.
We're not calling this a scam. We don't have evidence for that claim and won't make it. What we can say plainly is that any long-term price prediction for RollX carries a level of concentration risk well above typical mid-cap tokens, and that risk should weigh more heavily in your decision than any single technical target on this page. Speculative long-term targets like the bull case above assume that risk never materializes, and that's a real assumption, not a given. For comparison against larger, more liquid assets, see our broader crypto price predictions coverage.
Disclaimer: This article is for informational purposes only and isn't financial advice. Crypto markets are volatile, and low-liquidity tokens with concentrated holder bases carry elevated risk of sharp, sudden price moves. Verify all figures independently before making any trading decision. Data sourced from CoinMarketCap, BaseScan, and TradingView (MEXC feed) as of July 21, 2026.
0
0

 Tüm kripto, NFT ve DeFi varlıklarınızı tek bir yerden yönetin
Kullanmaya başlamak için portföyünüzü güvenli bir şekilde bağlayın.