Ethereum Network Activity Hits Yearly Lows as Inflation Risks Mount

0
0


User activity on the Ethereum network has continued to decline, signaling weakening demand for the Layer-1 (L1) blockchain.
On Sunday, daily active addresses and new wallet creations fell to their lowest levels of the year, highlighting a steep drop in on-chain engagement.
Ethereum Network Activity Crashes to YTD Lows as Inflation Risks Grow
According to Glassnode, the daily count of active addresses involved in ETH transactions plunged to a year-to-date low of 361,078 on Sunday.
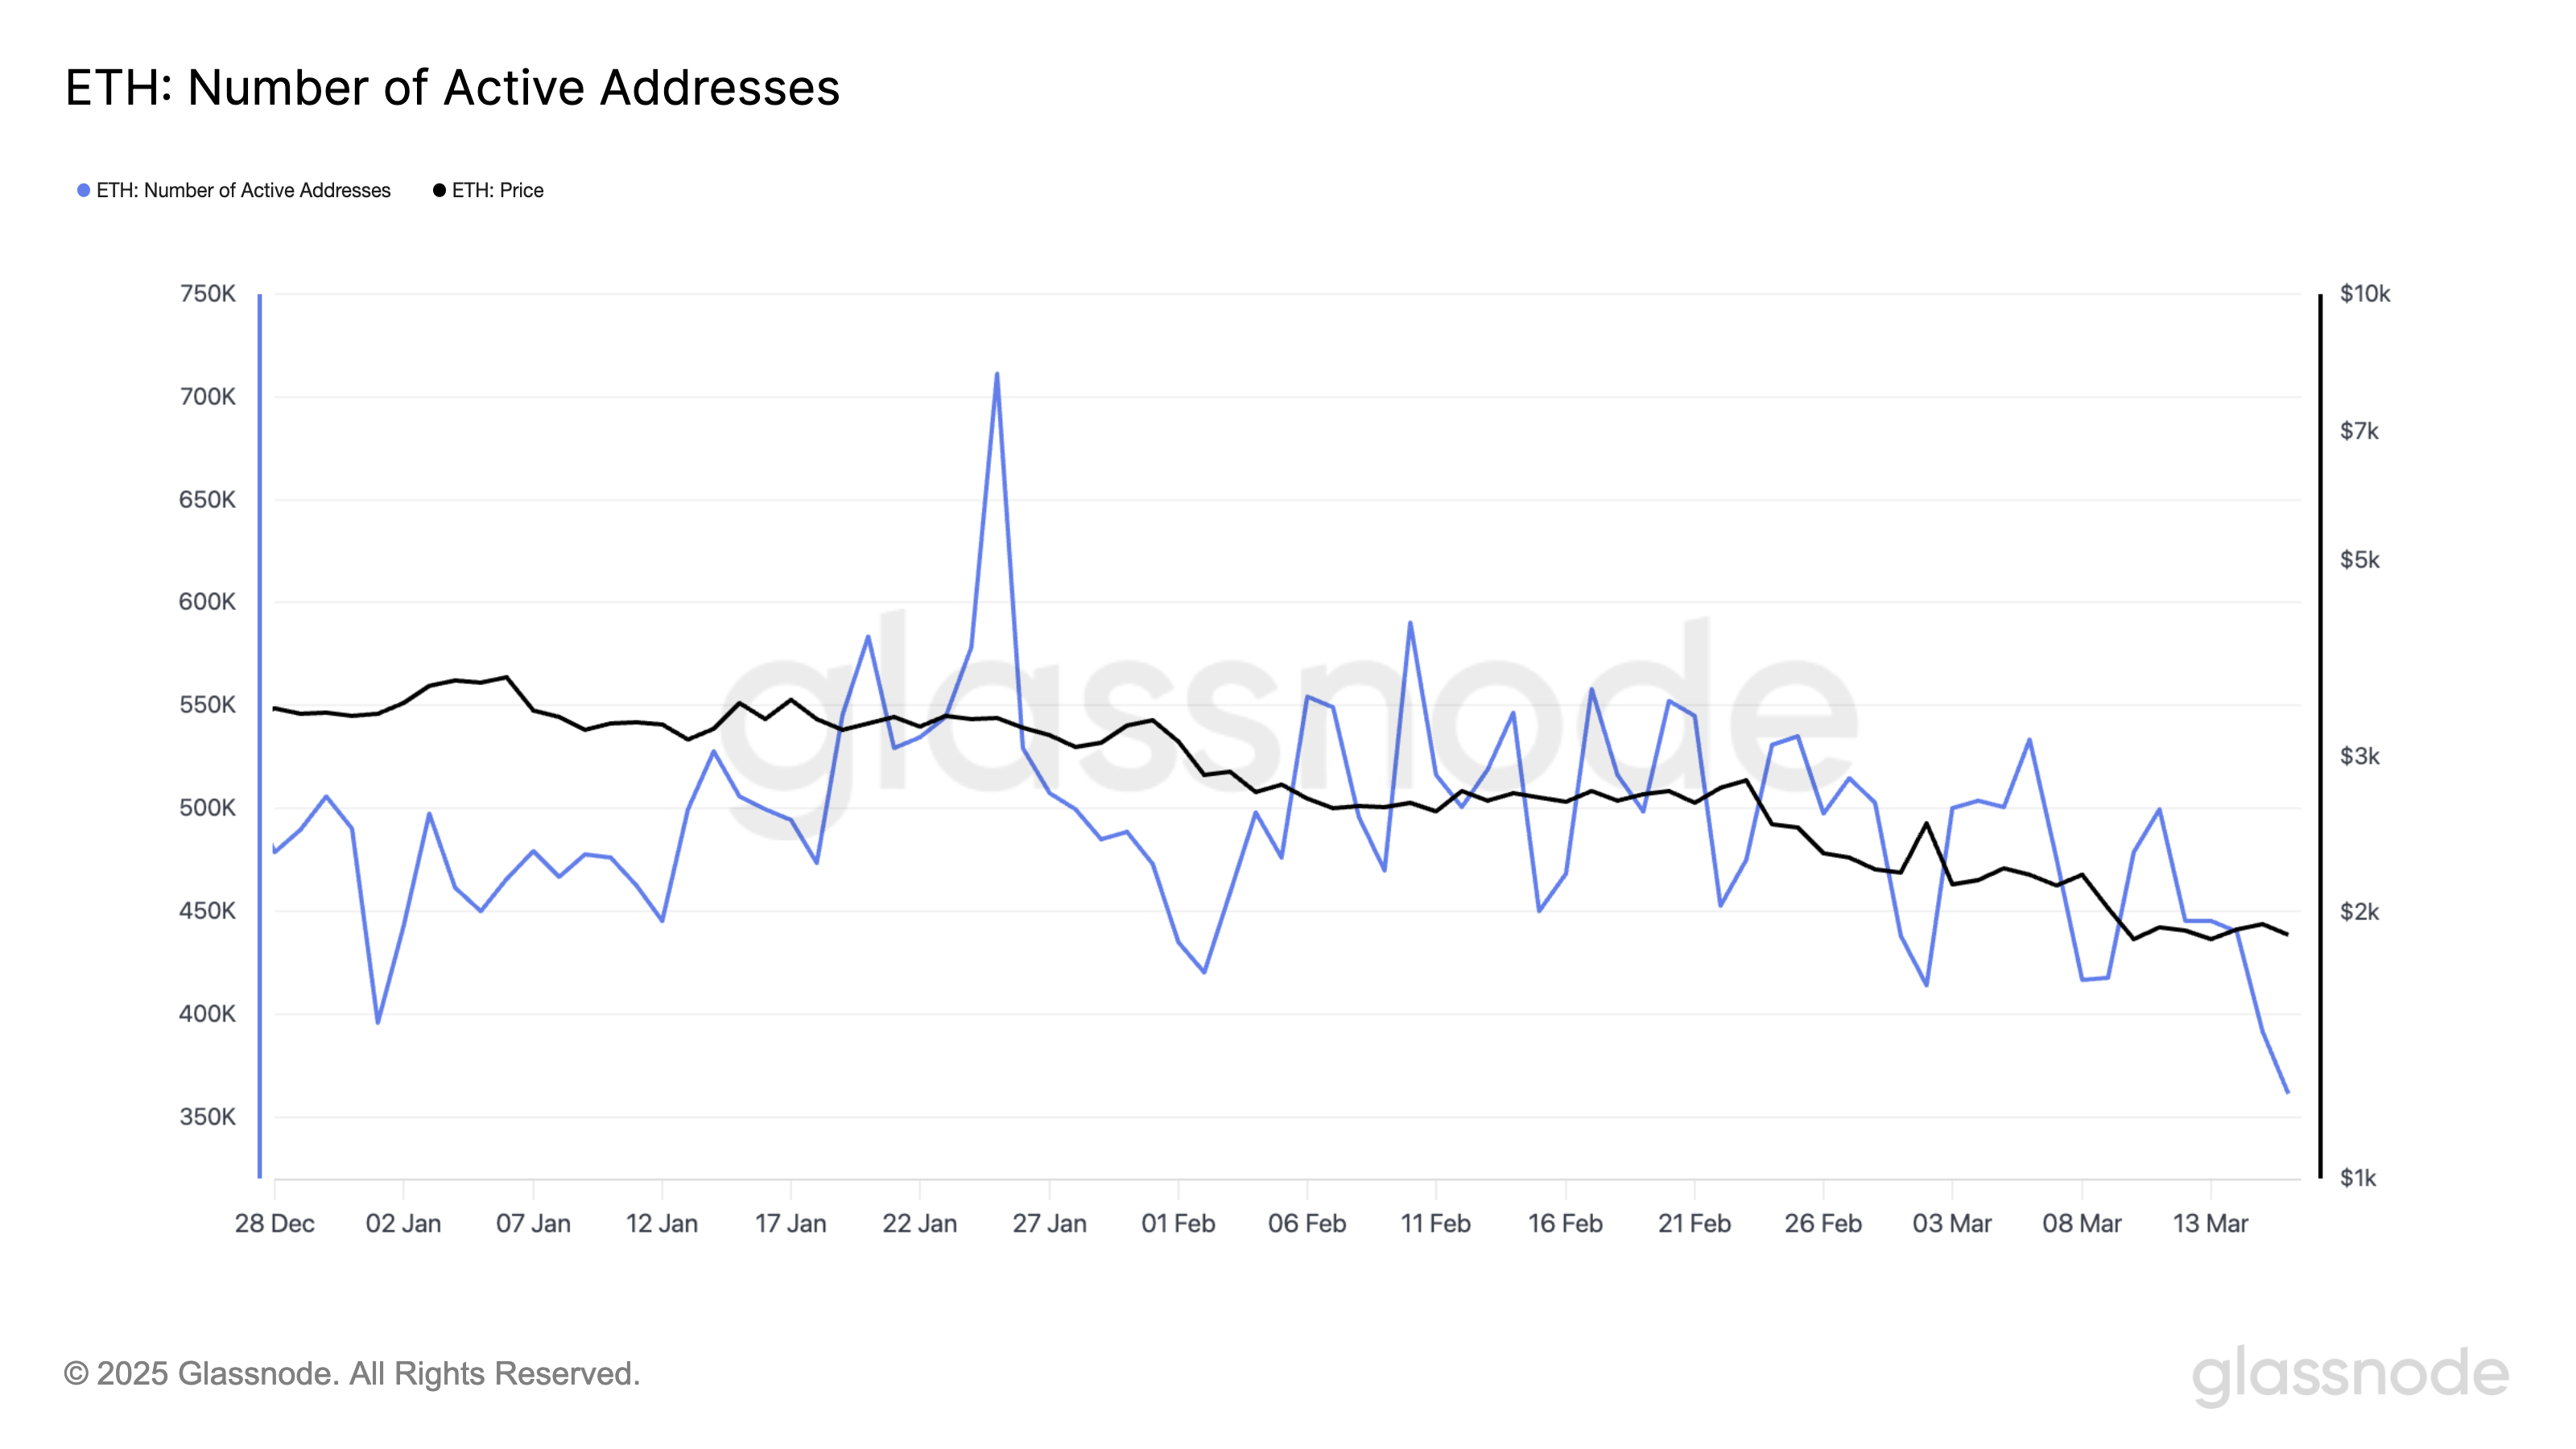 ETH Number of Active Addresses. Source: Glassnode
This drop signals declining user engagement and reduced on-chain activity. It often leads to lower transaction fees, decreasing the amount of ETH burned and making the asset more inflationary.
If the trend persists, it could lower investor confidence, reduce the network’s adoption, and increase the downward pressure on ETH’s price.
Further, new demand for the Ethereum network has also waned. Per Glassnode, the count of new wallets created to trade ETH totaled 86,539 addresses on Sunday, marking its lowest daily count since the beginning of the year.
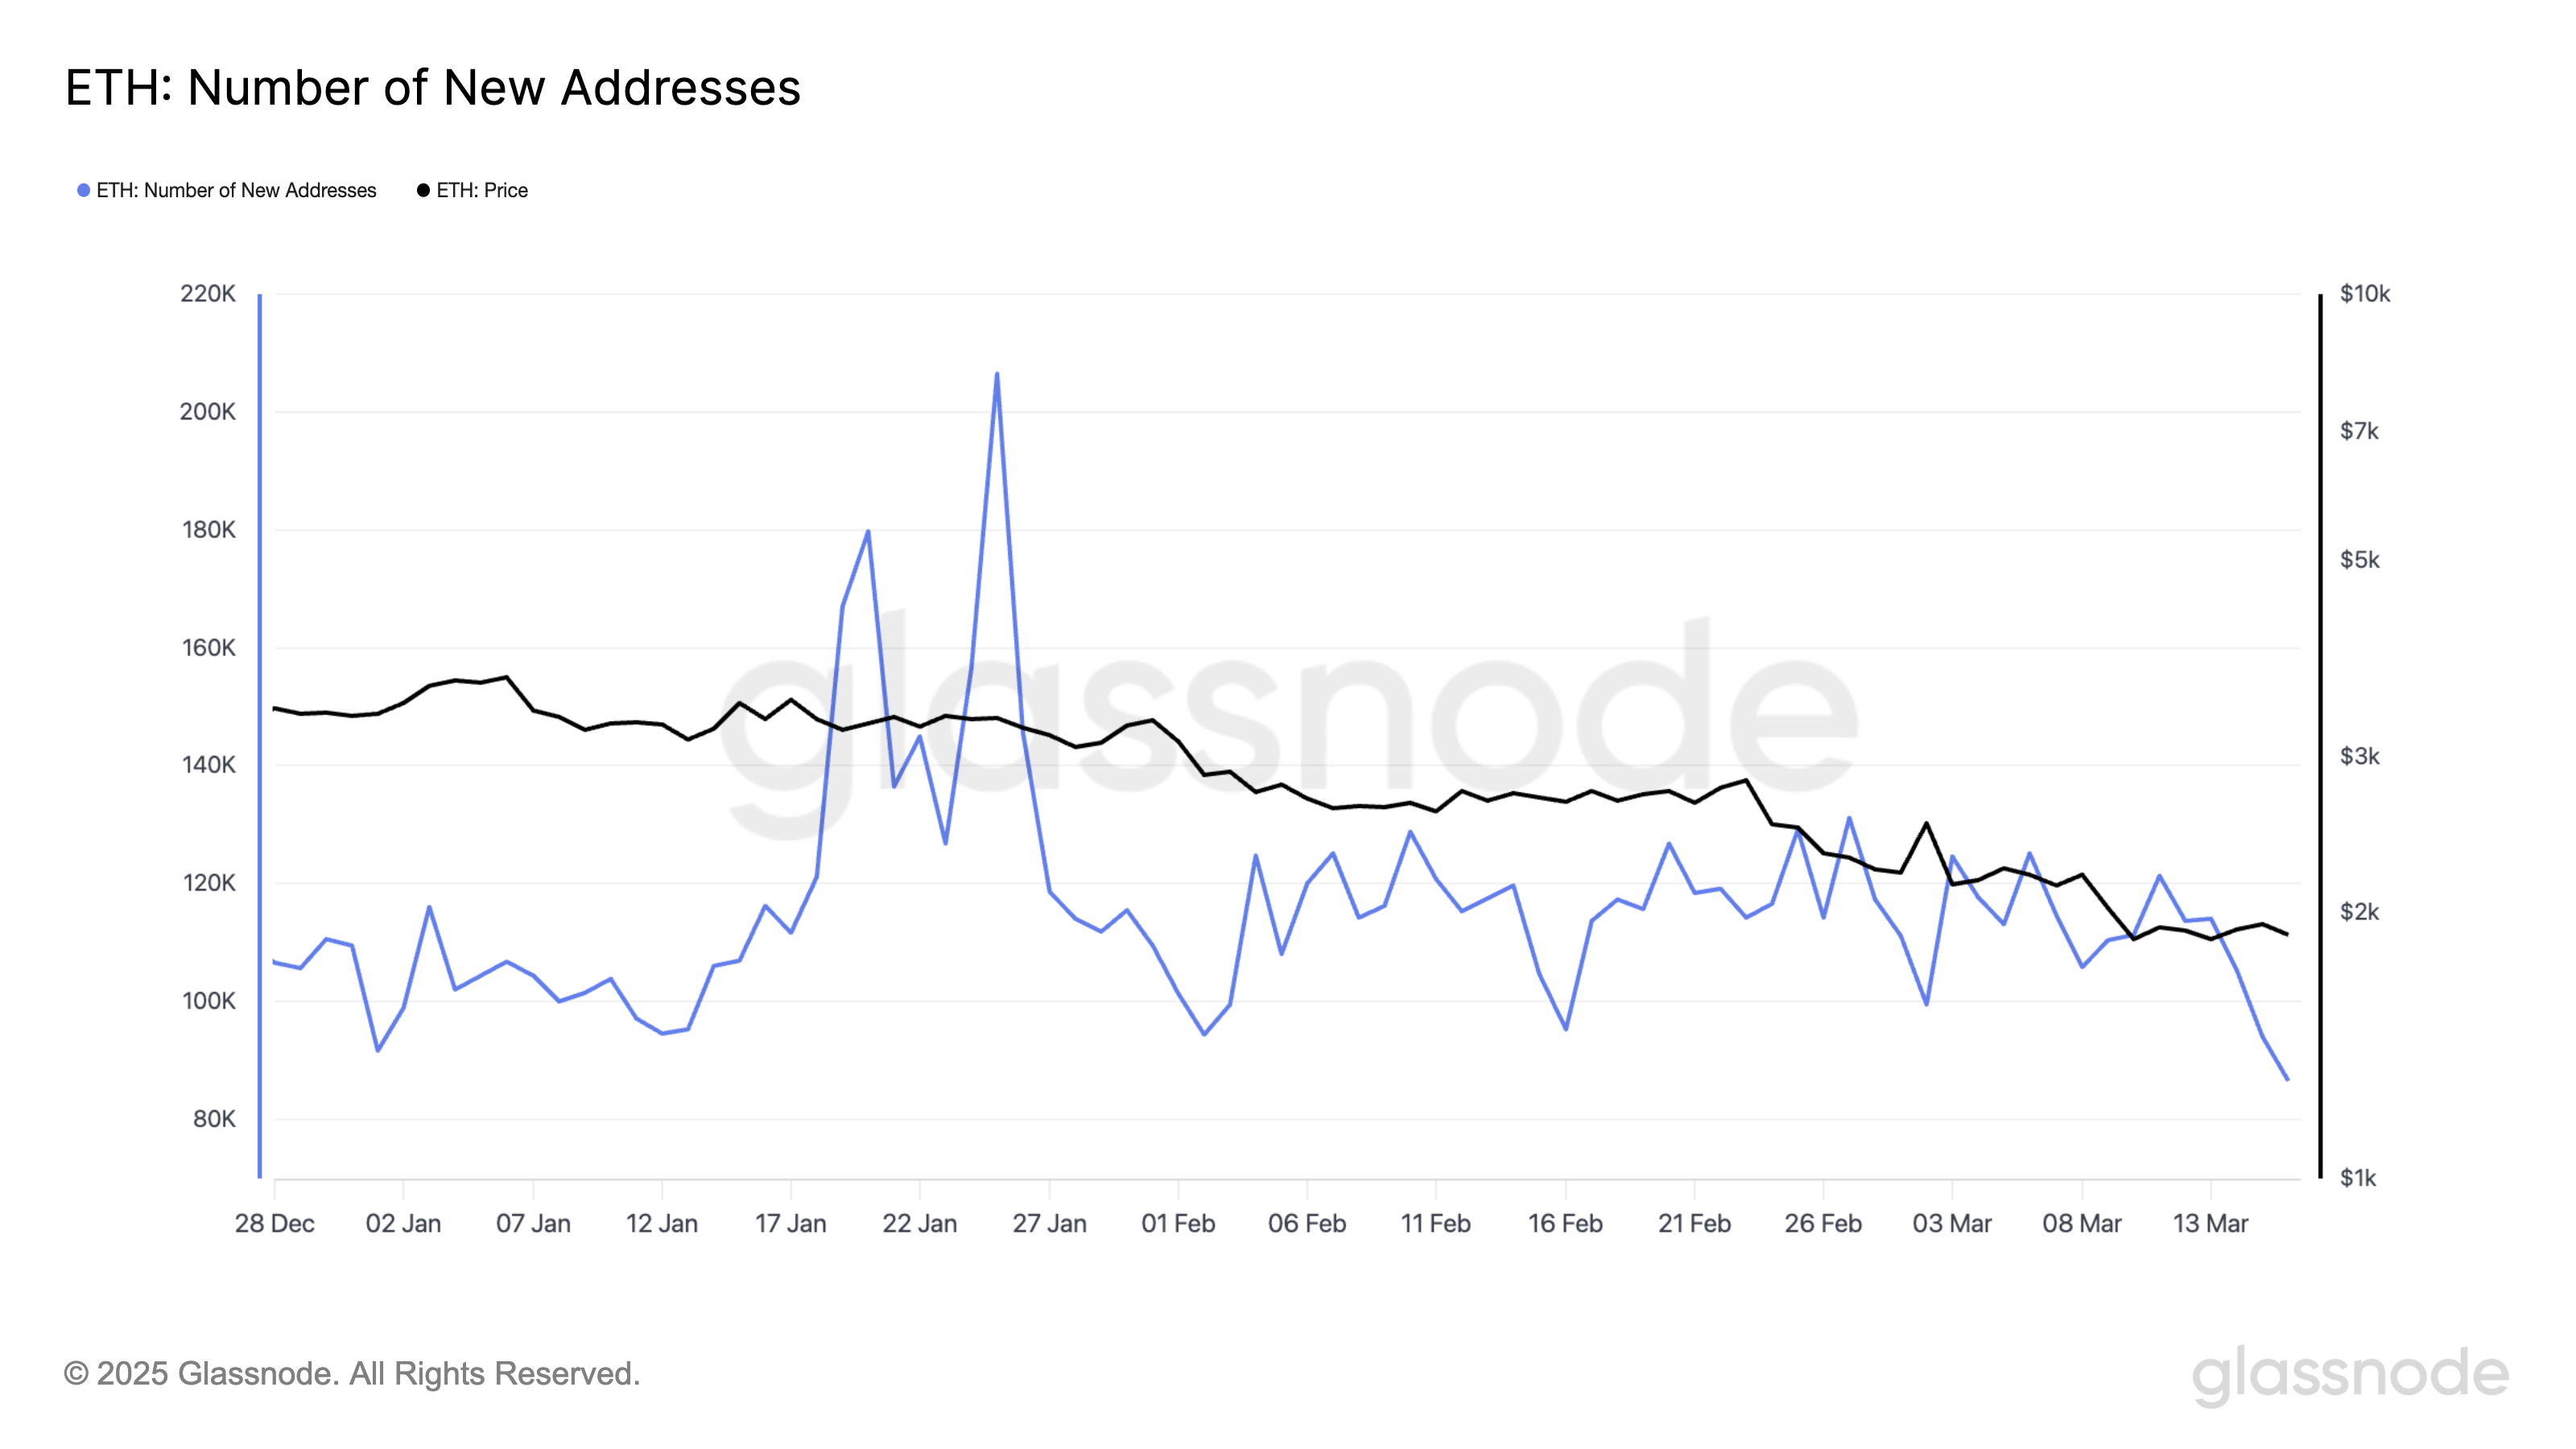 ETH Number of New Addresses. Source: Glassnode
This decline in network participation has intensified ETH’s inflationary pressures, with the total circulating supply surpassing 120 million ETH. In the past 30 days, 71,172 ETH valued above $135 million at current market prices have been added to the coin’s circulating supply.
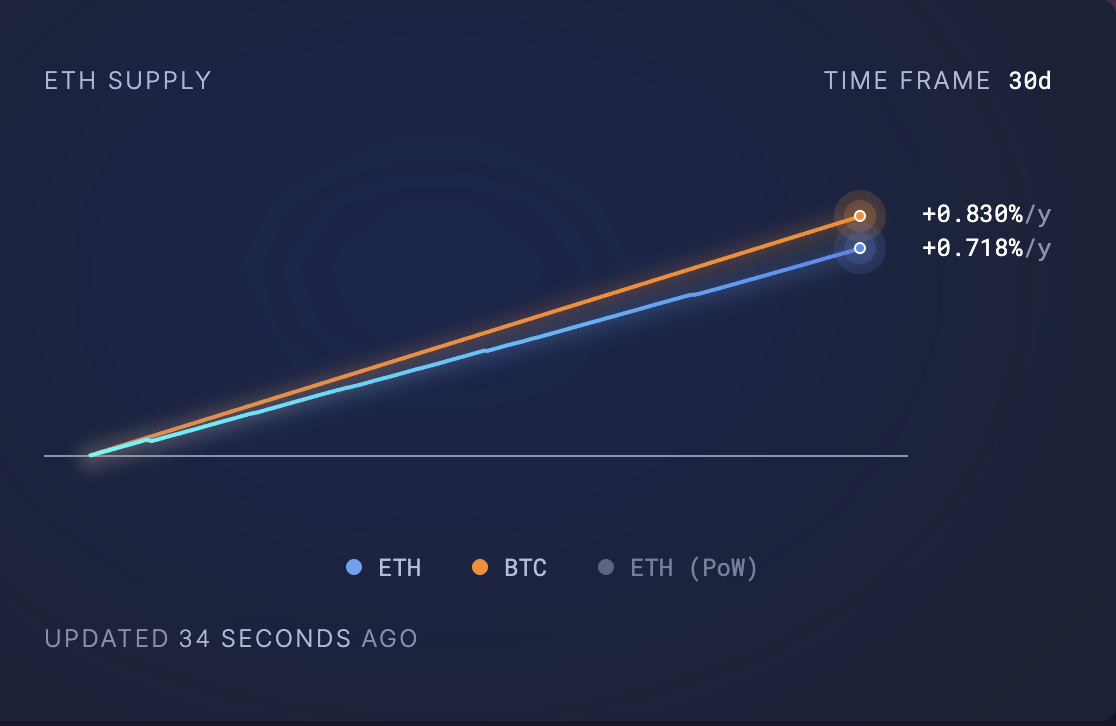 ETH Supply. Source: Ultra Sound Money
With fewer transactions and interactions occurring on-chain, the lack of demand to absorb the growing supply has increased the downward pressure on ETH’s price.
ETH Nears Oversold Levels as Demand Wanes—What’s Next for the Altcoin?
The decline in activity on the Ethereum network has impacted the demand for the altcoin in recent weeks, leading to a price drop. ETH currently trades at $1,898, noting a 30% price fall over the past month.
The downward trend observed in ETH’s Relative Strength Index (RSI) on the daily chart captures the weakening buying pressure among market participants. At press time, this momentum indicator is at 34.70.
The RSI indicator measures an asset’s oversold and overbought market conditions. It ranges between 0 and 100, with values above 70 indicating that the asset is overbought and due for a decline. Conversely, values under 30 indicate that the asset is oversold and could witness a rebound.
At 34.70, ETH’s RSI indicates significant selling pressure. It suggests that there is room for more price declines before the coin becomes oversold and witnesses a positive correction.
If this price dip continues, ETH risks plummeting to $1,758.
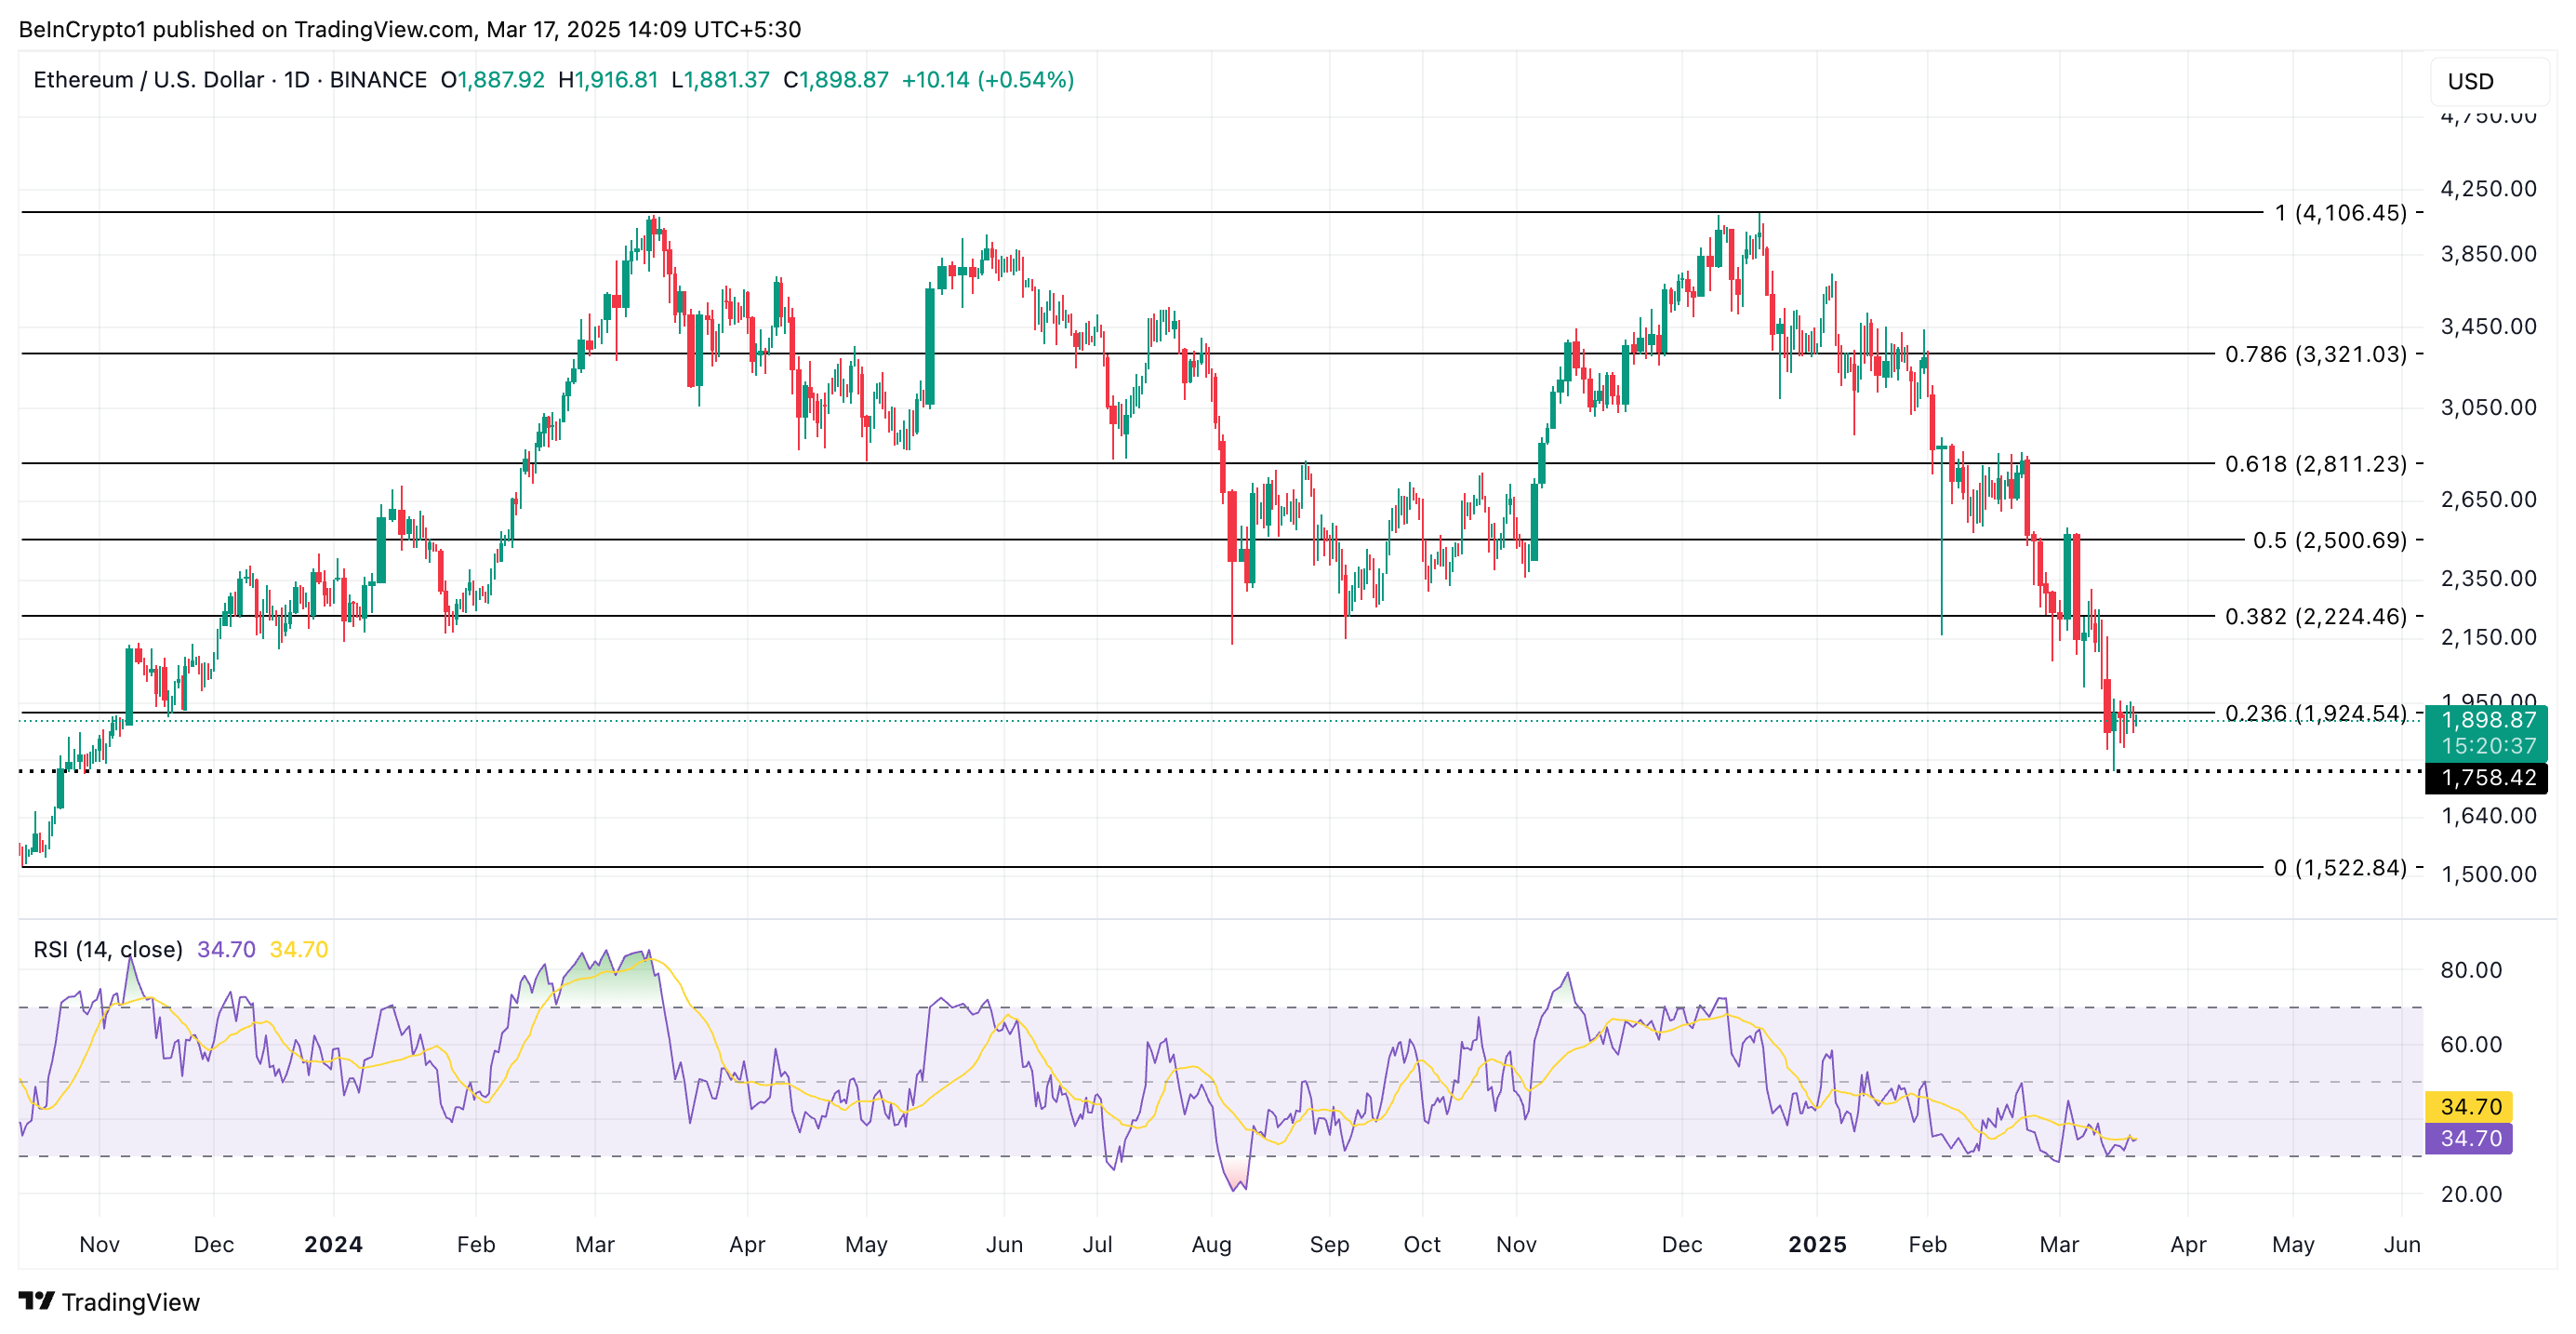 ETH Price Analysis. Source: TradingView
On the other hand, if demand rallies, ETH’s price could break above $1,924 and climb toward $2,224.
0
0


 Administra todas tus criptomonedas, NFT y DeFi desde un solo lugar
Para comenzar, conecta de forma segura el portafolio que estés utilizando.

0
0


0
0