Arbitrum price prediction 2026 – 2032: Will ARB reach $1?

0
0

Key takeaways:
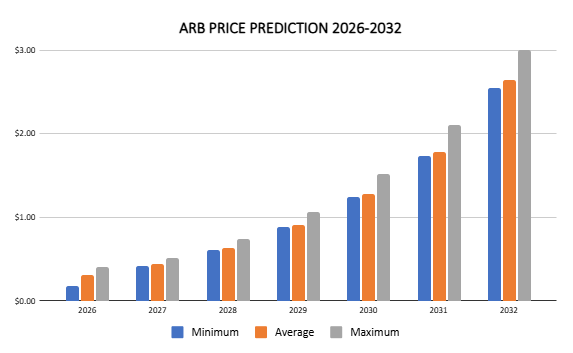
- Our ARB predictions anticipate a high of $0.41 in 2026.
- In 2028, the range is expected to be between $0.61 and $0.74, with an average price of $0.63.
- In 2030, it will range between $1.24 and $1.52, with an average price of $1.28.
Layer 2s have generated considerable buzz for their efficiency. Arbitrum is in the top 5 pack, with a total value locked (TVL) of $1.91 billion. Arbitrum is an Optimistic Rollup solution that shifts network operations away from the Ethereum mainnet while maintaining Ethereum-level security.
Is Arbitrum a good investment? Will it go up? Where will it be in 5 years? Let’s answer these questions and more in our Arbitrum price prediction.
Overview
| Cryptocurrency | Arbitrum |
| Ticker | ARB |
| Current Arbitrum price | $0.09523 |
| Market cap | $575.94M |
| Trading volume | $60.60M |
| Circulating supply | 6.04B |
| All-time high | $2.40 on Jan 12, 2024 |
| All-time low | $0.08861 on Feb 23, 2026 |
| 24-hour high | $0.09636 |
| 24-hour low | $0.08983 |
Arbitrum price prediction: Technical analysis
| Metric | Value |
| Volatility (30-day variation) | 5.20% (High) |
| 50-day SMA | $0.1011 |
| 200-day SMA | $0.2252 |
| Sentiment | Bearish |
| Green days | 17/30 (57%) |
| Fear and Greed Index | 13 (Extreme Fear) |
Arbitrum price analysis
On April 6, Arbitrum’s price rose by 5.20% in 24 hours and was down by 3.26 over the last 30 days. The recent recovery was accompanied by a rise in trading volumes (55.55%).
ARB 1-day chart analysis
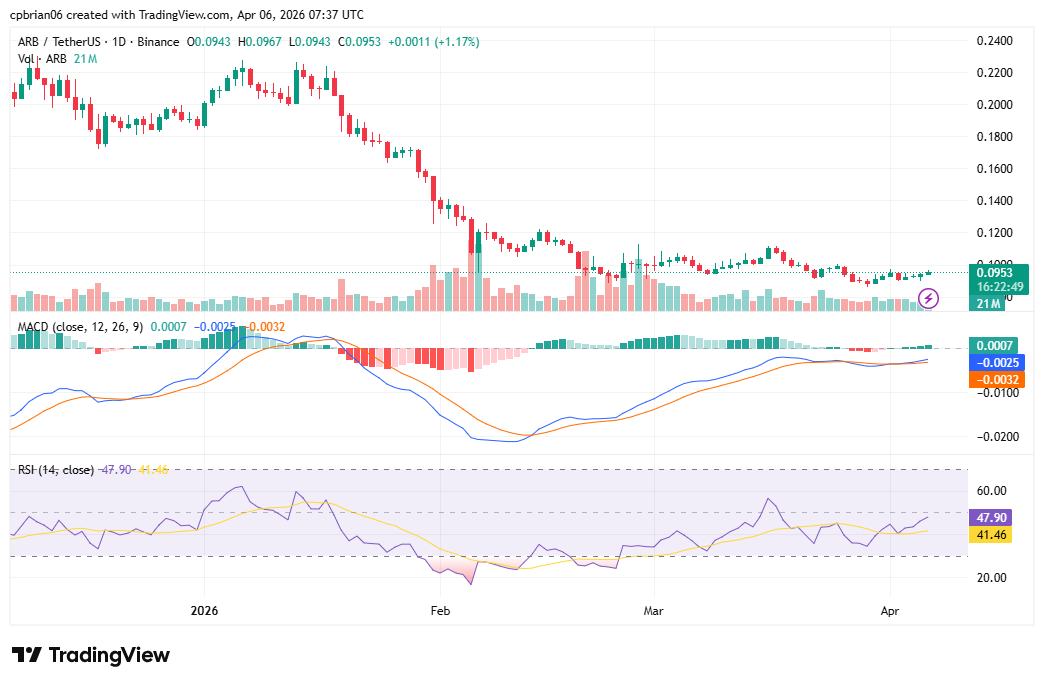
ARB has support at $0.092 and trades below all major SMA and EMA levels, despite the recent recovery. The MACD histogram shows little market momentum, while the alligator trendlines indicate that volatility is declining. Resistance is at $0.22.
Arbitrum price 4-hour chart price analysis
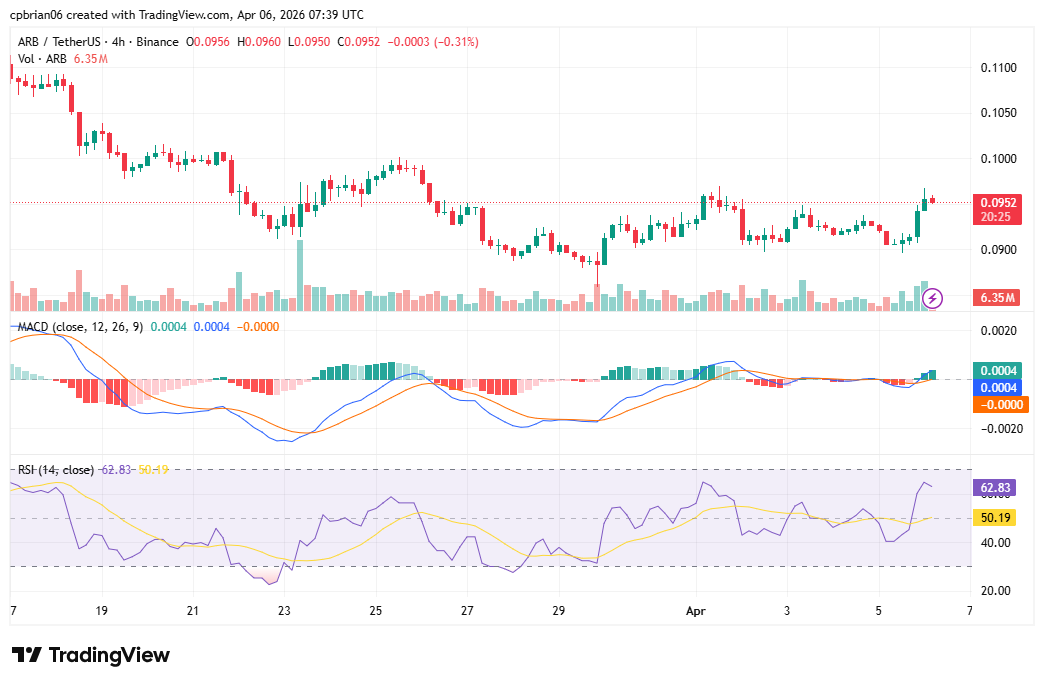
ARB registered a new all-time low (ATL) of $0.087 last month. The coin then recovered after a reversal from the drop, reaching its current level. The chart shows it is trading along support at $0.092.
Arbitrum technical indicators
Daily simple moving average (SMA)
| Period | Value ($) | Action |
| SMA 3 | 0.1364 | SELL |
| SMA 5 | 0.1152 | SELL |
| SMA 10 | 0.09944 | SELL |
| SMA 21 | 0.09782 | SELL |
| SMA 50 | 0.1011 | SELL |
| SMA 100 | 0.1402 | SELL |
| SMA 200 | 0.2252 | SELL |
Daily exponential moving average (EMA)
| Period | Value ($) | Action |
| EMA 3 | 0.09690 | SELL |
| EMA 5 | 0.1053 | SELL |
| EMA 10 | 0.1277 | SELL |
| EMA 21 | 0.1550 | SELL |
| EMA 50 | 0.1898 | SELL |
| EMA 100 | 0.2397 | SELL |
| EMA 200 | 0.3082 | SELL |
What to expect from the ARB price analysis next?
ARB is caught in a broader risk-off rotation. The recent recovery is a correction after hitting support. The coin now aims for the 3-day EMA at $0.09690
Why is ARB up?
ARB’s recovery aligns with a broader crypto market uptick. No coin-specific catalyst was found; the price action suggests ARB is tracking general market sentiment.
Does Arbitrum have a future?
A high adoption rate is crucial for any blockchain’s long-term success and sustainability. Arbitrum’s performance in this regard is a positive sign of its future performance despite the price declines.
Is Arbitrum good to buy?
Arbitrum is trading at its lowest range this year, with the charts showing it is just above the oversold region. At current prices, ARB is undervalued and is likely to recover if market sentiment changes.
On the other hand, the Arbitrum ecosystem’s total value has crossed above $2 billion, indicating solid utility in decentralized finance.
Recent news
The Arbitrum Foundation recently reported that the total value secured (TVS) on Arbitrum reached $20 billion last year.
Stablecoin supply grew 80% year-on-year and reached a peak of $10 billion in October 2025. Lifetime transactions exceeded 2.1 billion, with the second billion processed in under twelve months.
As of March 16, 2026, Arbitrum had $16.64 billion in TVS, making it the largest among general-purpose Ethereum L2 networks, according to the layer-two (L2) data-tracking platform L2BEAT.
ARB price prediction April 2026
The Arbitrum price forecast for April ranges from a minimum of $0.0950 to a maximum of $0.3101. The average price for the month will be $0.2209.
| Month | Potential low ($) | Potential average ($) | Potential high ($) |
| April | 0.0950 | 0.2209 | 0.3101 |
Arbitrum price prediction 2026
For 2026, ARB’s price will range between $0.08 and $0.41. The average price for the period will be $0.31.
| Year | Potential low ($) | Potential average ($) | Potential high ($) |
| 2026 | 0.0808 | 0.3122 | 0.4109 |
Arbitrum price prediction 2027-2032
| Year | Potential low ($) | Potential average ($) | Potential high ($) |
| 2027 | 0.4207 | 0.4364 | 0.5134 |
| 2028 | 0.6123 | 0.6341 | 0.7447 |
| 2029 | 0.8807 | 0.9124 | 1.06 |
| 2030 | 1.24 | 1.28 | 1.52 |
| 2031 | 1.73 | 1.78 | 2.10 |
| 2032 | 2.55 | 2.64 | 3.00 |
Arbitrum price prediction 2027
Arbitrum market price prediction climbs even higher into 2027. According to the prediction, ARB’s price will range from $0.42 to $0.51, with an average of $0.44.
Arbitrum coin price prediction 2028
Our analysis indicates a further acceleration in ARB’s price. It will trade between $0.61 and $0.74 and an average price of $0.63.
Arbitrum price prediction 2029
According to the 2029 Arbitrum forecast, the price of ARB will range from $0.88 to $1.06, with an average of $0.91.
ARB price prediction 2030
The ARB price prediction for 2030 is $1.24-$1.52, with an average of $1.28.
Arbitrum price prediction 2031
The Arbitrum price forecast for 2031 is a high of $2.10. It will reach a minimum price of $1.73 and an average price of $1.78.
Arbitrum ARB price prediction 2032
The year 2032 will also be bullish. Our analysis estimates a price range of $2.55 to $3.00, with an average price of $2.64.
ARB market price prediction: Analysts’ ARB price forecast
| Platform | 2026 | 2027 | 2028 |
| Coincodex | $0.077 | $0.169 | $0.107 |
| Gate.com | $0.095 | $0.123 | $0.118 |
Cryptopolitan’s ARB price prediction
Our predictions indicate that ARB will reach a high of $0.41 in 2026. In 2028, the range is expected to be between $0.61 and $0.74, with an average of $0.63. In 2030, the range is likely to be between $1.24 and $1.52, with an average of $1.28. Note that the predictions are not investment advice. Seek independent professional consultation or do your research.
Arbitrum historic price sentiment
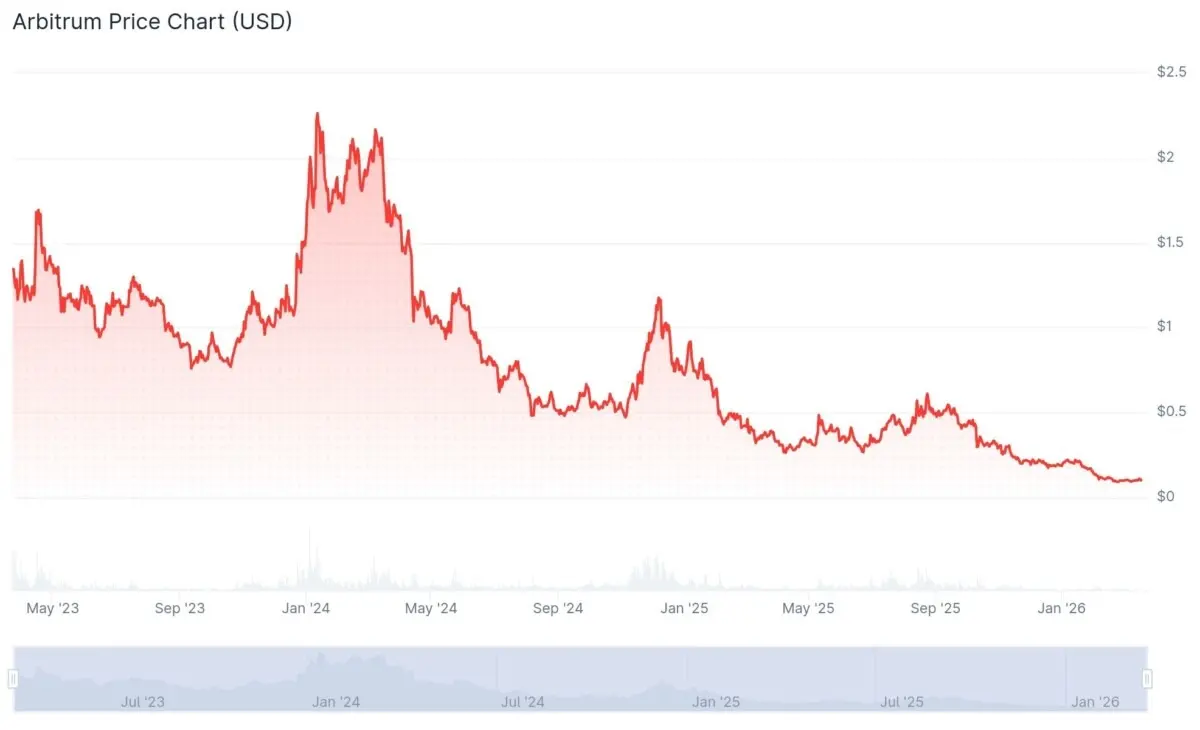
- The Arbitrum airdrop snapshot occurred on Feb 6, 2023, and eligible participants started claiming on Mar 23, 2023. The claiming period ended on Sep 24, 2023.
- The airdrop granted 11.5% of the total supply to eligible users, 1.1% to DAOs operating in the Arbitrum ecosystem, and 44% to employees and Offchain Labs investors. The 44% is subject to lock-up periods and a vesting schedule. The rest was sent to the Arbitrum DAO treasury.
- On Sep 11, 2023, it fell to its all-time low at $0.7453.
- Bitcoin’s halving and the hype around crypto ETFs helped the coin recover from its October slump. By the end of the year, it had risen to $1.4.
- The run continued into 2024. On Jan 12, it reached its all-time high at $2.40.
- Per CoinMarketCap data, ARB broke below its listing price in June 2024.
- On August 5, 2024, it registered a new all-time low of $0.4317
- It then recovered in September, reaching a high of $0.67.
- The bullish run continued into November, reaching $1.12 in December.
- The coin crossed into 2025, trading at $0.72 when it assumed a bear run, falling to a low of $0.40 in February.
- It recovered later and crossed into October, trading at $0.45. The trend later reversed, and by date 11, it had fallen to $0.136.
- In December, it traded at $0.20.
- ARB then entered a bear run in 2026, and on Feb 23, 2026, it registered an all-time low at $0.08861.
0
0


 すべての暗号通貨、NFT、DeFiを1か所から管理
開始に使用しているポートフォリオを安全に接続します。


