Why Is The US Stock Market Up Today?

0
0

The US stock market extended its rally on Wednesday as growing expectations of an Iran ceasefire combined with stronger-than-expected economic data to fuel broad risk-on sentiment.
Semiconductors and tech led the advance while energy stocks retreated sharply on falling oil prices.
Why Did the US Stock Market Rise Today?
Iran ceasefire optimism, stronger-than-expected employment data, and expanding factory activity combined to push US equities higher for a second consecutive session.
1. Iran Ceasefire Hopes Spark Risk-On Rotation
President Donald Trump told reporters the US could exit Iran in two to three weeks, signaling a potential end to the five-week conflict. The comments followed reports that Iran had asked for a ceasefire and that the US would consider ending hostilities if the Strait of Hormuz reopens.
Markets treated the remarks as a meaningful de-escalation signal, pushing capital out of safe havens and into equities.
2. ADP Payrolls and Retail Sales Show Economic Resilience
March Automatic Data Processing (ADP) private payrolls, which track monthly changes in private-sector employment, came in at 62,000, beating the Dow Jones consensus of 39,000-40,000.
February retail sales also rebounded 0.6%, ahead of the 0.5% forecast. Together, the data reassured investors that the US economy can absorb the energy shock from elevated oil prices without tipping into contraction.
3. ISM Manufacturing Expands But Flashes an Inflation Warning
The Institute for Supply Management’s Manufacturing Purchasing Managers’ Index, which measures the percentage of firms reporting expansion, rose to 52.7 in March from 52.4 in February.
However, the prices index surged to 78.3, its highest level since June 2022. The expansion reading supported the growth narrative, but rising input costs tied to the war kept inflation concerns alive.
Meanwhile, gold surged above $4,720 per ounce, adding roughly $100 on the day as investors continued rotating out of dollars and into the metal (apart from stocks) as a hedge against geopolitical uncertainty and sticky inflation.
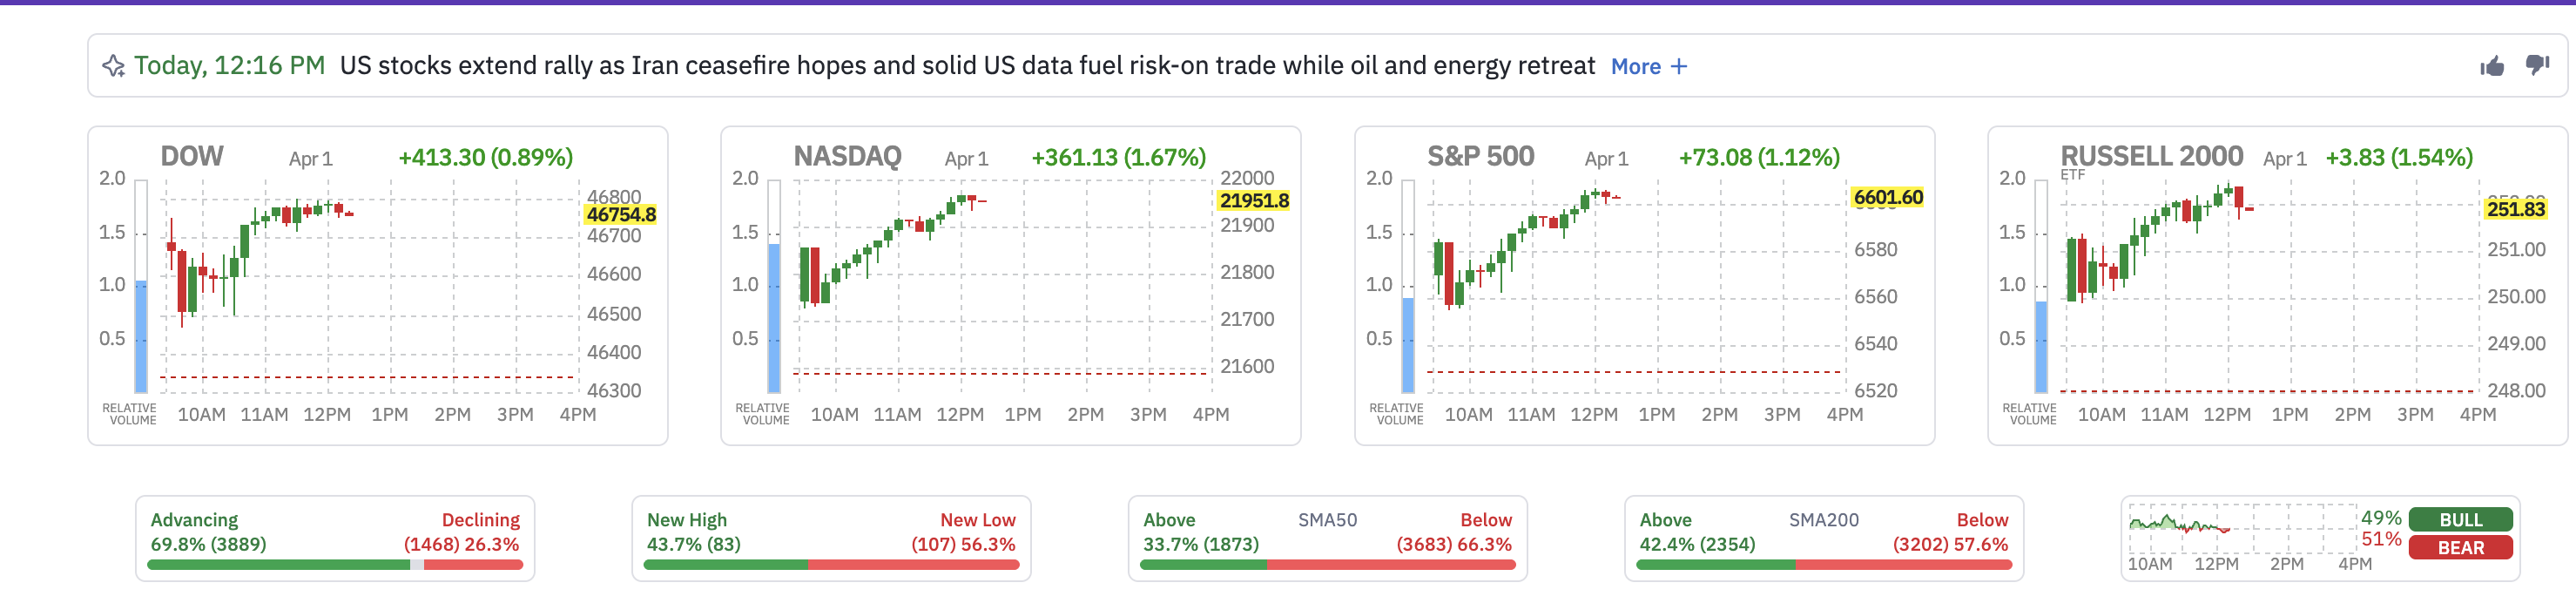
What Happened to Major US Indexes?
- S&P 500: +1.12%
- Dow Jones Industrial Average: +0.89% (+413 points to 46,754)
- Nasdaq Composite (tech-led): +1.67% (+361 points to 21,951)
 US Stock Market Screener: FinViz
The Russell 2000 led with a 1.54% gain, reflecting renewed appetite for small-cap risk. Market breadth was overwhelming, with 69.8% of issues (3,889) advancing against just 26.3% (1,468) declining.
The buying intensity was historic since yesterday. The NYSE Tick Index, which tracks the difference between stocks ticking up versus down at any given moment, spiked to 2,329 on March 31, the highest reading on record.
The previous all-time high was approximately 2,200, set in April 2025 following President Trump’s tariff pause. More than 75% of S&P 500 names ended the session higher. That effect seems to be continuing today, on April 1, as well.
 Stock Heatmap: FinViz
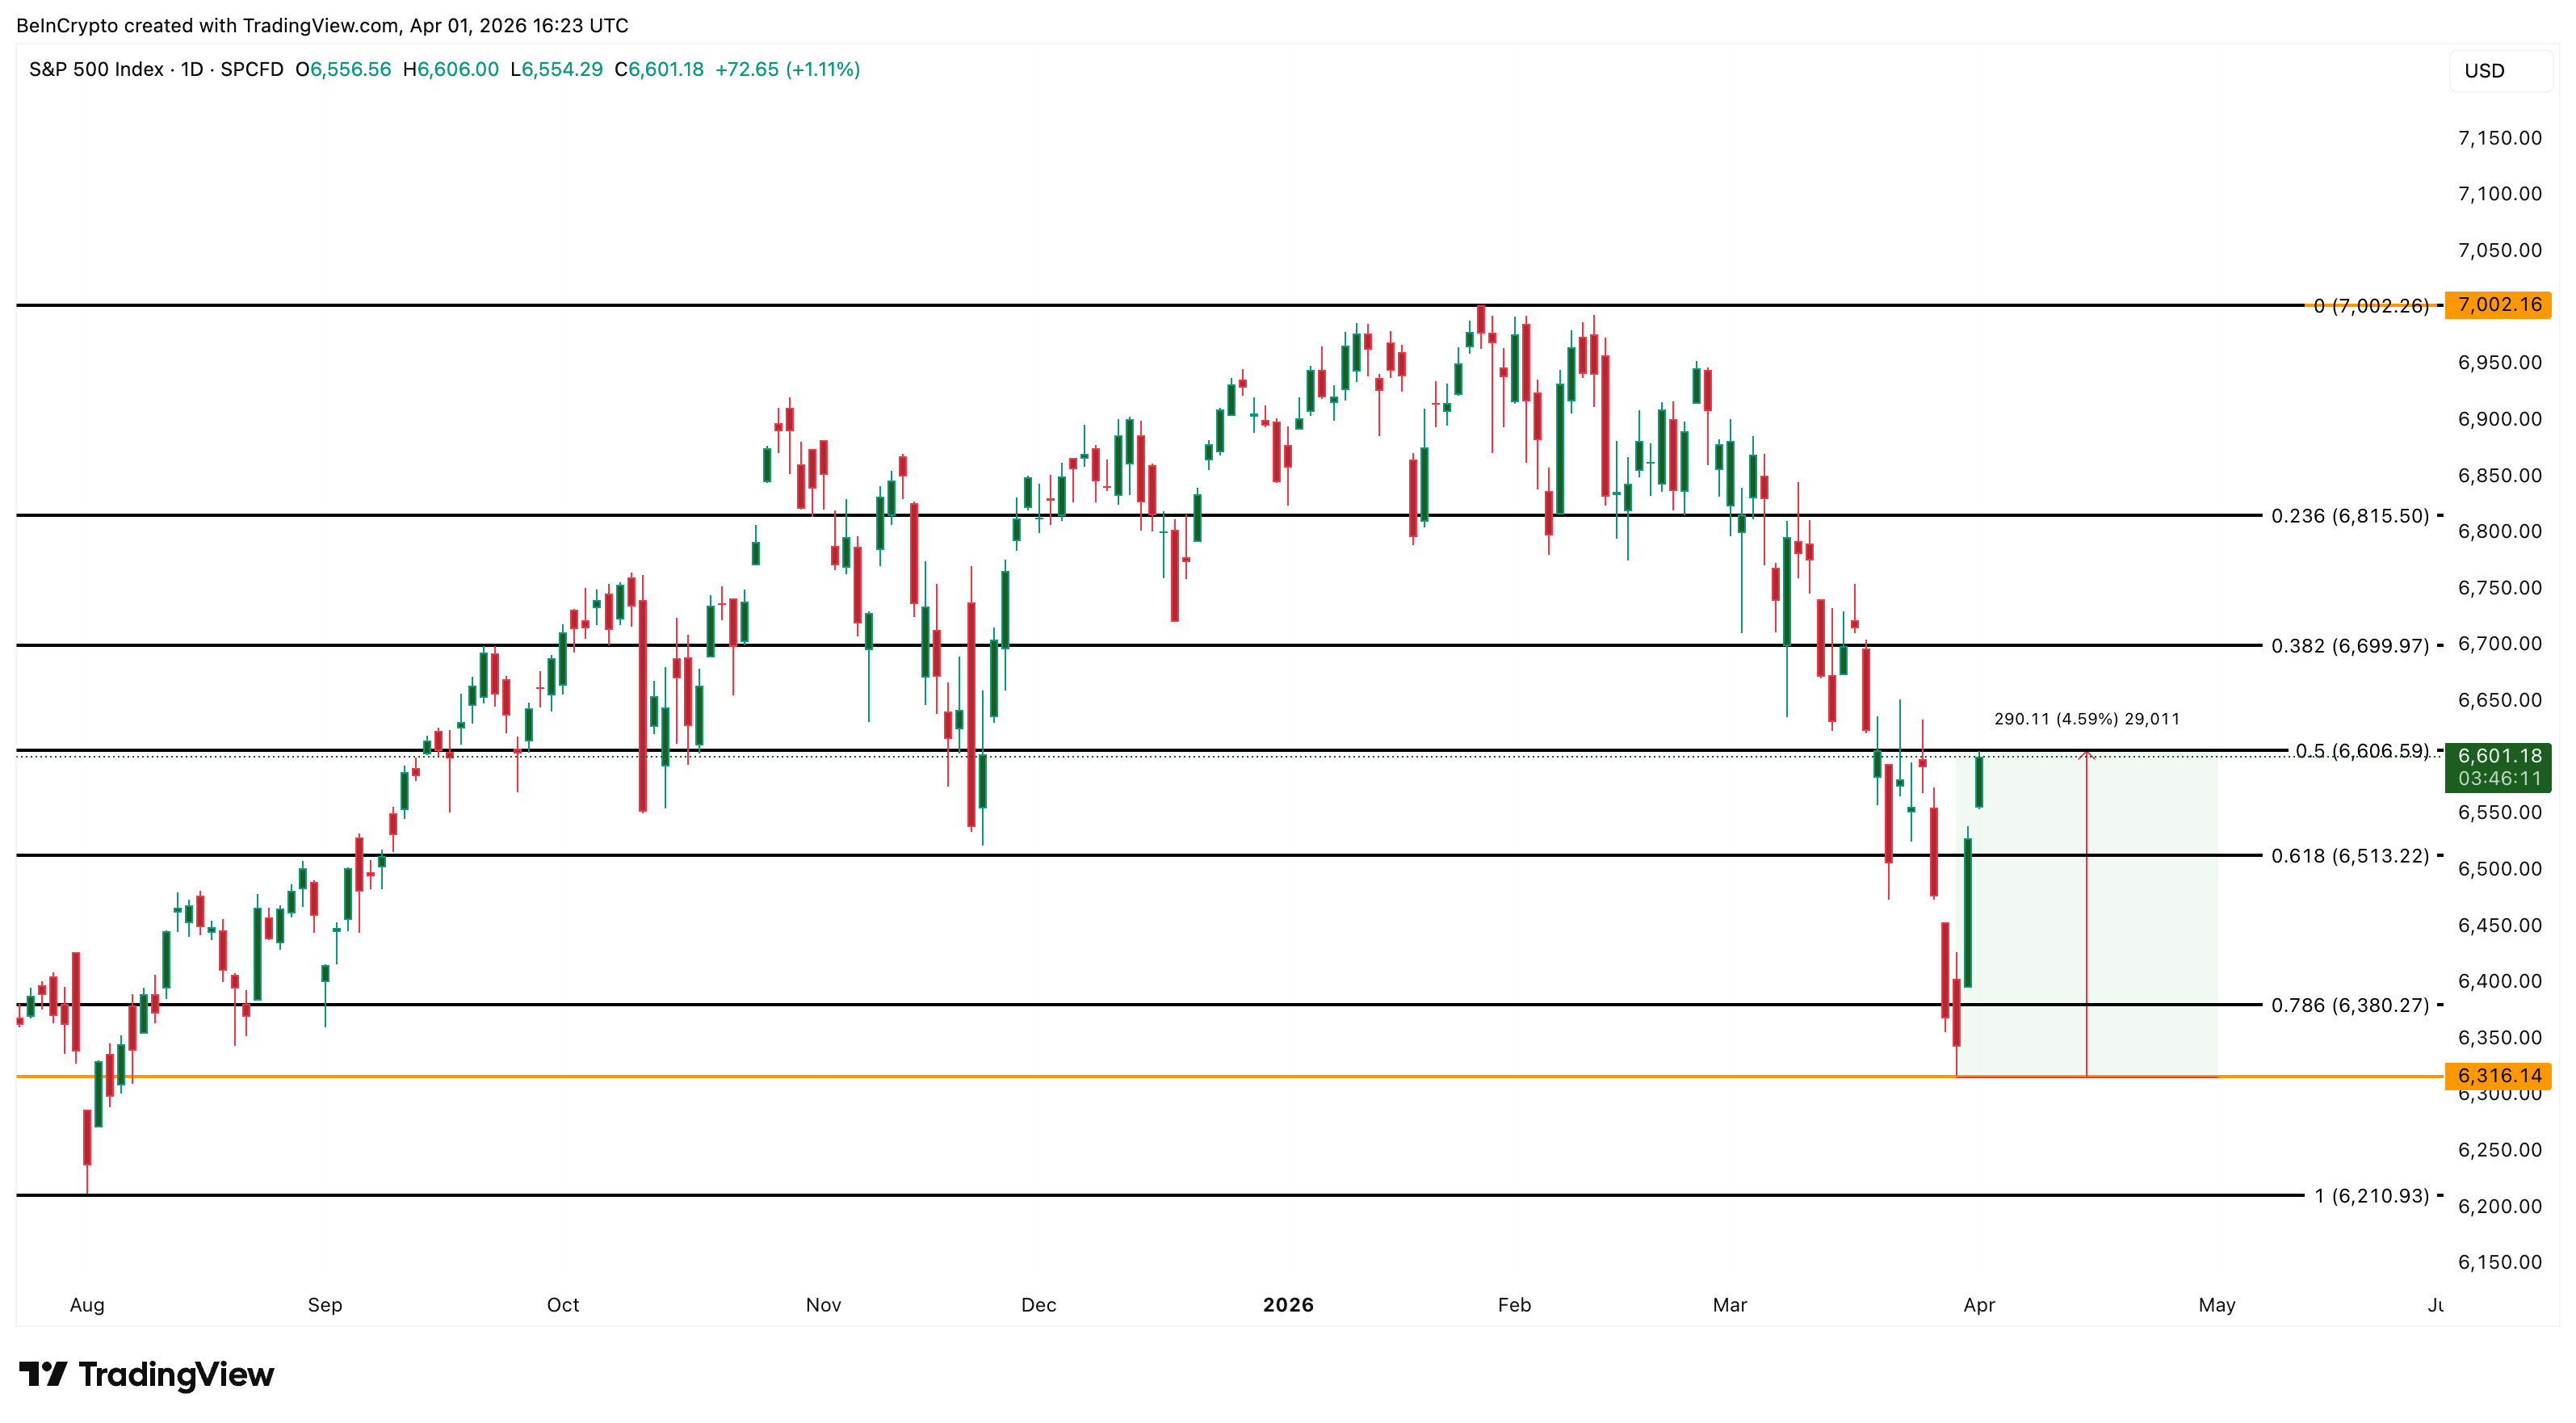
On the daily chart, the S&P 500 traded at 6,601, sitting right at the 0.5 Fibonacci level of 6,606. The index has rallied 4.59% from its March 30 low of 6,316, recovering within a structure that still resembles a falling knife pattern since the late January peak near 7,002.
 S&P 500 Analysis: TradingView
A daily close above 6,606 would open the path toward 6,699 (0.382 Fibonacci) and eventually 6,815 (0.236 Fibonacci). However, a failure to hold this level would expose 6,513 (0.618 Fibonacci) as the critical support, with 6,380 and the March low of 6,316 below that.
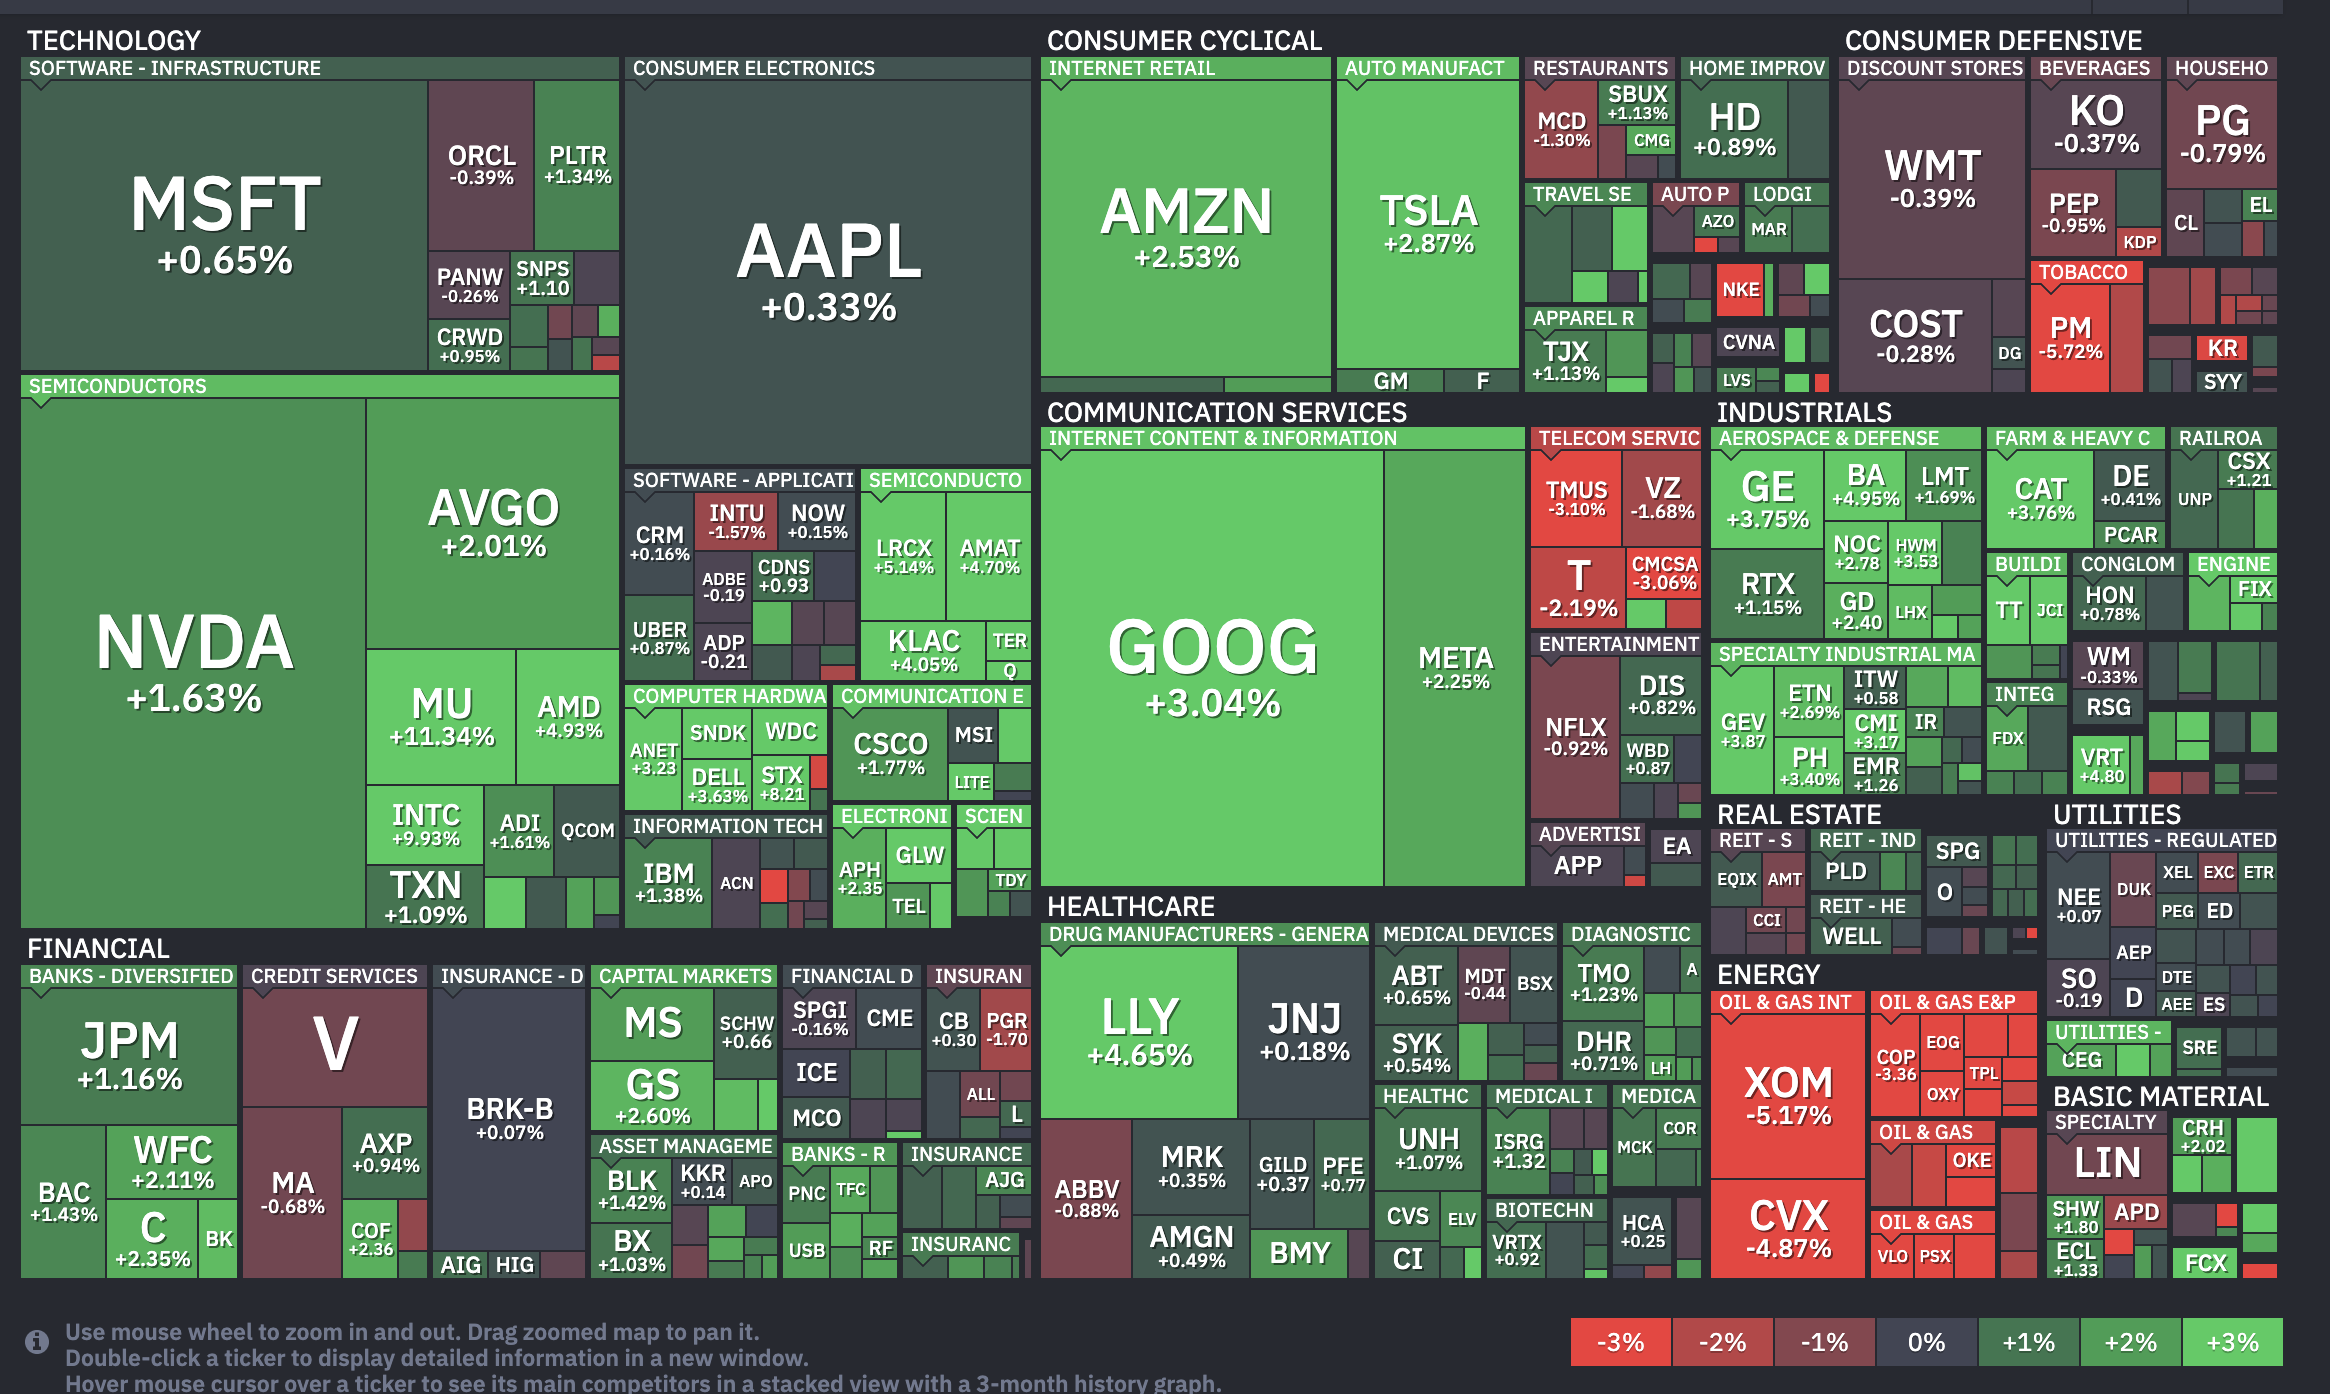
Which Sectors Are Holding Up?
Basic Materials gained 2.56% to lead all sectors. A weaker US Dollar Index at 99.44 made commodities cheaper for international buyers, while gold’s surge above $4,720 per ounce lifted miners and materials producers.
Industrials rose 2.23% as ceasefire optimism boosted infrastructure and defense-adjacent names. Boeing (BA) gained 4.95% and Caterpillar (CAT) added 3.76%, reflecting renewed confidence in global trade and construction demand.
 US Stock Market Sectors: FinViz
Technology advanced 1.90%, powered by semiconductors. Micron Technology (MU) surged 11.34% on renewed confidence in a memory and AI supercycle.
Intel (INTC) gained 9.93% after announcing a $14.2 billion repurchase of its Ireland fab stake from Apollo Global Management. Nvidia (NVDA) added 1.63%.
Which Sectors Are Falling?
Energy was the day’s clear laggard, down 3.03%. Brent crude fell 1.89% to $102 per barrel as ceasefire and Strait of Hormuz reopening expectations reduced the war risk premium on oil. Lower crude prices directly compress revenue for producers. ExxonMobil (XOM) dropped 5.17% and Chevron (CVX) fell 4.87%.
Consumer Defensive slipped 0.74%, as investors rotated out of safe-haven staples and into higher-beta growth names. Philip Morris (PM) fell 5.72% and Procter & Gamble (PG) dropped 0.79%, both losing ground as the risk-on trade pulled capital toward cyclicals instead.
Major Stock News Investors Are Watching
- Nike (NKE) plunged 14.40% to an 11-year low after reporting fiscal Q3 results. Although the company beat on both revenue ($11.28 billion) and earnings ($0.35 per share), guidance blindsided the market.
- Management projected Q4 sales to decline 2% to 4%, while Wall Street expected 1.9% growth. Greater China sales are expected to fall 20% this quarter, and gross margins contracted 130 basis points to 40.2% due to tariff pressure.
- Eli Lilly (LLY) rose 4.65% after the FDA approved its GLP-1 weight-loss pill, Foundayo. The once-daily medication will begin shipping from LillyDirect on Monday, positioning Lilly just three months behind Novo Nordisk’s Wegovy pill in the race for oral obesity treatments.
What Are Investors Watching Next?
Friday’s March nonfarm payrolls report will be the week’s biggest catalyst, with Wall Street expecting a gain of 59,000 after February’s 92,000-job loss. The unemployment rate is projected to remain at 4.4%.
Note: April 3 is Good Friday, and markets are closed. The data releases at 8:30 AM, but equities won’t trade until Monday, April 6.
A strong print would confirm the resilience story and support equities when the market reopens, but the ISM prices index at 78.3 keeps the stagflation debate alive.
Any shift in Iran ceasefire talks between now and Friday could override the data entirely, making geopolitical headlines the most important variable for the week’s final sessions.
0
0


 すべての暗号通貨、NFT、DeFiを1か所から管理
開始に使用しているポートフォリオを安全に接続します。


0
0