The Graph (GRT) Flashes Buy Signal Amid Steady Price Decline

0
1

The value of GRT, the native token of the leading indexing protocol, The Graph, has dropped by double digits in the last month. Exchanging hands at $0.19 as of this writing, the altcoin’s value has plummeted by 27% in the last 30 days.
However, for those looking to trade against the market, GRT’s price decline offers a respite. A key on-chain metric suggests that now might be the best time to buy.
The Graph is Currently Undervalued
Based on readings from its market value to realized value (MVRV) ratio, GRT is undervalued at its current price.
The token’s MVRV ratio shows negative values when assessed over various moving averages. Specifically, GRT’s MVRV ratios for the 30-day and 90-day moving averages were -9.45% and -26.61%, respectively, at the time of writing.
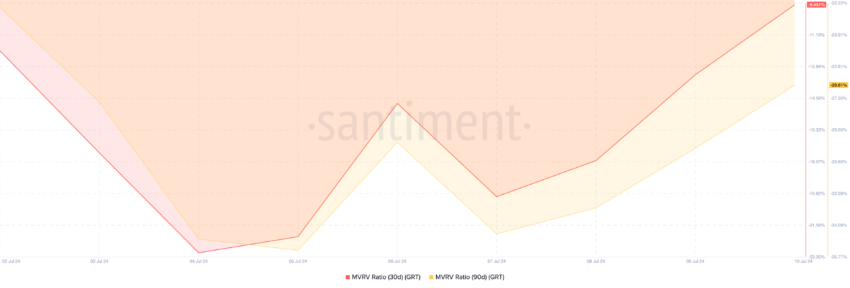 The Graph MVRV Ratio. Source: Santiment
This metric measures the ratio between an asset’s current price and the average price at which all its coins or tokens were acquired.
When it returns a value above one, the asset’s current market value is significantly higher than the price at which most investors acquire their holdings. It is deemed overvalued, and most traders sell for profit at this level.
On the other hand, an MVRV ratio below zero suggests that the market value of the asset in question is below the average purchase price of all its tokens in circulation. When this occurs, the asset is said to be undervalued.
Historically, negative MVRV ratios offer a buying opportunity because the asset is deemed to trade below its cost basis. Therefore, traders can buy at a lower price and hope to sell higher.
An assessment of the token’s network activity reveals that GRT holders have begun to buy the dip. Its daily active address count observed using a seven-day moving average has increased by 13% in the last week.
Likewise, the average number of new addresses created daily to trade the altcoin has grown by 5% during the same period.
Read More: Cryptocurrency Coins vs. Tokens: What’s the Difference?
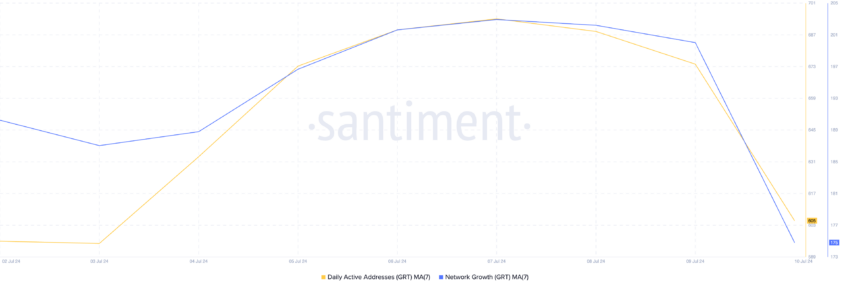 The Graph Network Activity. Source: Santiment
When both daily active addresses and new addresses spike together, it’s a strong indication of heightened interest and activity around the asset.
GRT Price Prediction: Price May Dip to $0.15
The steady decline in GRT’s price has pushed it below its 20-day exponential moving average (EMA). An asset’s 20-day EMA measures its average price over the past 20 trading days.
When the price falls below this level, it is a bearish signal. It means that sellers are gaining control, and the price may continue to decline in the short term.
If this decline continues, GRT’s price might fall to $0.15.
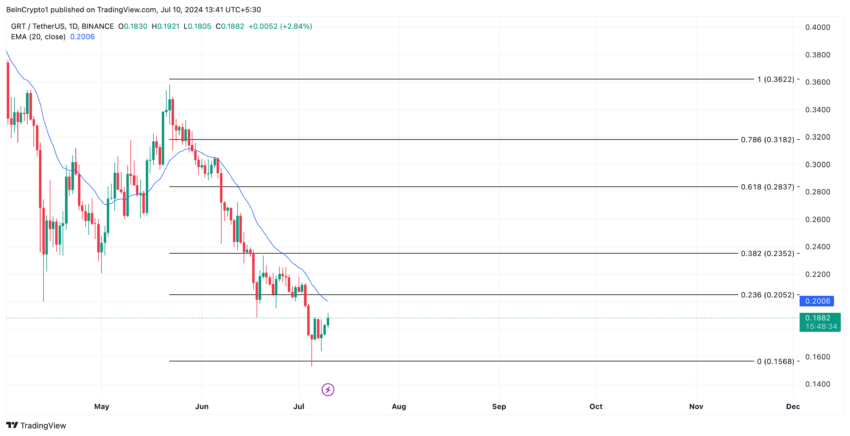 The Graph Analysis. Source: TradingView
However, if the market participants continue to “buy the dip” and demand for GRT is sustained, its price might rally toward $0.20.
0
1


 Manage all your crypto, NFT and DeFi from one place
Securely connect the portfolio you’re using to start.