XRP may retest $1.12 as derivatives data remains poor: Check forecast

0
0
The cryptocurrency market has continued its weekend selloff into the new week as Bitcoin, Ether, and XRP are all in the red.
Bitcoin has dropped below the $63k level, while Ether is now trading below $1,900 once again.
XRP, the third-largest non-stablecoin cryptocurrency by market cap, is trading close to the $1.30 level after losing 3% of its value since Monday.
It broke the intra-day low of $1.33 during the Asian trading session and could be set to record further losses in the near term.
Declining derivatives data plunges XRP lower
XRP has lost 7.5% of its value in the last seven days amid mixed signals from the broader cryptocurrency market.
CoinShares revealed in its latest report that inflows into XRP-related investment products declined to $3.5 million last week.
This was a 90% dip from the previous week’s $33 million in inflows, bringing the total assets under management to $2.6 billion, with YTD inflows at $151 million.
However, demand for Bitcoin ETFs remained poor, with cumulative outflows reaching $215 million last week.
Spot Bitcoin ETFs’ total assets under management stand at $104 billion.
However, YTD outflows average $1.3 billion, according to CoinShares.
CoinShares added that Ethereum is also experiencing an extended capital exit last week, with outflows totalling $36.5 million. Currently, spot Ethereum ETFs have a YTD outflow of $494 million, while cumulative assets under management exceed $15 million.
Meanwhile, retail interest in XRP has been declining in recent days.
Data obtained from CoinGlass shows that XRP’s futures Open Interest (OI) has declined to $2.26 billion, down from the $2.4 billion recorded on Monday.
The declining OI suggests that investors are reducing their risk as confidence in the token remains poor.
Thus, decreasing the odds of a potential recovery in the coming sessions.
Technical outlook: Will XRP retest the February 6 low?
The XRP/USD 4-hour chart, similar to BTC and ETH, is currently bearish.
At press time, XRP is trading around the $1.32 level.
The technical indicators show that XRP’s price could dip lower in the near term.
The Moving Average Convergence Divergence (MACD) is below the neutral level on the 4-hour chart, indicating a bearish bias.
At the same time, the Relative Strength Index (RSI) at 38 remains well below neutral on the same chart, aligning with the overall weak technical structure.
Currently, XRP’s 50-day Exponential Moving Average (EMA) at $1.66, the 100-day EMA at $1.87, and the 200-day EMA at $2.09 are sloping lower, suggesting that the bears could remain in control in the near term.
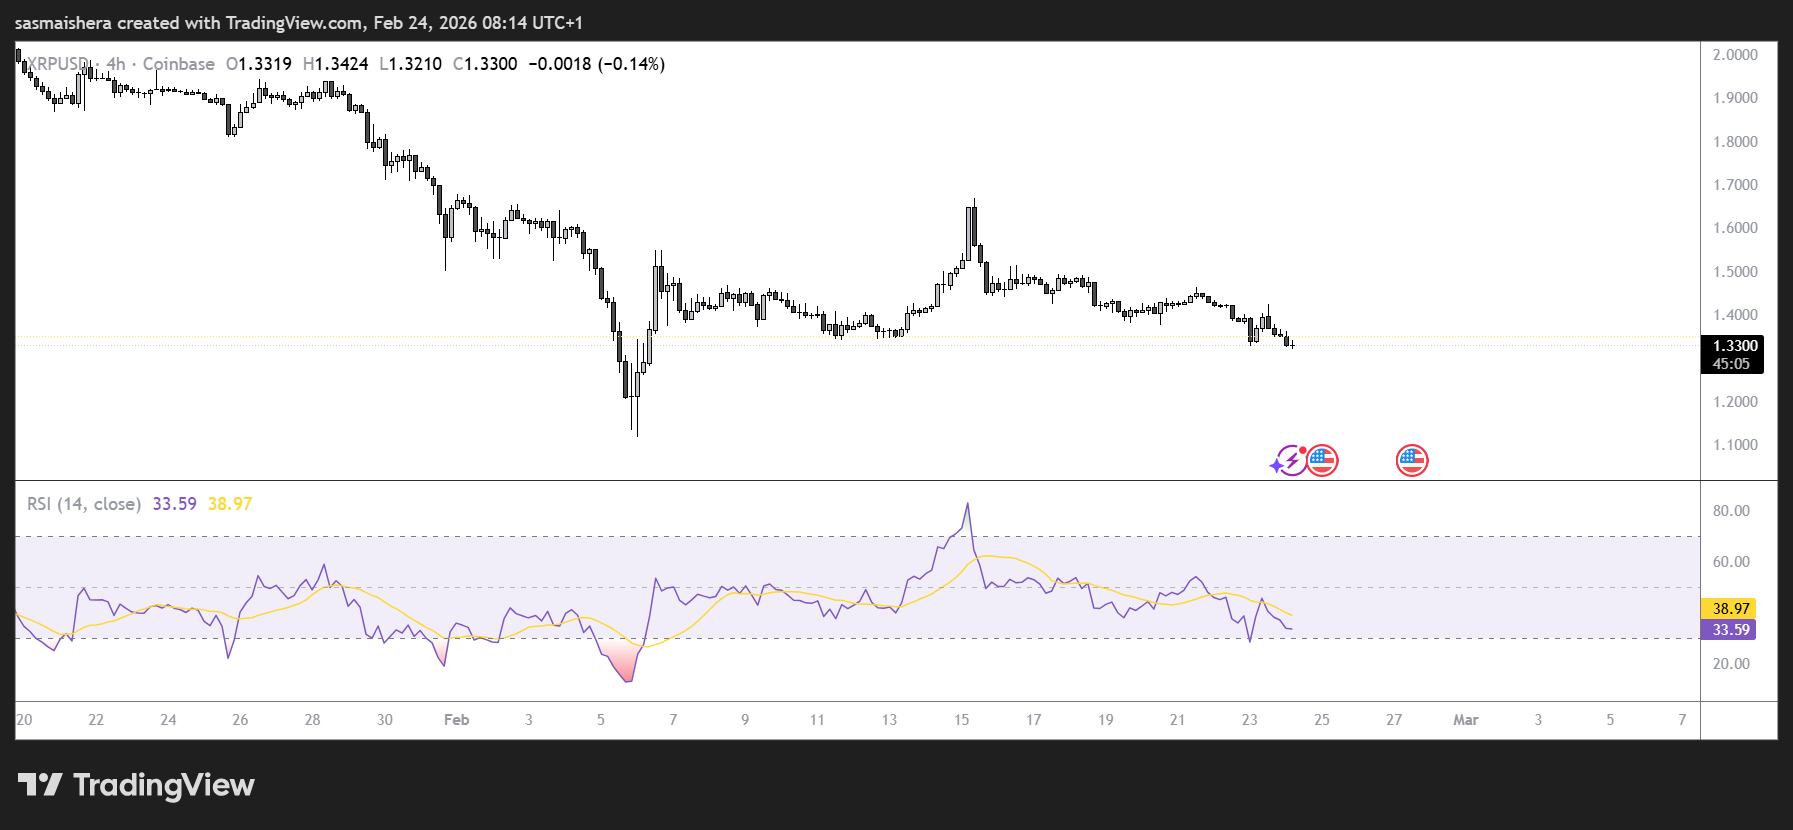
If the bearish trend persists, XRP could retest the February 6 low of $1.12 over the next few hours or days.
However, if market sentiment improves and investors increase their exposure, XRP could rally towards the nearest supply zone at $1.54.
The post XRP may retest $1.12 as derivatives data remains poor: Check forecast appeared first on Invezz
0
0


 Tüm kripto, NFT ve DeFi varlıklarınızı tek bir yerden yönetin
Kullanmaya başlamak için portföyünüzü güvenli bir şekilde bağlayın.


