Ethereum (ETH) Whales Offset a Critical Transfer — Yet the $1,800 Zone Remains at Risk

0
0

Ethereum price has come under renewed pressure after a major on-chain event shook the market. Since March 6, ETH has dropped nearly 8%, even though it is down only about 1.4% over the past 24 hours.
The weakness followed a $157 million ETH transfer by Ethereum co-founder Jeffrey Wilcke, possibly to dump. However, deeper on-chain data now suggests that some whale cohorts may actually be trying to absorb the selling pressure.
Co-Founder’s $157 Million Transfer May Be Misread as Whale Selling
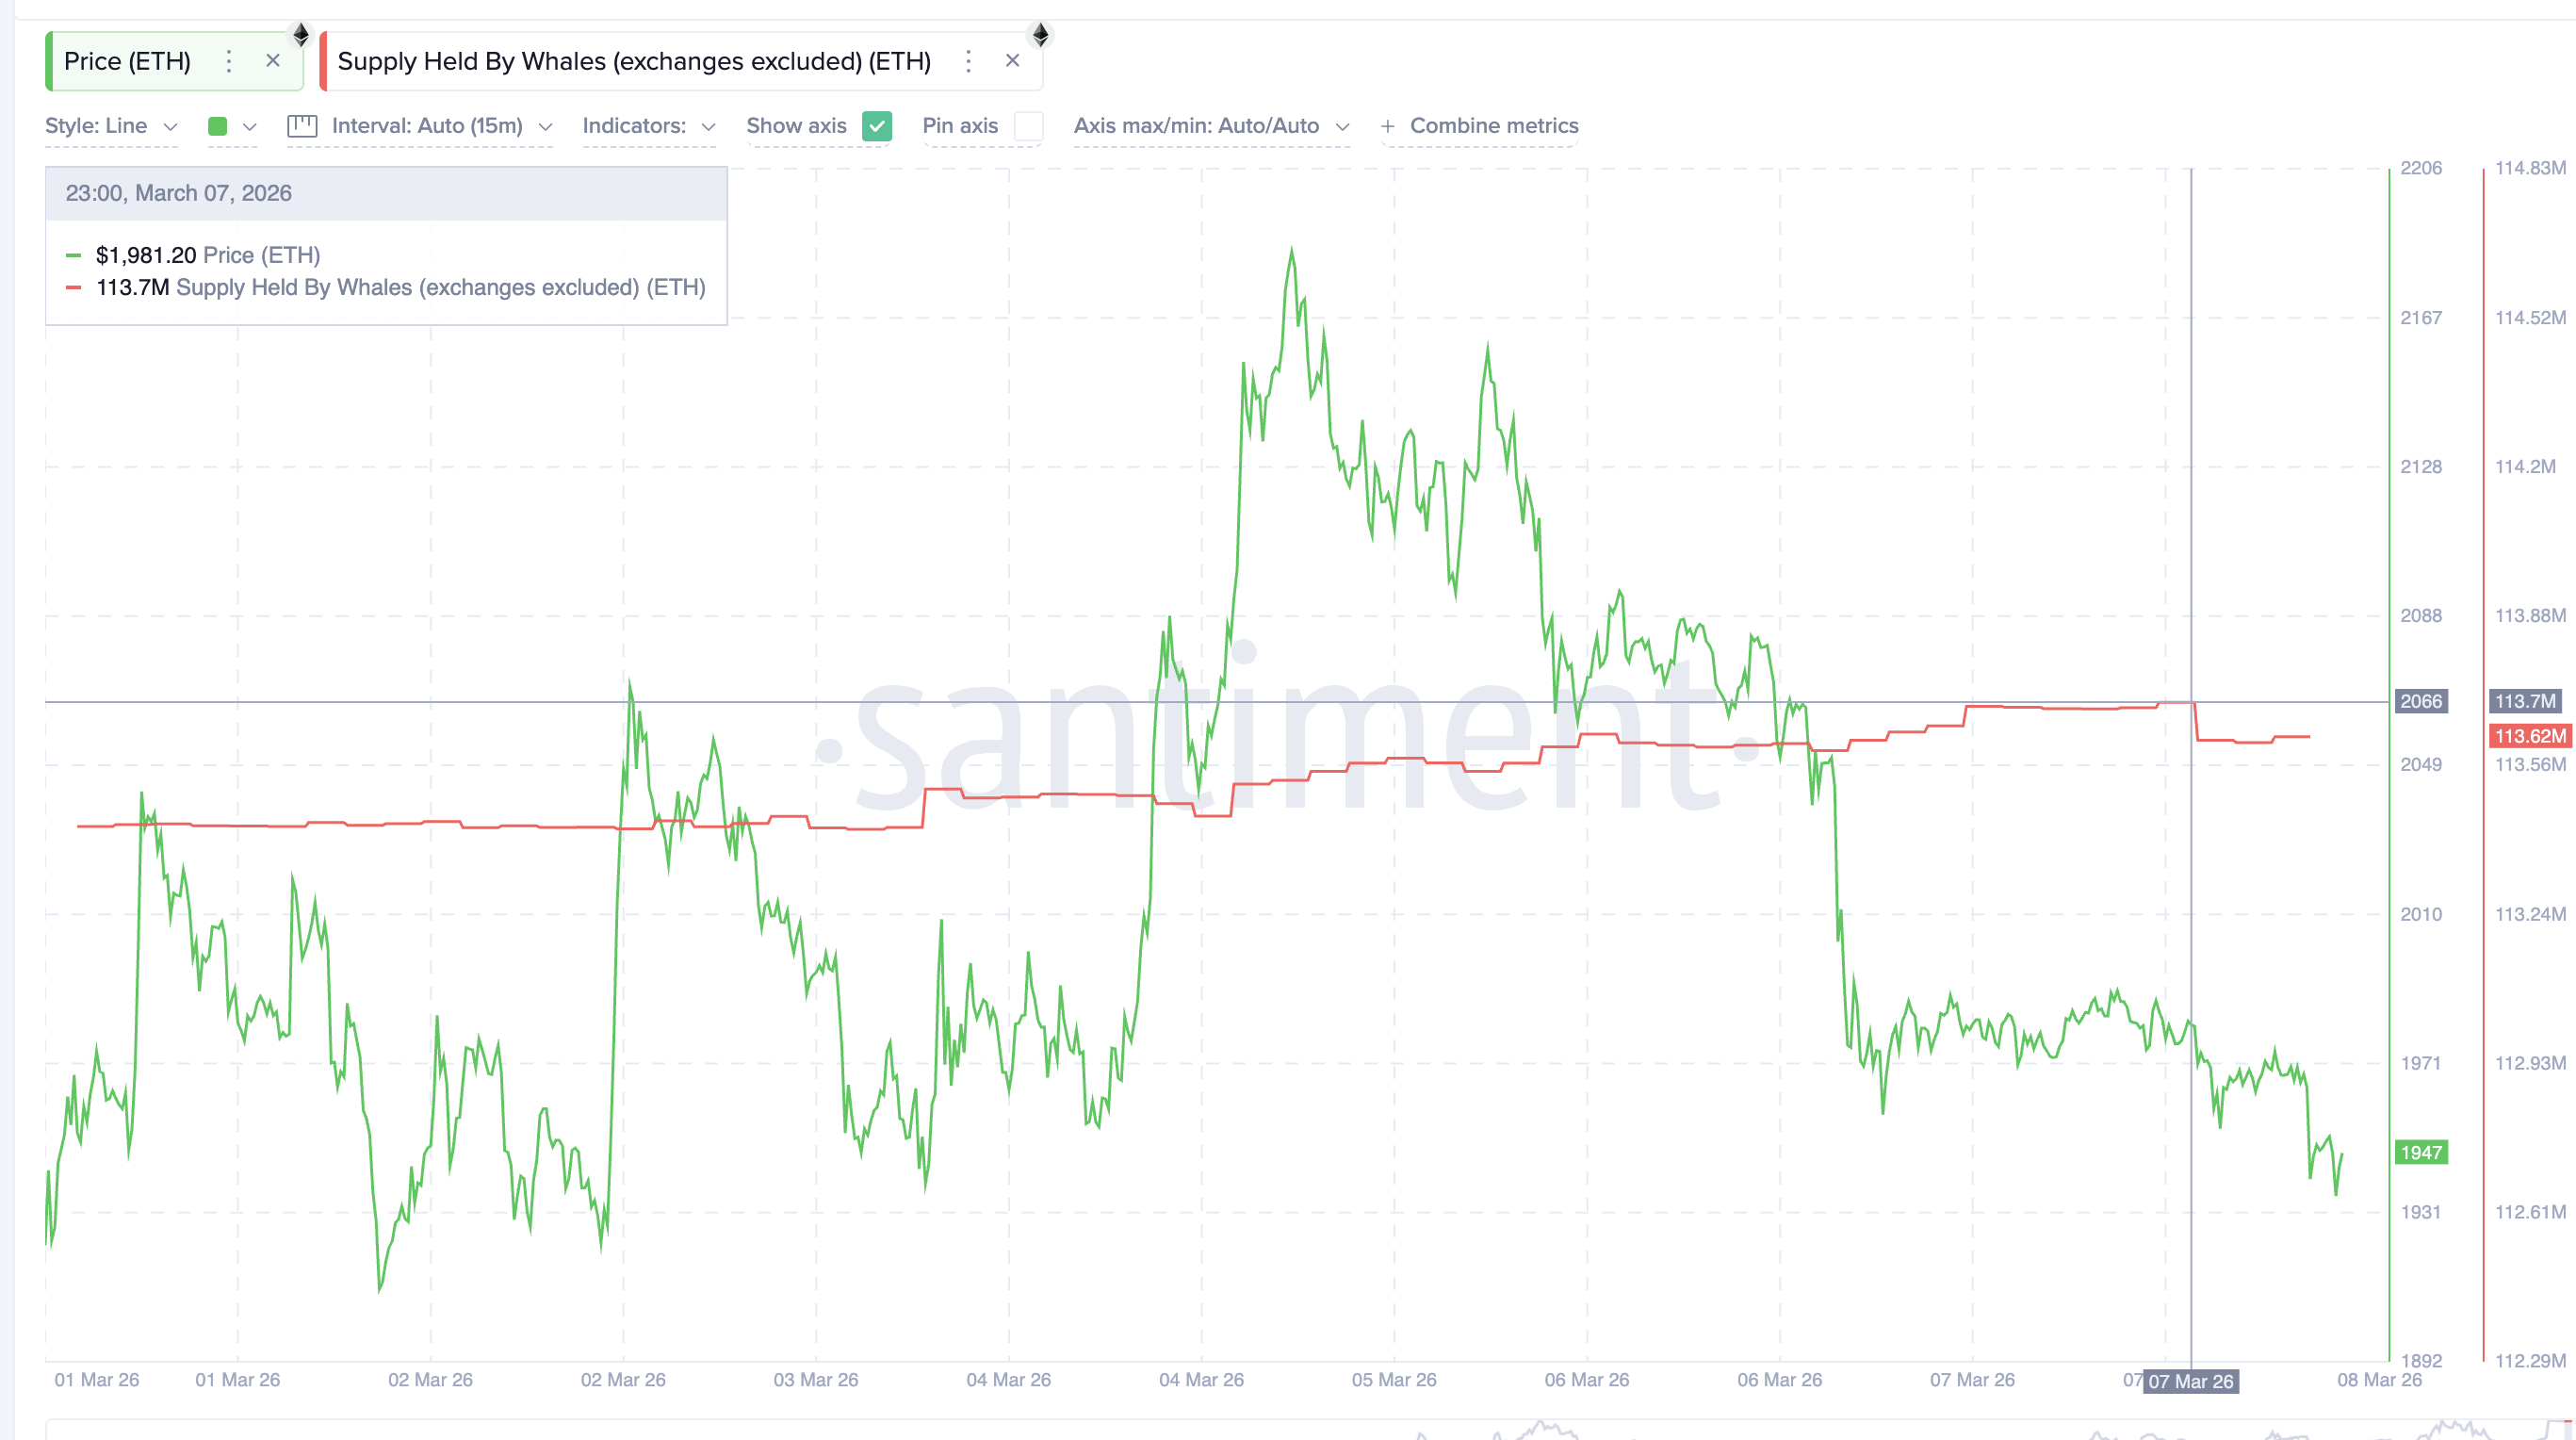
Ethereum’s recent weakness began when Jeffrey Wilcke, one of the network’s co-founders, moved 79,176 ETH to the Kraken exchange, worth roughly $157 million at current prices. Large transfers to exchanges often signal potential selling activity and can hit sentiment hard. Shortly after this transfer appeared, standard whale metrics also showed a decline in large ETH holdings.
Data tracking Ethereum supply held by whales outside exchanges dropped by roughly 80,000 ETH, almost identical to the size of Wilcke’s transfer. This is an important detail.
Because whale metrics group many large wallets together, a single very large wallet movement can sometimes appear as broad whale selling. In this case, the 80,000 ETH decline closely matches Wilcke’s deposit, suggesting the co-founder’s transfer may be reflected in those whale metrics.
Want more token insights like this? Sign up for Editor Harsh Notariya’s Daily Crypto Newsletter here.
 Whale Selling Probably Reflecting Wilcke’s Transfer: Santiment
In other words, what initially looked like widespread whale distribution could simply be one large founder-level transfer showing up inside aggregate data. This is why a deeper breakdown of whale cohorts becomes important.
Whale Cohorts Are Actually Accumulating
When whale data is examined more closely using balanced cohort metrics, the narrative becomes very different. Two major Ethereum whale cohorts have been increasing their holdings during the same period.
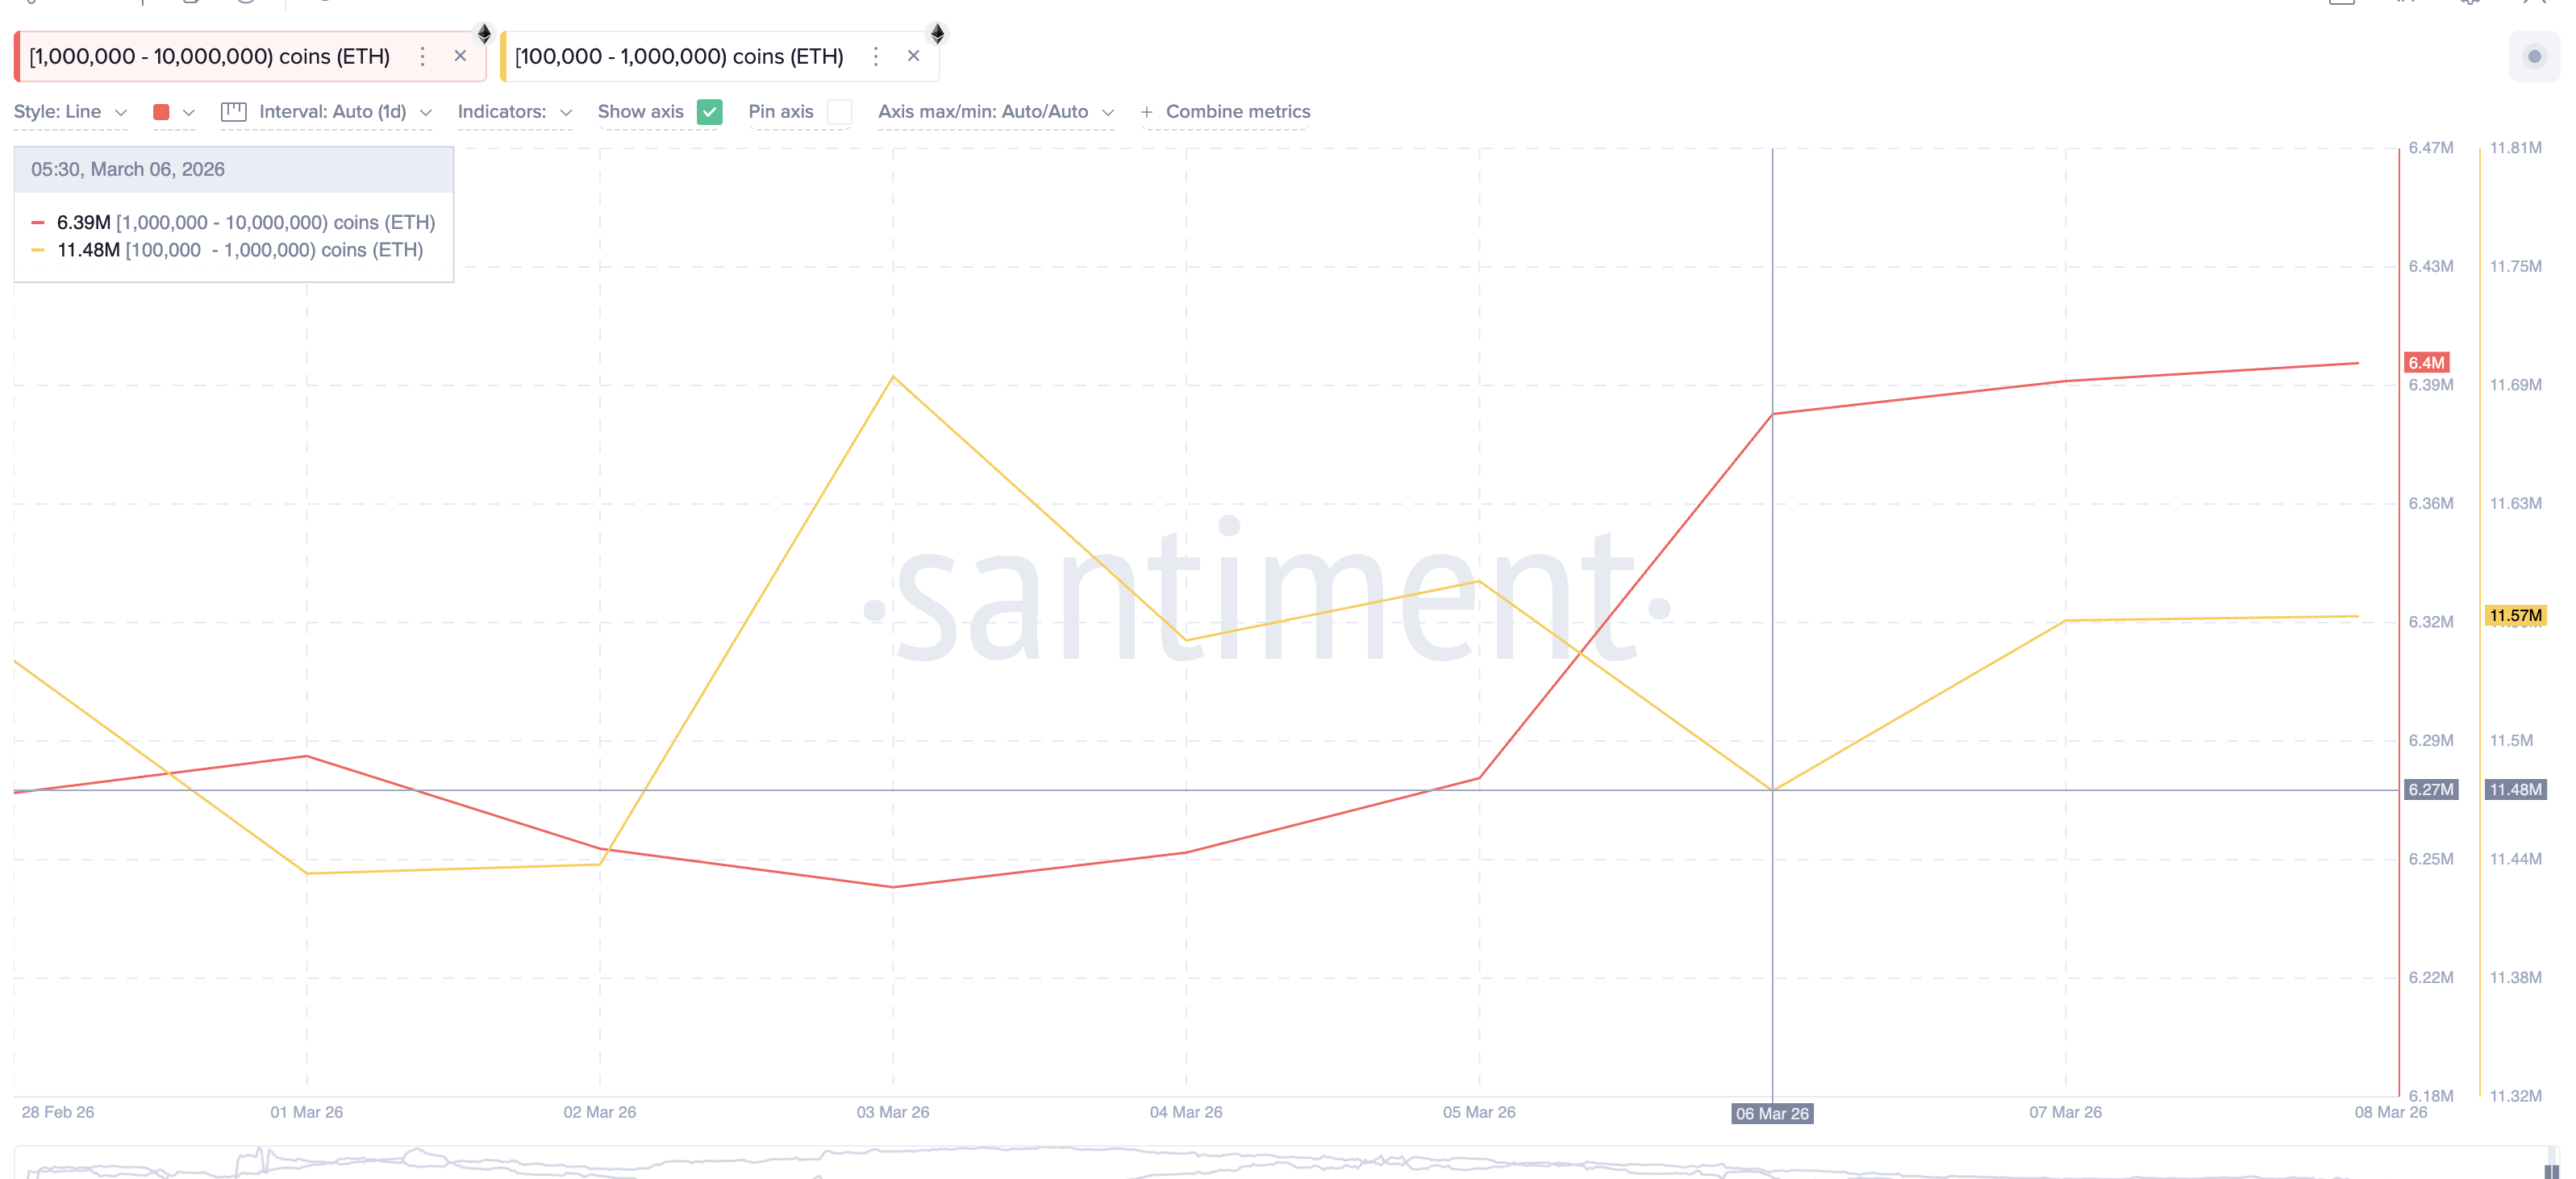
The first group consists of wallets holding between 1 million and 10 million ETH. This cohort began accumulating on March 5, raising its supply from 6.28 million ETH to about 6.40 million ETH.
That represents an increase of roughly 120,000 ETH, worth approximately $234 million at current prices.
 ETH Whales Net Buying: Santiment
Another cohort: wallets holding between 100,000 and 1 million ETH, also began accumulating shortly afterward. Since March 6, their holdings have increased from 11.48 million ETH to roughly 11.57 million ETH, meaning they added nearly 90,000 ETH, worth about $175 million.
This accumulation suggests that some large investors may have stepped in to absorb the supply entering the market, offsetting part of the selling pressure. It also explains why the broader whale metrics initially appeared bearish, even though specific whale groups were actually increasing their exposure.
Momentum Signal and Rising Channel Flag Contradictory Moves
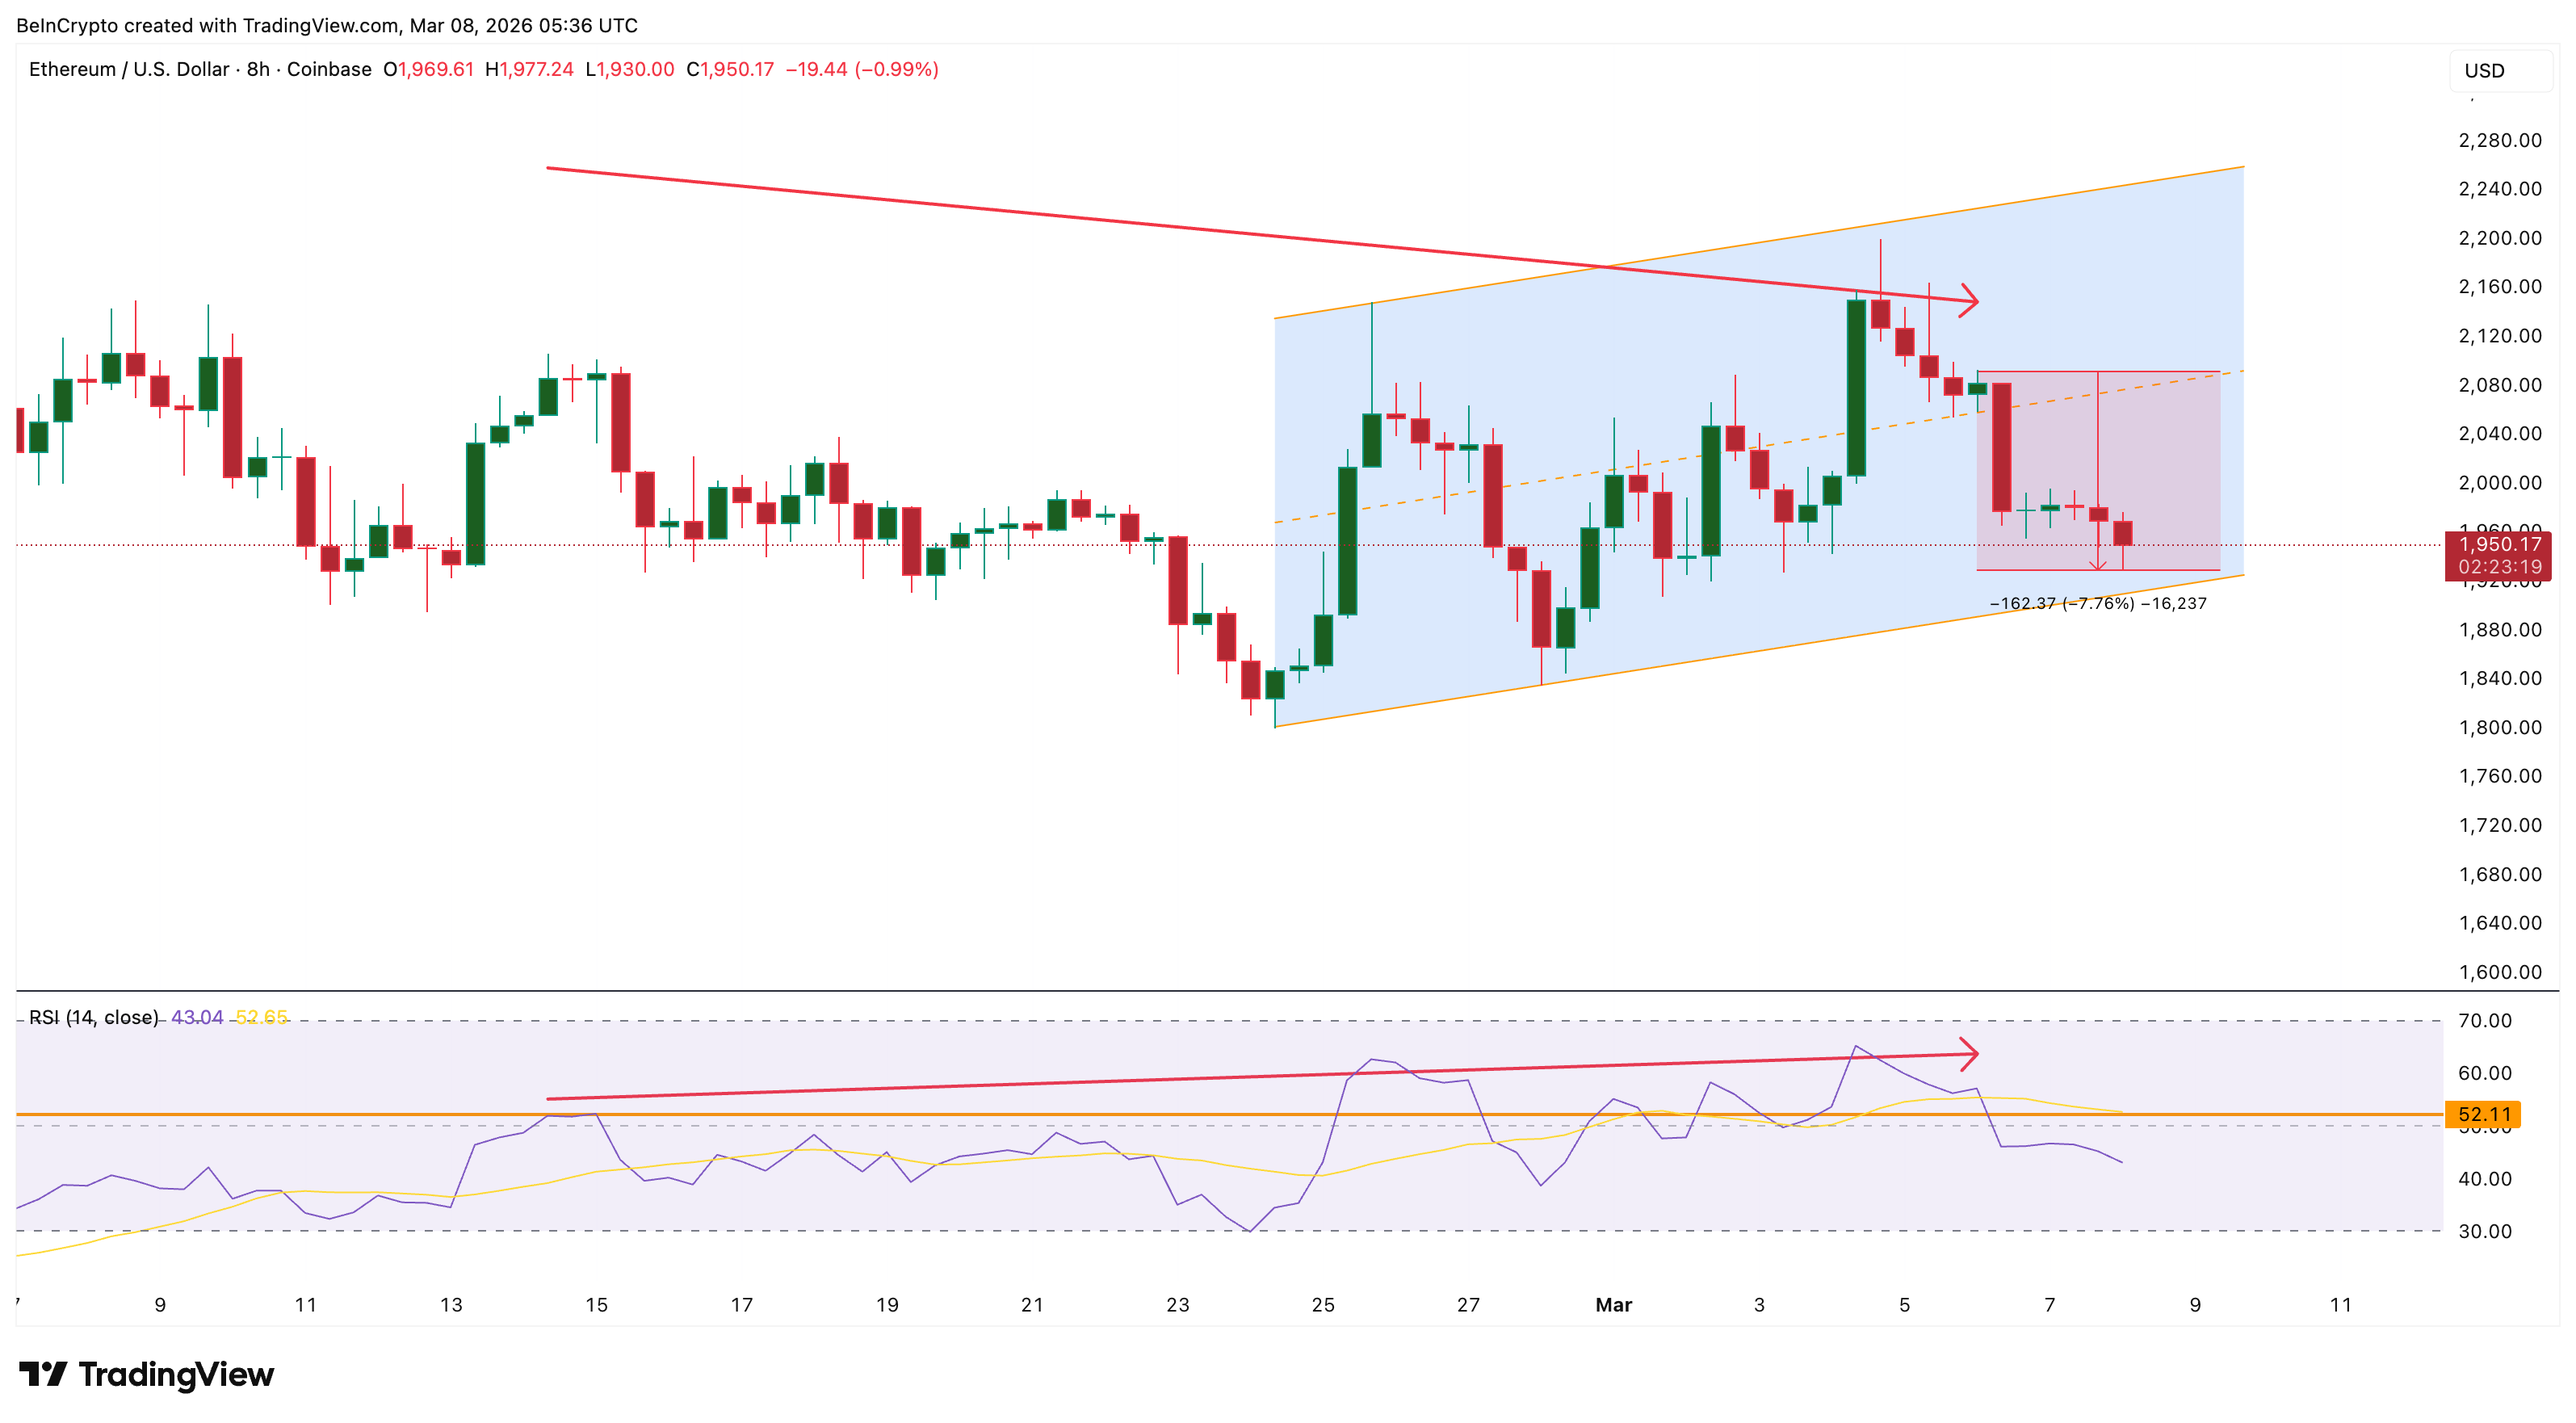
Even before the co-founder transfer appeared, Ethereum’s chart had already started flashing warning signs. On the 8-hour chart, ETH formed a hidden bearish divergence between February 14 and March 6. During that period, the Ethereum price created a lower high, while the Relative Strength Index (RSI), a momentum indicator, formed a higher high.
Hidden bearish divergence typically appears during downtrends and often signals that selling pressure is still present despite temporary rebounds. Soon after the signal appeared, Ethereum weakened and eventually dropped nearly 8%, triggered further by the possible Co-Founder transfer.
 RSI Divergence: TradingView
At the same time, ETH has been trading inside a rising channel since February 24, which indicates that buyers were still attempting to build a short-term bullish structure. This channel may also explain why certain whale cohorts continued accumulating.
However, that bullish structure is now under pressure. If Ethereum breaks below the lower boundary of the rising channel, the bearish momentum indicated by the RSI divergence could accelerate. But whales are not the only optimistic cohort.
Long-Term Holders Continue Accumulating as $1,800 Ethereum Price Risk Emerges
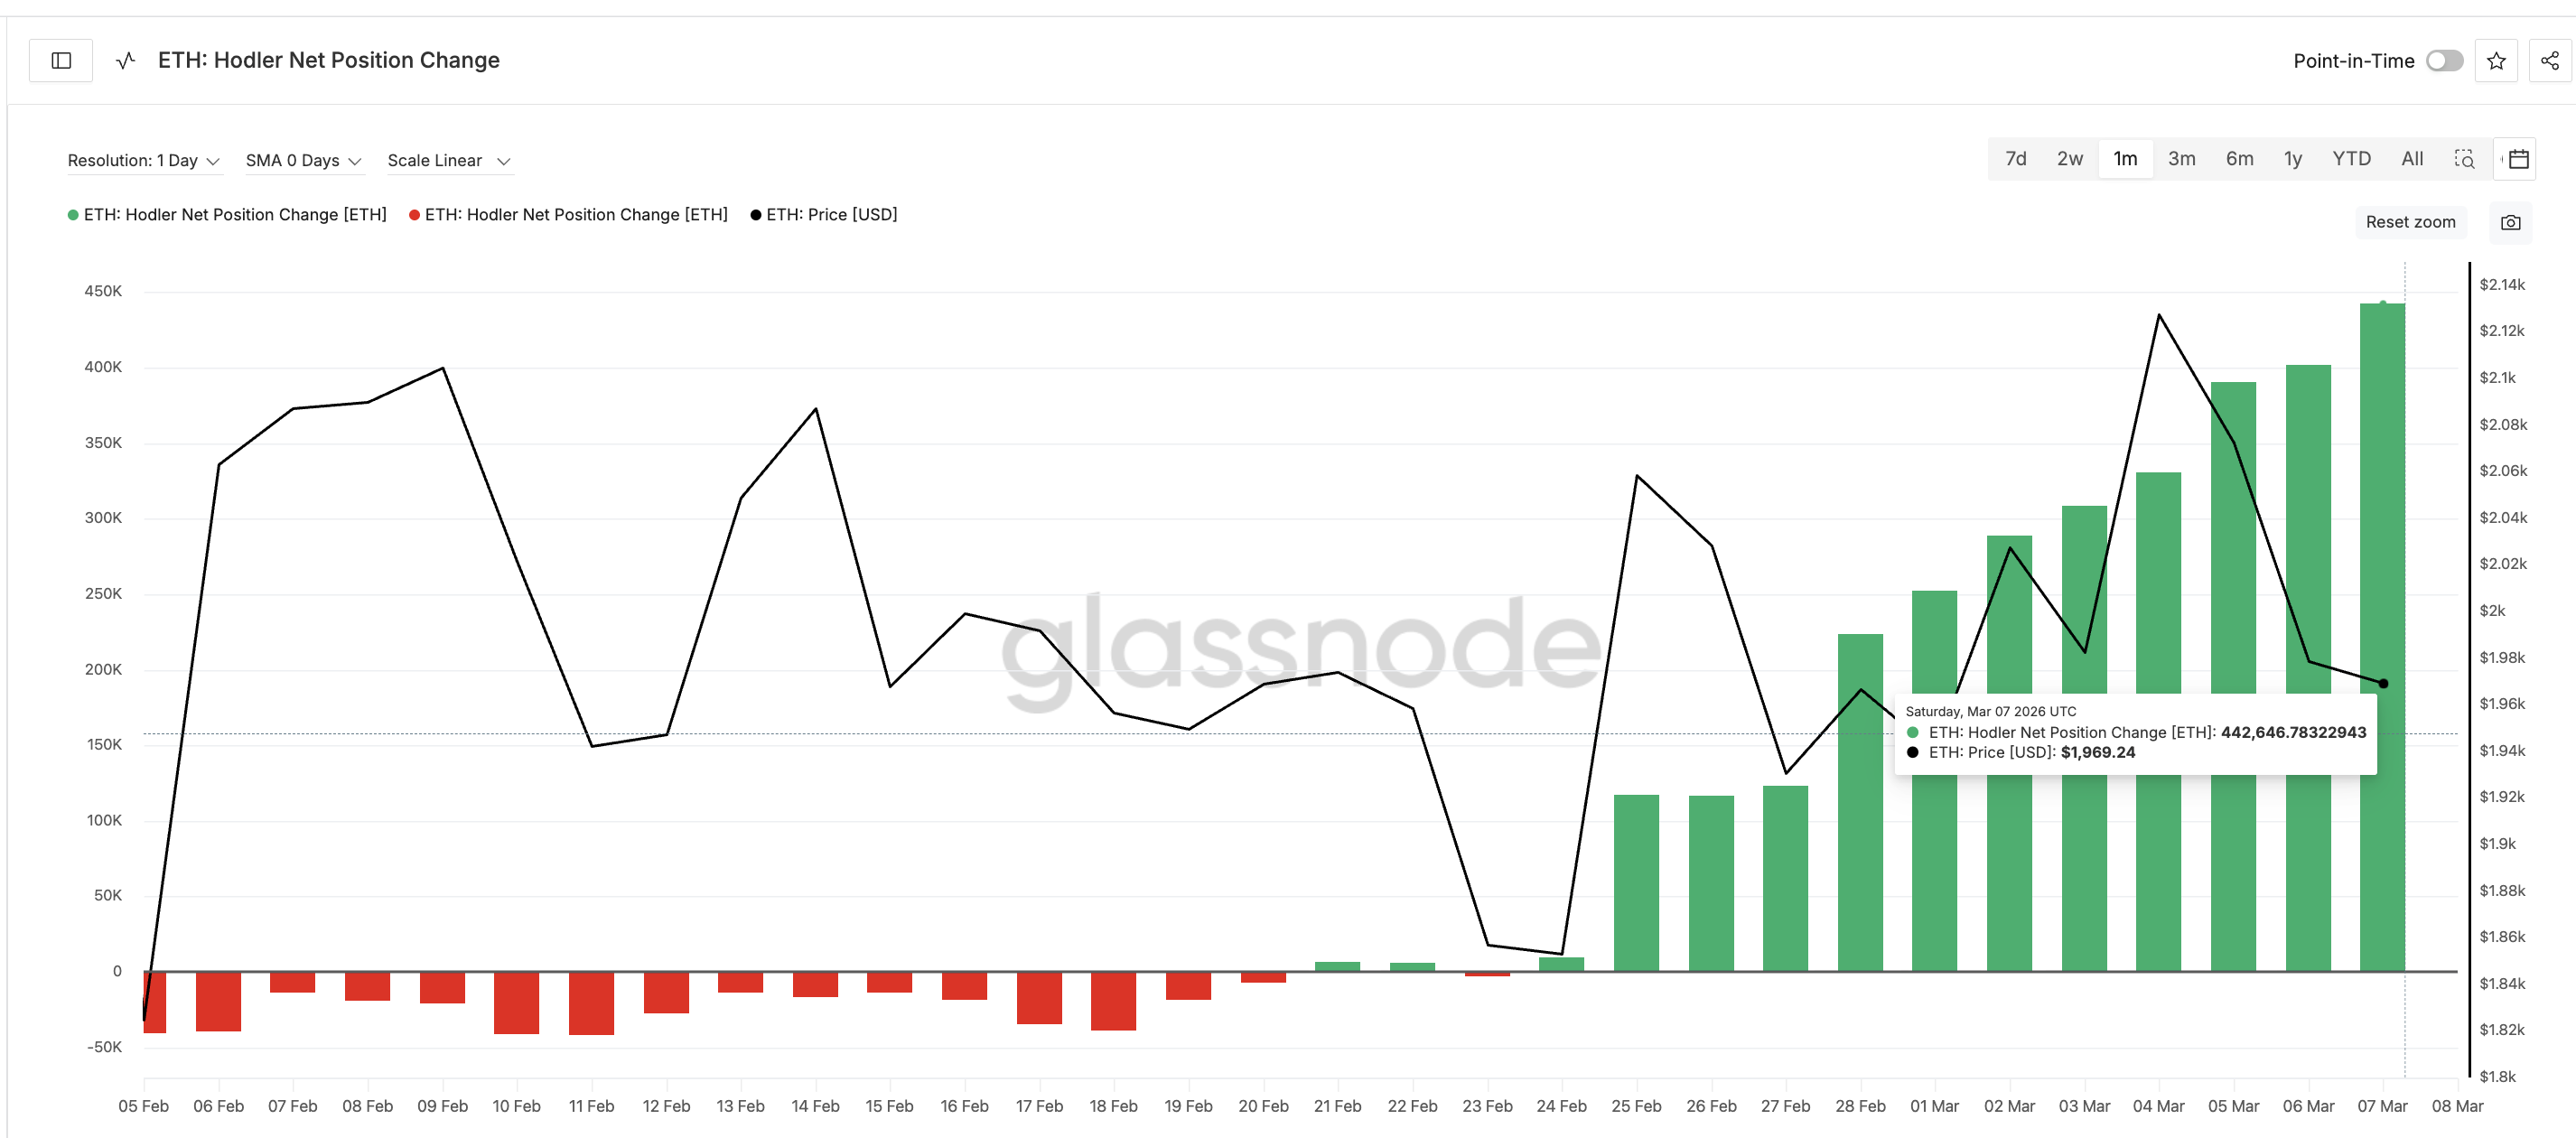
Despite the recent selling pressure, long-term Ethereum holders continue accumulating ETH. Glassnode data shows that the 30-day Holder Net Position Change, which tracks wallets holding ETH for 155 days or more, has been rising steadily.
On February 24, long-term holders had accumulated about 9,454 ETH. Since then, that figure has climbed sharply. At press time, the metric has increased to roughly 442,646 ETH, showing continued conviction among long-term investors. That’s a 4,500%+ rise in under two weeks.
 Hodlers Keep Buying: Glassnode
Interestingly, this accumulation trend began around the same time Ethereum entered the short-term rising channel (started developing on February 24), suggesting that these holders may still believe the broader structure remains intact. However, this optimism carries risk.
From a technical perspective, Ethereum must now reclaim $2,050, which corresponds to the 0.618 Fibonacci retracement level. A clear 8-hour close above $2,050 could open the path toward $2,180.
On the downside, the key support sits near $1,910. If Ethereum breaks below this level, it would confirm a breakdown of the rising channel. Such a move could push ETH toward $1,830 (the psychological $1,800 zone)
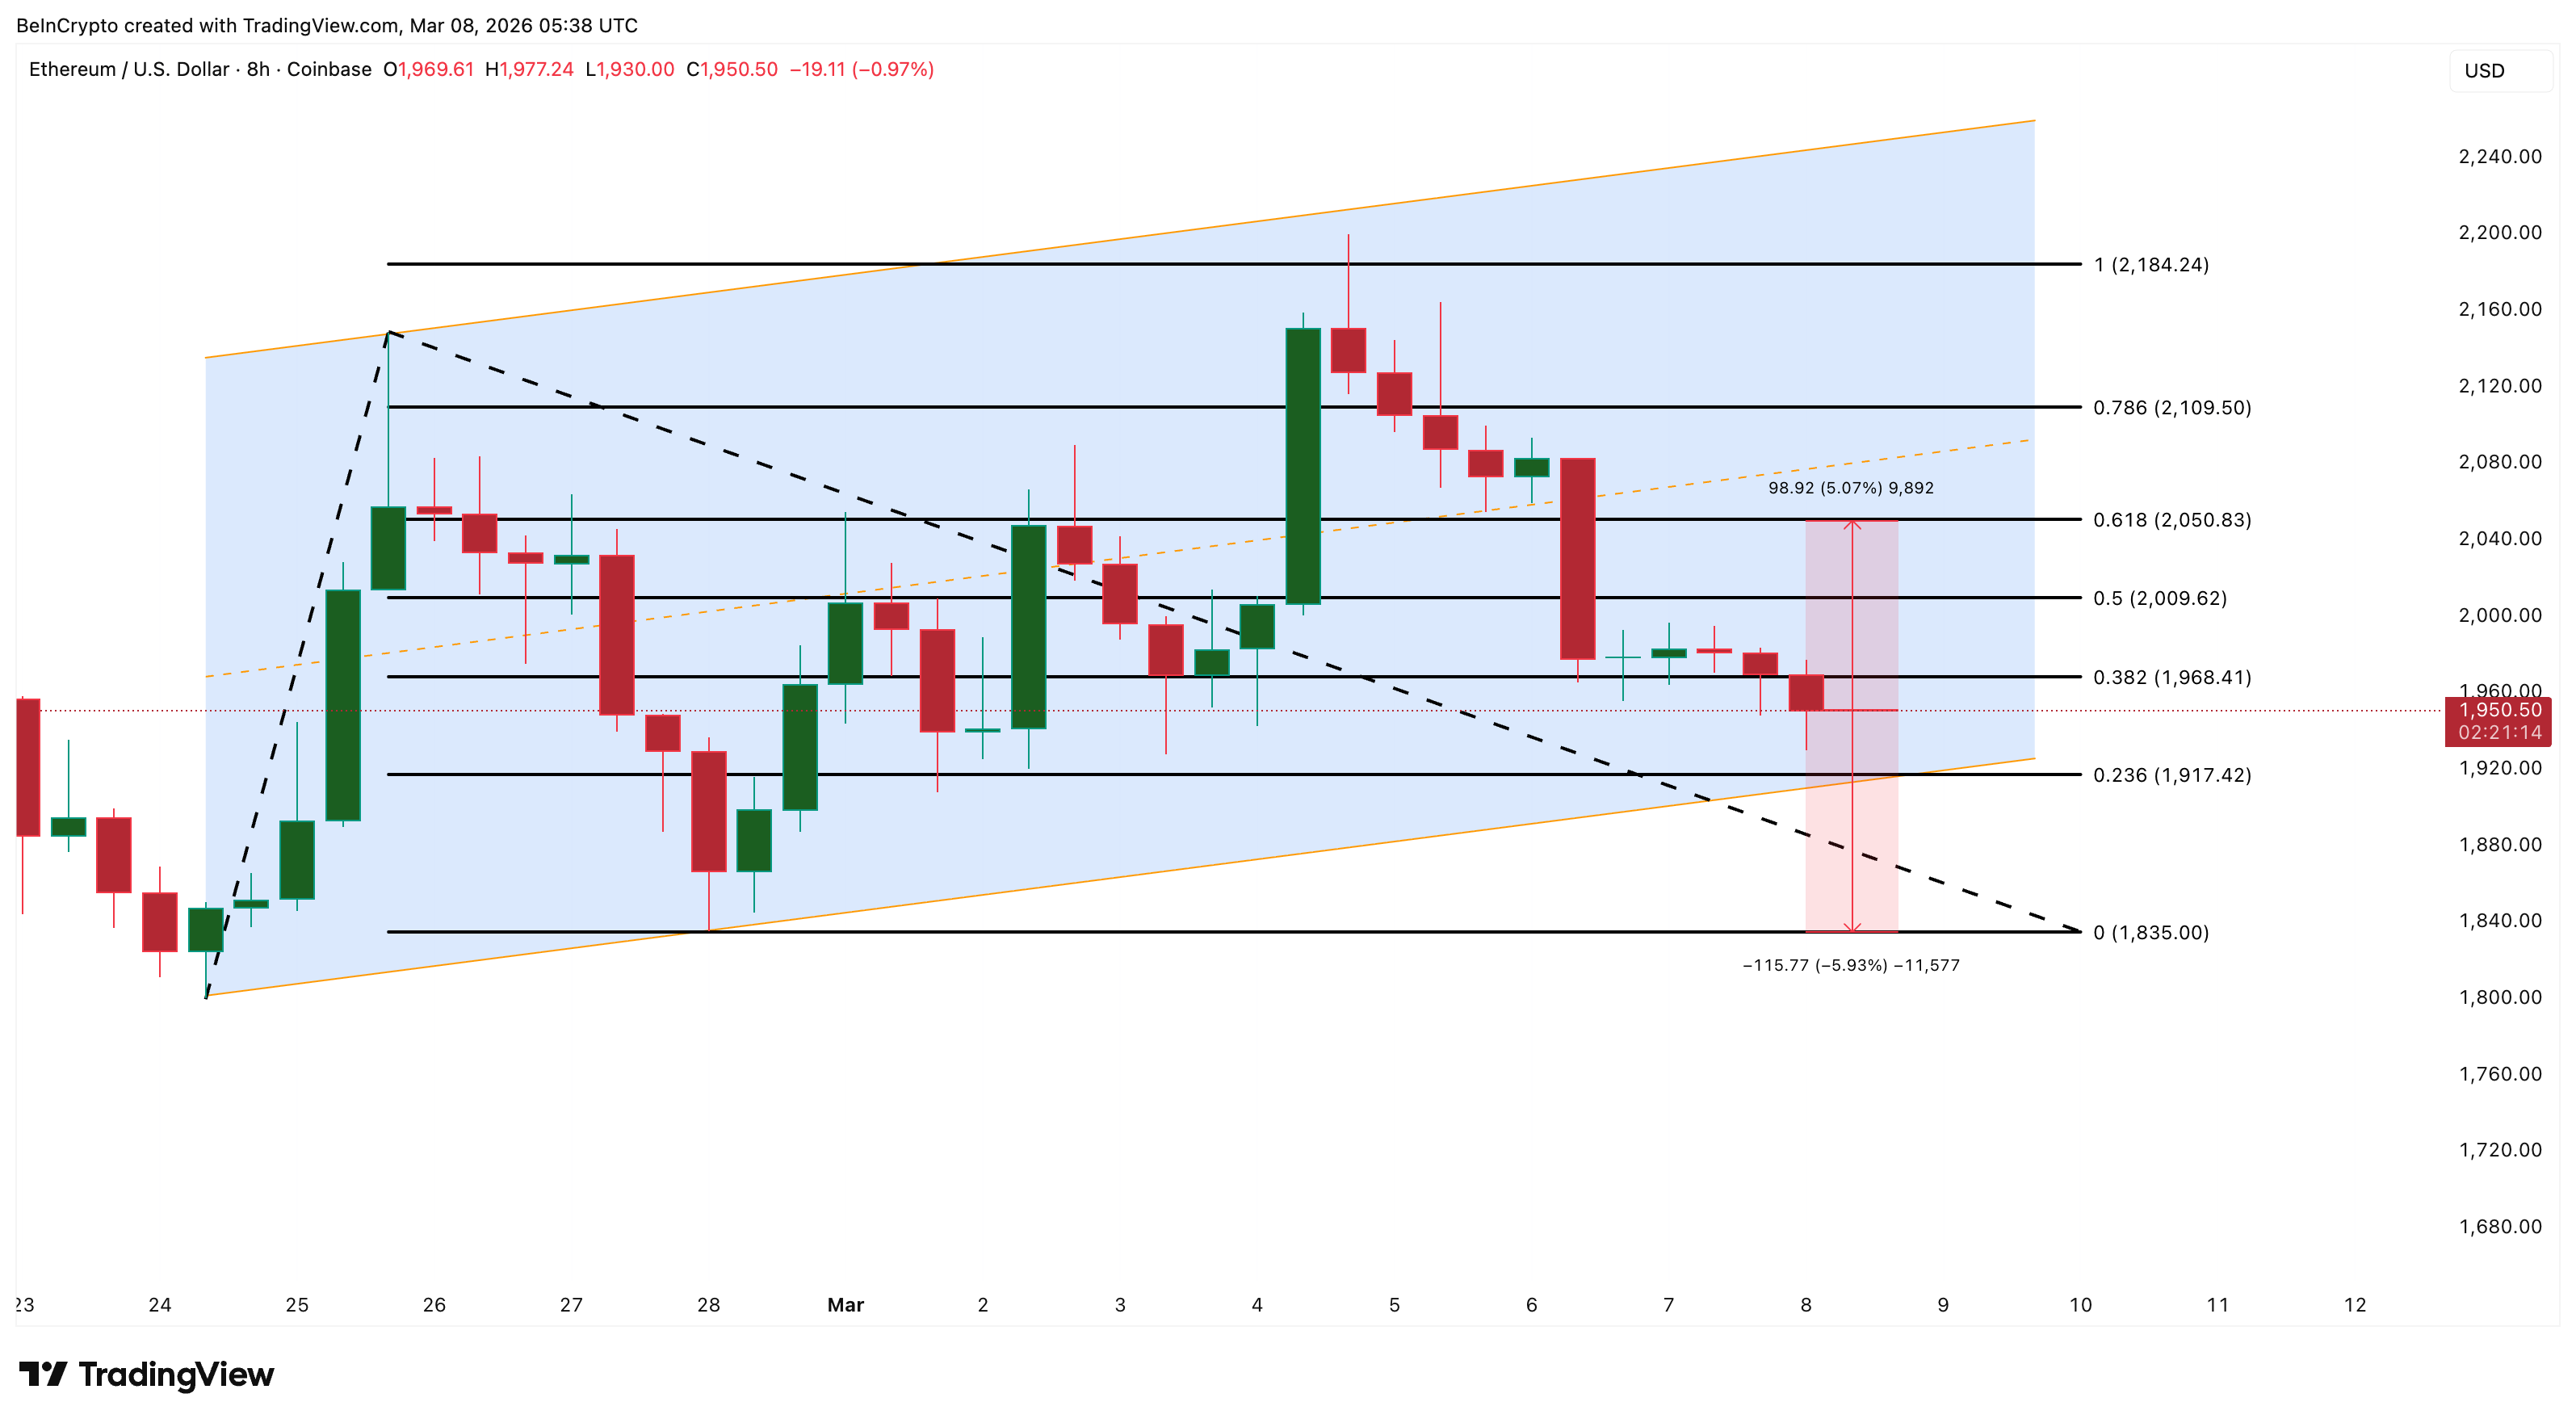 Ethereum Price Analysis: TradingView
For now, Ethereum’s market sits between two opposing forces. Founder selling and technical weakness are increasing downside pressure, while whale accumulation and long-term holder conviction continue to provide support. Whether ETH holds above the channel — or slips toward the $1,800 zone — may determine the next phase of the market.
0
0


 すべての暗号通貨、NFT、DeFiを1か所から管理
開始に使用しているポートフォリオを安全に接続します。


0
0

