Chainlink price prediction 2025-2031: A strong buy sentiment for LINK?

0
0

Key takeaways:
- Chainlink could reach a maximum value of $20.24 in 2025.
- By 2028, LINK could reach a maximum price of $64.19.
- In 2031, Chainlink will range between $164.95 and $202.37.
Chainlink (LINK) emerged as a prominent player in the cryptocurrency market. It provides a decentralized oracle network that connects smart contracts with real-world data, influencing the current price . As the adoption of decentralized finance (DeFi) and blockchain technology continues to grow, Chainlink’s innovative solutions have attracted significant attention from investors and developers alike.
Chainlink continues to expand its reach and utility across the blockchain ecosystem, showcasing its robust integration capabilities. Recent updates highlight 14 new integrations of 5 Chainlink services across 10 different blockchain platforms, demonstrating its versatility in multiple blockchains. , including prominent names like Arbitrum, Avalanche, and Ethereum. These integrations enhance Chainlink’s network and solidify its position as a critical player in decentralized applications’ interoperability and functionality.
Understanding Chainlink’s potential price movements involves analyzing various factors such as market trends, technological advancements, partnerships, and overall market sentiment. This chainlink price history prediction aims to provide insights into its future performance by examining technical analysis and fundamental aspects that could influence its value.
Overview
| Cryptocurrency | Chainlink |
| Token | LINK |
| Price | $13.45 |
| Market Cap | $9.27B |
| Trading Volume | $203.67M |
| Circulating Supply | 657.09M LINK |
| All-time High | $52.88 May 09, 2021 |
| All-time Low | $0.1263 Sep 23, 2017 |
| 24-hour High | $13.8 |
| 24-hour Low | $13.22 |
Chainlink price prediction: Technical analysis
| Metric | Value |
| Price prediction | $ 10.34 (-26.10%) |
| Volatility | 8.84% |
| 50-day SMA | $ 13.91 |
| 14-day RSI | 48.85 |
| Sentiment | Bearish |
| Fear & Greed Index | 52 (Neutral) |
| Green days | 14/30 (47%) |
| 200-day SMA | $ 16.55 |
Chainlink price analysis: LINK faces bearish pressure near key support zone
- Chainlink (LINK) faces strong resistance at $14.17 and struggles to maintain above critical support at $13.55.
- The digital asset is in a downtrend, with recent price action showing weakening momentum and declining trading volume.
- If LINK breaks below $13.55, it may reach the next support level at $13.10, intensifying the bearish sentiment.
Chainlink (LINK) is trading at $13.65 as of May 6th, 2025, marking a 2.85% decline in the last 24 hours. The digital asset is exhibiting a bearish trajectory, hovering just above the critical support at $13.55, while encountering strong resistance at $14.17. This range has become a pressure zone for LINK, with traders watching for a decisive breakout or breakdown.
Despite Chainlink’s continued relevance in decentralized finance (DeFi) and its ongoing utility across innovative contract platforms, recent price action reveals weakening momentum. Market participants appear hesitant, with price trending lower and trading volume declining, pointing to a lack of bullish conviction in the short term.
Chainlink 1-day chart: LINK struggles below key resistance as downtrend deepens
On the one-day chart, LINK is trading below its 20-day Exponential Moving Average, indicating that the asset remains in a short-term downtrend. The price has failed to break through the $14.17 resistance, a key level for bulls to reclaim to shift momentum.

The Relative Strength Index (RSI) on the daily chart is near 44.8, showing that LINK is approaching bearish territory but not yet oversold. If the price breaches the $13.55 support, it could initiate a steeper correction toward the next demand zone around $13.10. Sellers have been dominant, and the pattern of lower highs and lower lows confirms the downward trend.
Chainlink 4-hour chart: Bearish momentum persists as LINK clings to critical support
The 4-hour chart reinforces the bearish setup, with LINK continuing to post lower highs and lower lows. The asset struggles to maintain footing above the $13.55 support, and there is no visible bullish divergence on the short-term indicators.

The RSI on the 4-Hour chart remains weak and below the midpoint, while price action is trending under the short-term moving averages. Sellers stay firmly in control, and a break below $13.55 on this timeframe could accelerate the decline toward $13.10, in line with the daily outlook. Buyers must reclaim above $14.00 to challenge near-term resistance and shift momentum.
Chainlink technical indicators: levels and action
Daily simple moving average (SMA)
| Period | Value | Action |
| SMA 3 | $ 13.46 | BUY |
| SMA 5 | $ 14.43 | SELL |
| SMA 10 | $ 14.74 | SELL |
| SMA 21 | $ 14.11 | BUY |
| SMA 50 | $ 13.91 | BUY |
| SMA 100 | $ 15.99 | SELL |
| SMA 200 | $ 16.55 | SELL |
Daily exponential moving average (EMA)
| Period | Value | Action |
| EMA 3 | $ 13.62 | BUY |
| EMA 5 | $ 13.22 | BUY |
| EMA 10 | $ 13.10 | BUY |
| EMA 21 | $ 13.48 | BUY |
| EMA 50 | $ 14.87 | SELL |
| EMA 100 | $ 16.39 | SELL |
| EMA 200 | $ 16.69 | SELL |
What to expect from Chainlink?
As of writing, LINK price is trading at $13.37, declining over 1.8% in the last 24 hours. Buyers are strongly defending a drop below the $13 level. If the price breaks below $13 mark, we might see a strong bearish rally, pushing the price toward the low of $11.7.
On the other hand, if LINK price holds the $13 level strongly, buyers might create a strong upward rally. As a result, LINK price might aim for a surge toward $15.
Is Chainlink a good investment?
Chainlink (LINK) could be a substantial investment for those who believe in the long-term growth of decentralized applications. It is critical in connecting smart contracts to real-world data through its oracle network. It has shown recent bullish momentum, with strong support levels around $14.46 and potential for a breakout above $15. However, like all cryptocurrencies, it carries risks such as market volatility, regulatory uncertainty, and competition from other oracle providers. Investors should weigh these factors based on their risk tolerance and investment goals.
Why is LINK price down today?
Buyers failed to hold the momentum of LINK around the $14 level. As the price hovered below 23.6% Fib level, sellers gained control and triggered a decline.
Will Chainlink recover?
Chainlink’s price has declined recently, with minor short-term recoveries; however, the move is gradual. The general trend remains bearish as it seeks support amidst price volatility .
Will Chainlink reach $50?
Based on long-term forecasts, Chainlink (LINK) is projected to reach $50 by 2028, indicating potential future price movements. as its ecosystem and user adoption continue to grow.
Will Chainlink reach $100?
Chainlink can reach $100 in the year 2030, per expert predictions.
Does Chainlink have a good long-term future?
Chainlink shows some stabilization and potential for recovery, indicating the token may have a promising long-term future.
Chainlink price prediction May 2025
For May 2025, Chainlink is primed for notable growth. The minimum projected trading price is $13.40, with an average of around 14.81, relative to the current chainlink price. LINK is expected to attain a peak price of $15.24.
| Chainlink Price Prediction | Potential Low | Average Price | Potential High |
| Chainlink price prediction May 2025 | $13.40 | $14.81 | $15.24 |
Chainlink (LINK) price prediction 2025
The market price for LINK is expected to reach a maximum of $20.24 in 2025. However, traders can expect a minimum trading price of $16.99, which is influenced by the overall market capitalization and an expected average trading price of $17.69.
| Chainlink Price Prediction | Potential Low | Average Price | Potential High |
| Chainlink price prediction 2025 | $16.99 | $17.69 | $20.24 |
Chainlink price prediction 2026-2031
| Year | Minimum | Average | Maximum |
| 2026 | $24.82 | $25.71 | $30.02 |
| 2027 | $36.43 | $37.72 | $43.85 |
| 2028 | $52.39 | $54.27 | $64.19 |
| 2029 | $77.68 | $80.39 | $92.82 |
| 2030 | $115.08 | $119.10 | $138.01 |
| 2031 | $164.95 | $169.72 | $202.37 |
Chainlink price prediction 2026
In 2026, Chainlink is expected to reach a maximum value of $30.02, a minimum price of $24.82, and an average value of $25.71.
Chainlink price prediction 2027
In 2027, LINK’s average price is expected to be $37.72; its minimum and maximum trading prices are predicted to be $36.43 and $43.85, respectively, reflecting its historical performance .
Chainlink price prediction 2028
The price of Chainlink is predicted to reach a minimum level of $52.39 in 2028. LINK can reach a maximum level of $64.19, and an average price of $54.27.
Chainlink price prediction 2029
The Chainlink price prediction for 2029 suggests a minimum price of $77.68, a maximum price of $92.82, and an average forecast price of $80.39, considering the total crypto market cap .
Chainlink price prediction 2030
In 2030, Chainlink prediction expects LINK to reach a maximum value of $138.01, a minimum price of $115.08, and an average value of $119.10.
Chainlink price prediction 2031
The price of Chainlink is predicted to reach a minimum value of $164.95 in 2031. If the bulls hold, investors can anticipate a maximum price of $202.37 and an average trading price of $169.72.

Chainlink market price prediction: Analysts’ LINK price forecast
| Firm | 2025 | 2026 |
| DigitalCoinPrice | $30.99 | $36.12 |
| CoinCodex | $8.94 | $ 22.75 |
Cryptopolitan’s Chainlink price prediction
According to our Chainlink price forecast, the coin’s market price might reach a maximum value of $20.24 by the end of 2025. In 2026, the value of LINK could surge to a maximum price of $30.02.
Chainlink’s historic price sentiment
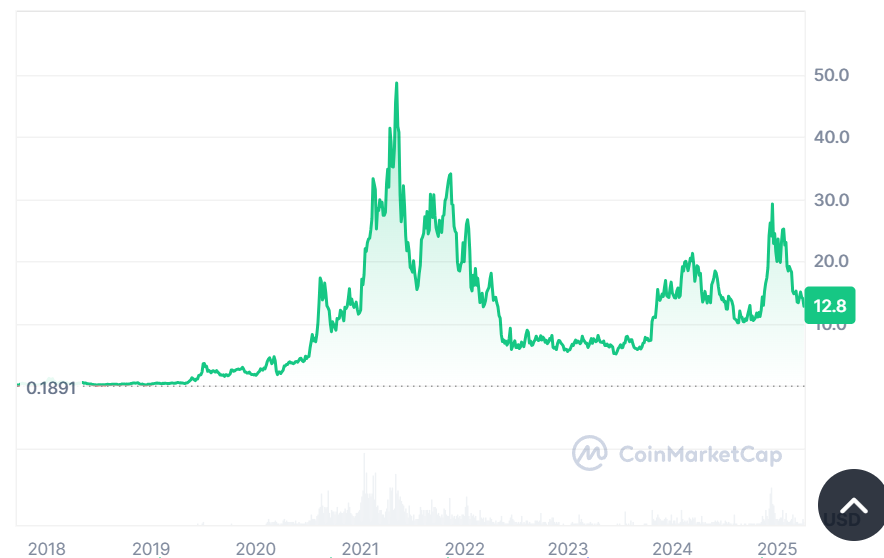
Chainlink price history of on chain smart contracts.
- Chainlink launched at around $0.20, and remained under $1 throughout 2018, with moderate market cap growth. In 2019, LINK had substantial growth, reaching $1 in May and peaking around $3 by year-end, driven by its utility in providing reliable data feeds for smart contracts.
- 2020 marked a breakout year as LINK surged from $2 to $20 by August, fueled by DeFi demand. In 2021, it reached an all-time high of around $52 in May but dropped to $22 by mid-year due to market volatility.
- In 2022, LINK ranged between $15 and $25 amid broader market corrections. In 2023, it further declined, stabilizing in the $6 to $13 range as investor sentiment cooled.
- Starting 2024 at $15, LINK briefly spiked to $18 in February before falling to $12 by April. The coin’s price has fluctuated throughout 2024, peaking near $15 in May, dropping to around $10 by August, and stabilizing between $10 and $12.28 in October. In November, LINK is trading within the range of $10.68 to $11.94. In December, LINK maintained a range of $18.43 to $30.94.
- In January 2025, Chainlink peaked at $22.9 but lost momentum towards the end of the month, leading to a trading range of $19.20- $21.00 in February.
- In March 2025, Chainlink (LINK) experienced a strong upward trend, starting at approximately $13.73 and steadily rising to $16.02, with periods of volatility.
- As of April, Chainlink (LINK) has shown relatively stable price movement, fluctuating between $12.60 and $13.20, indicating moderate volatility within a narrow trading range.
- In May, Chainlink (LINK) started trading at approximately $14.20 and experienced some price swings, dipping below $13.90 at its lowest point. As of the latest data, the price has slightly recovered and is currently around $14.06, showing mild volatility.
0
0

 从同一位置管理所有加密资产、NFT 和 DeFi 资产
安全地关联您正在使用的投资组合,以开始交易。


