
Hyperliquid Price Prediction: HYPE Eyes $73 After Breakout

0
0

Hyperliquid price prediction traders have been watching one trendline for weeks, and it just gave way.
HYPE spent since late July grinding lower under a descending trendline, got rejected on the first retest with a fresh lower low, then came back a second time and actually broke through.
Since then, the price has been hovering right around that breakout zone, almost daring the market to pick a side. Add in a fresh protocol upgrade making headlines, and this setup has a lot going on at once.
This analysis is based on a 4-hour chart structure and short-term liquidation data, so it reflects near-term positioning only and should be rechecked if the price moves outside the range below.
Hyperliquid Price Right Now
Metric | Value |
Current Market Price (CMP) | $55.533 |
24h Change | +0.63% (+$0.3477) |
24h Futures Volume | $1.13B |
24h Spot Volume | $63.73M |
Market Cap | $14.00B |
Open Interest | $2.30B |
Circulating Supply | 252.65M HYPE |
Total Supply | 952.69M HYPE |
Open interest is the total value of futures contracts still open on an exchange.
At $2.30B against a $14.00B market cap, HYPE is carrying an unusually large amount of leveraged exposure relative to its size, which is part of why the liquidation swings around this breakout have been so sharp.
Source: CoinGlass, captured 12 August 2026, 16:23 IST (10:53 UTC). Chart source: TradingView, HYPE/USDT Perpetual, Binance, 4-hour timeframe, same timestamp.
Hyperliquid Expands HIP-1 With New Token Repricing Feature
Fresh protocol news is adding weight to this setup.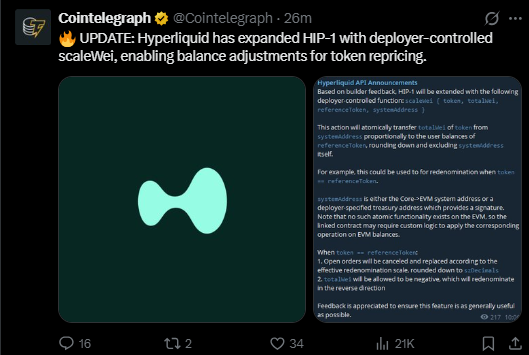
Hyperliquid's API team confirmed an update to HIP-1 that introduces deployer-controlled scaleWei functionality, enabling balance adjustments for token repricing.
In simple terms, this lets a token's deployer atomically transfer total supply from a system address proportionally across user balances, a mechanism that could be used for redemption scenarios.
The update landed while HYPE sits right at its breakout retest zone, giving this Hyperliquid technical analysis an added fundamental angle beyond the chart alone.
Source: Cointelegraph on X, posted 26 minutes before capture.
Liquidation Data
Liquidations over the past day have leaned heavily toward shorts getting squeezed.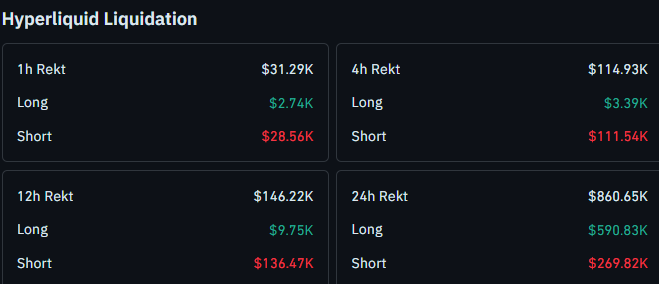
In the last hour, $31.29K was liquidated in total, with shorts taking $28.56K against just $2.74K in longs.
Over 4 hours, $114.93K was liquidated, again dominated by shorts at $111.54K versus $3.39K in longs. The 12-hour window shows the same pattern, with $136.47K in short liquidations against $9.75K in longs, out of $146.22K total.
Over 24 hours, $860.65K was liquidated overall, though this window flips the script somewhat, with longs taking $590.83K against $269.82K in shorts, showing the broader move down from late July still trapped plenty of buyers before this breakout took hold.
Source: CoinGlass Liquidation data, same timestamp.
Key Takeaways
HYPE trades near $55.533, up 0.63% over the past 24 hours, holding just under a small descending trendline formed since the breakout
A close above $57.989 opens the path to $60.429, then $63.450, $69.121, and $72.966
A close below $53.316 shifts focus to $51.135 as the next support
All levels referenced come from recent swing highs and lows on the 4-hour chart
Short positions have taken the overwhelming majority of liquidations across every timeframe today
Hyperliquid Price Prediction: What the Chart Shows
HYPE has been spending since late July, falling under a descending trendline. The first retest of that trendline produced a lower low, extending the downtrend.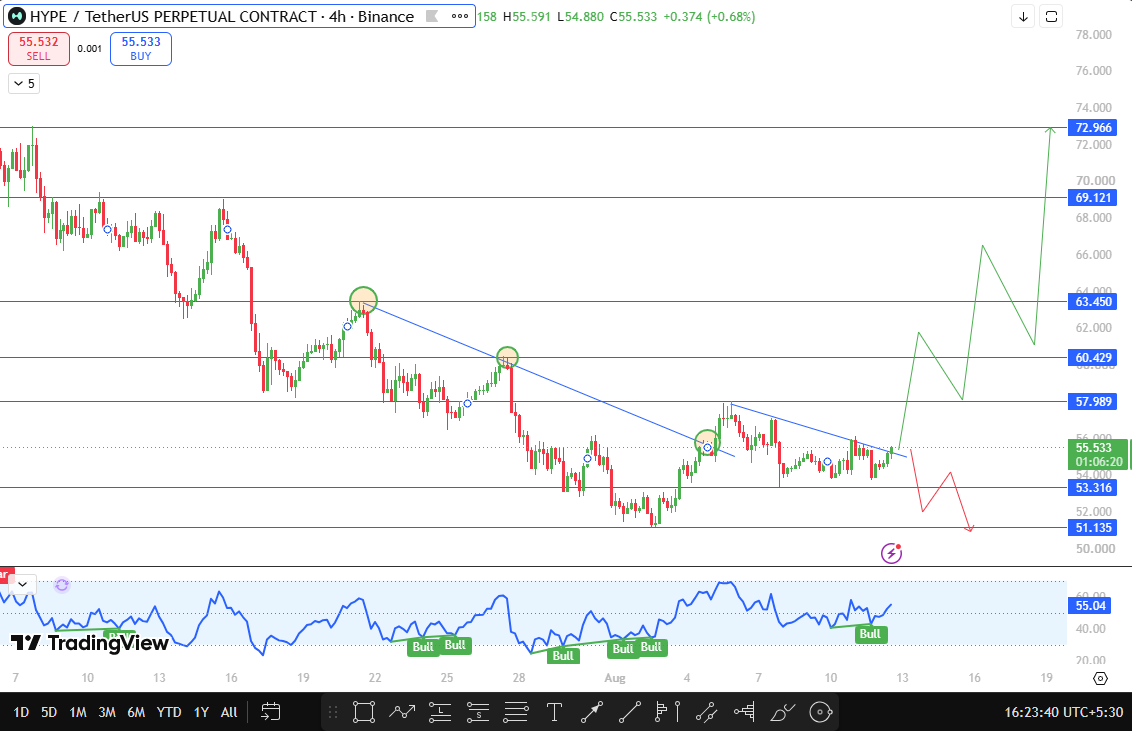
The second retest was different: price broke through the trendline and has held the breakout zone since.
Since that break, a small new descending trendline has formed from the wicks of recent candles, sitting just above the current price.
This is a shorter, tighter structure than the original trendline and is worth watching separately from the bigger picture.
The built-in oscillator on this chart is showing repeated "Bull" tags across recent sessions, lining up with the trendline break and suggesting momentum has genuinely shifted since the breakout rather than just stalling.
A close above $57.989 would clear this small trendline and confirm the breakout is continuing.
That opens the path to $60.429 first, then $63.450, followed by $69.121 and $72.966 as extended targets further out.
On the downside, a close below $53.316 would put the breakout in doubt, and the next support to watch is $51.135.
Hyperliquid Support and Resistance Levels to Watch
Type | Level | Note | % From CMP |
Support | $51.135 | Recent swing low; next level if $53.316 fails | -7.9% |
Breakdown support | $53.316 | Recent swing low | -4.0% |
Small trendline resistance | $57.989 | Recent swing highs cap the post-breakout retest structure. | +4.4% |
Resistance | $60.429 | Recent swing high | +8.8% |
Resistance | $63.450 | Recent swing high | +14.3% |
Resistance | $69.121 | Recent swing high | +24.5% |
Major resistance | $72.966 | Recent swing high | +31.4% |
Risk-Reward Table
Case | Trigger | Target |
Bull Case | Close above $57.989 | $60.429, then $63.450, $69.121, $72.966 |
Bear Case | Close below $53.316 | $51.135 |
What Would Change This Hyperliquid Price Prediction
This setup stays intact as long as HYPE holds above $53.316, with the bigger structural trendline break from late July still valid.
A close above $57.989 would confirm continuation and open the door to the extended targets above.
A close below $53.316 would put the breakout in doubt and shift focus to $51.135. Since these are all recent swing-based levels, this read should be rechecked if the price closes decisively outside this range within the next several sessions.
Glossary
Descending Trendline: A downward-sloping line connecting a series of lower highs, used to gauge whether a downtrend is intact.
Trendline Retest: When price returns to test a broken trendline from the other side, often to confirm the breakout is valid.
Open Interest: The total value of futures contracts still open on an exchange.
Swing High/Low: A short-term peak or trough in price used to mark recent support and resistance levels.
Disclaimer
This content is for informational purposes only and does not constitute financial or trading advice. Cryptocurrency markets are highly volatile and leveraged positions carry substantial risk of loss. Always do your own research before making trading decisions. CoinGabbar and the analyst do not hold a position in HYPE at the time of publication.
0
0

 从同一位置管理所有加密资产、NFT 和 DeFi 资产
安全地关联您正在使用的投资组合,以开始交易。


