Why Is the Crypto Market Down Today?

0
0

The total crypto market cap (TOTAL) and Bitcoin (BTC) barely noted any decline over the last 24 hours, which is a positive sign despite the broader market cues being bearish. Movement (MOVE) took a relatively bigger hit as it fell by nearly 6% over the last 24 hours.
In the news today:-
- Following Thursday’s viral Studio Ghibli-themed trend, Binance Alpha listed two meme coins, Ghiblification and GhibliCZ. Ghiblification reached a $35 million market cap, while GhibliCZ hit $14 million, prompting Binance to add them to its pre-listing Alpha platform.
- Panama has introduced a draft bill to regulate cryptocurrencies and promote blockchain-based services, aiming to position itself as a fintech leader in Latin America. The proposed law establishes a legal framework for digital assets, licensing requirements for service providers, and compliance measures aligned with international financial standards.
The Crypto Market Holds
The total crypto market cap has declined by less than $10 billion on the daily chart, indicating stability. At $2.78 trillion, the crypto market is not significantly influenced by broader macro-financial conditions, suggesting that it is maintaining a level of resilience amidst fluctuations.
In the coming days, TOTAL is likely to hover between $2.85 trillion and $2.74 trillion. The market will continue to consolidate within this range unless either the market conditions improve significantly or worsen.
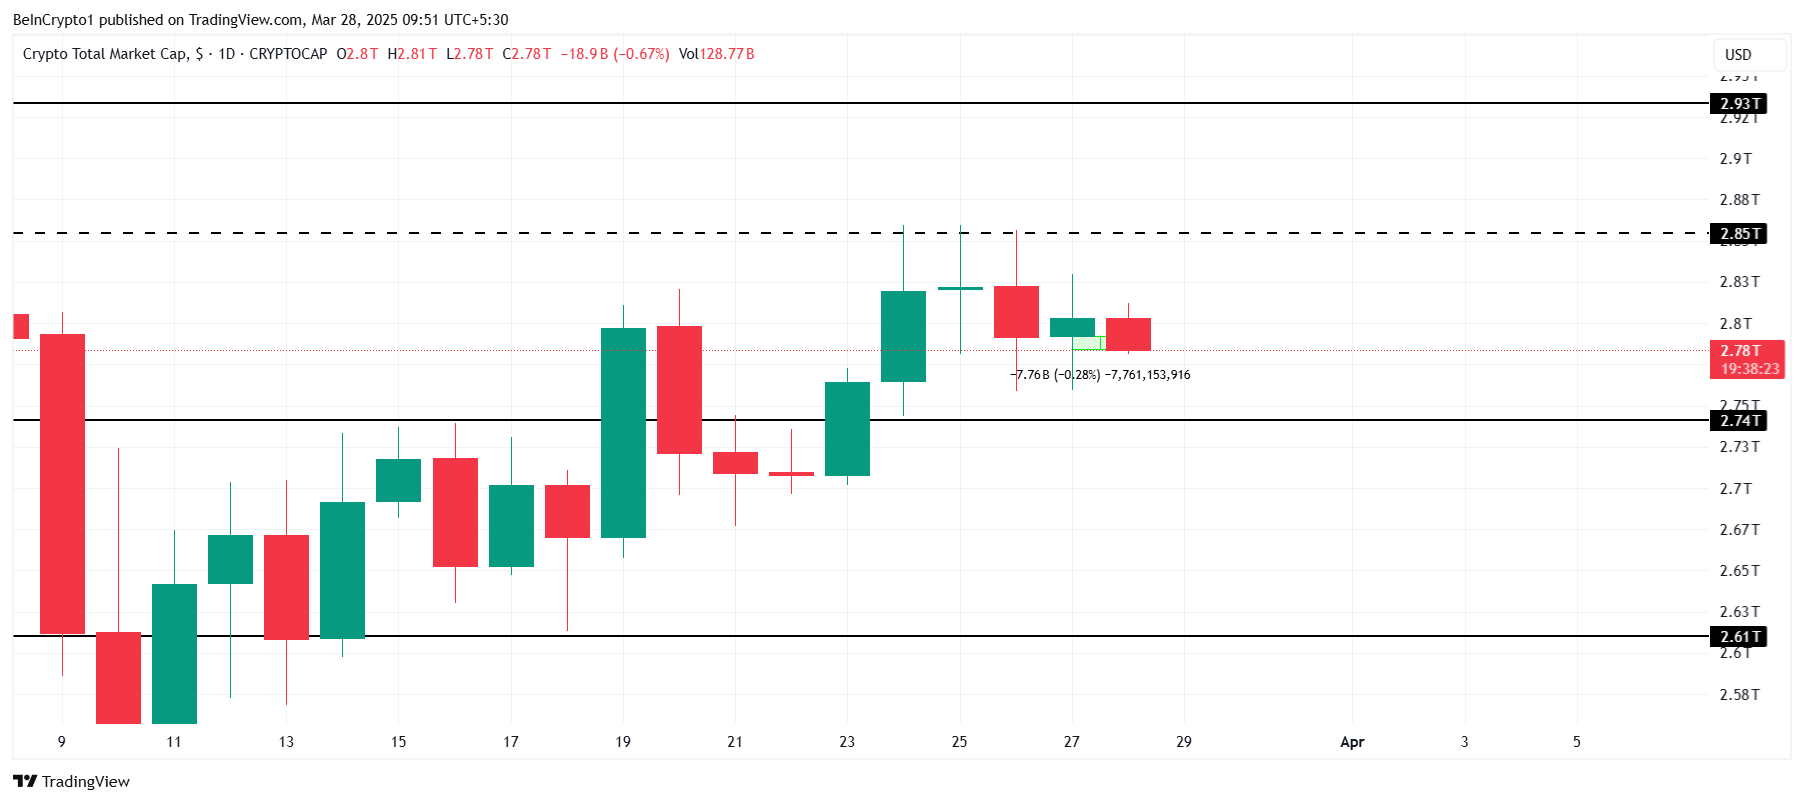 Total Crypto Market Cap Analysis. Source: TradingView
If market conditions improve, the crypto market cap could break through the $2.85 trillion resistance and move toward $2.93 trillion. This would be a key target for investors, as it would help recover the recent losses and restore bullish momentum in the market.
Bitcoin Finds Stability
Bitcoin’s price is currently at $86,690, moving within a consolidation range between $85,000 and $89,800. Additionally, the price is stuck between the 50-day and 200-day EMA, highlighting a lack of clear direction. This consolidation phase is indicative of market indecision and could set the stage for a breakout or breakdown.
Although Bitcoin seems to be closing in on a Death Cross, its formation depends on investor behavior and broader market sentiment. If Bitcoin falls below the $85,000 support level, the Death Cross could be triggered, increasing the bearish sentiment and potentially leading to further price declines in the short term.
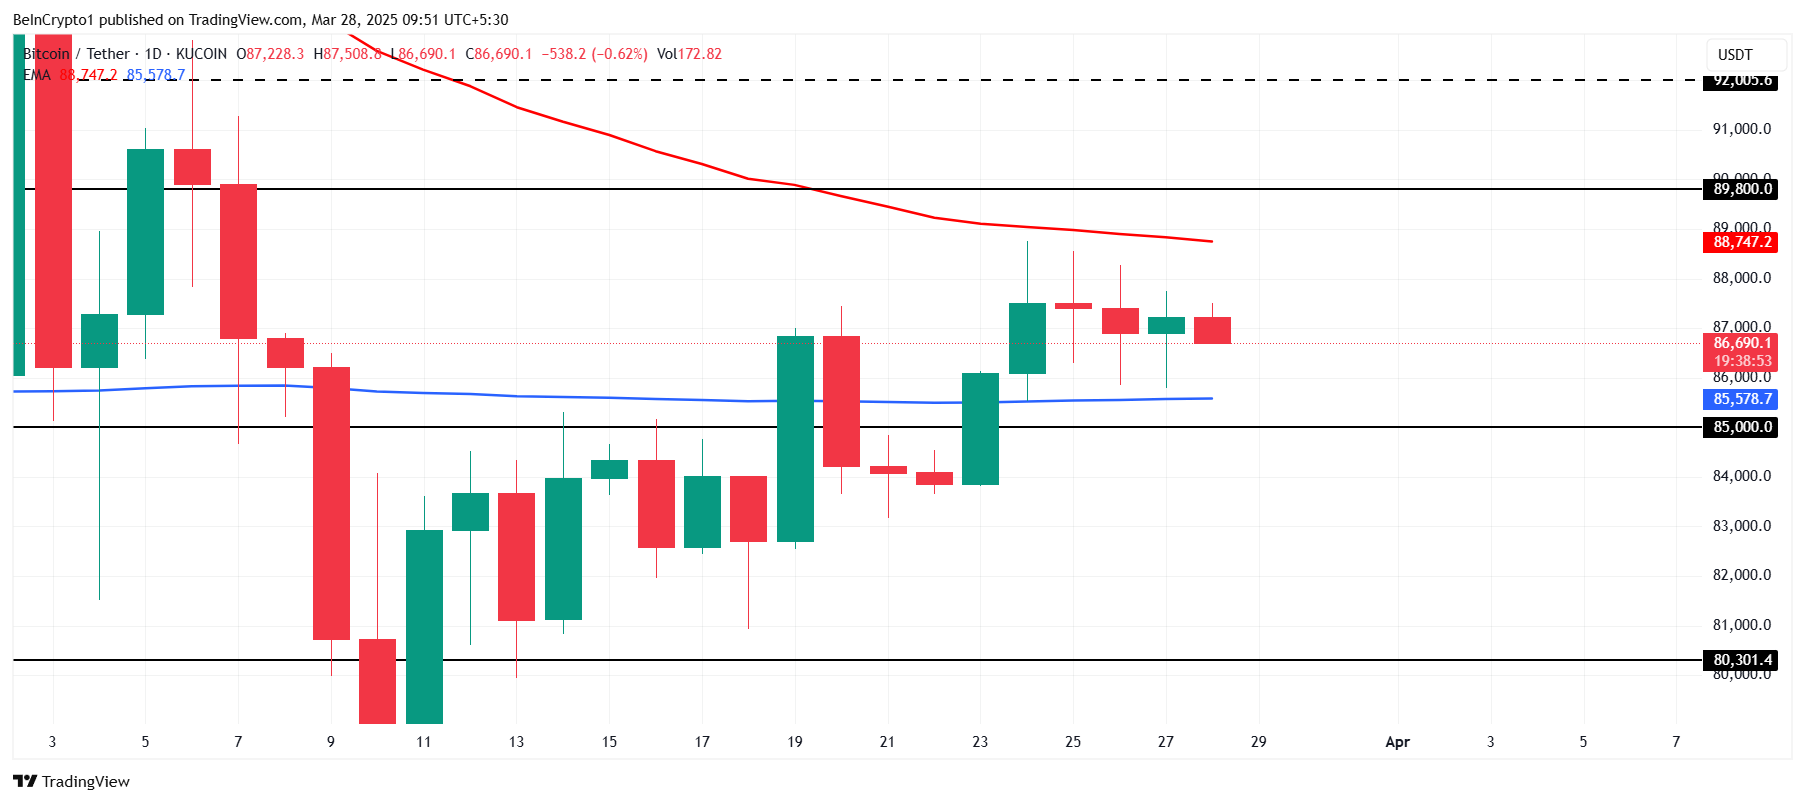 Bitcoin Price Analysis. Source: TradingView
If market conditions improve, Bitcoin has the potential to breach the 50-day EMA and push past the $89,800 resistance level. A successful break above these levels would invalidate the bearish thesis and signal a potential rally.
Movement Loses Gains
MOVE emerged as one of the worst-performing tokens of the day, with a near 6% decline on the daily chart. Despite this, the limited slide indicates market stability, suggesting that the token’s performance is not being heavily influenced by extreme volatility. This could provide a more predictable price range.
Currently holding above the key support level of $0.476, MOVE is in a critical position for potential recovery. However, if bearish market signals take hold, the token may fall through this support. A decline to $0.420 would erase recent gains, reinforcing the bearish outlook and signaling a potential downtrend.
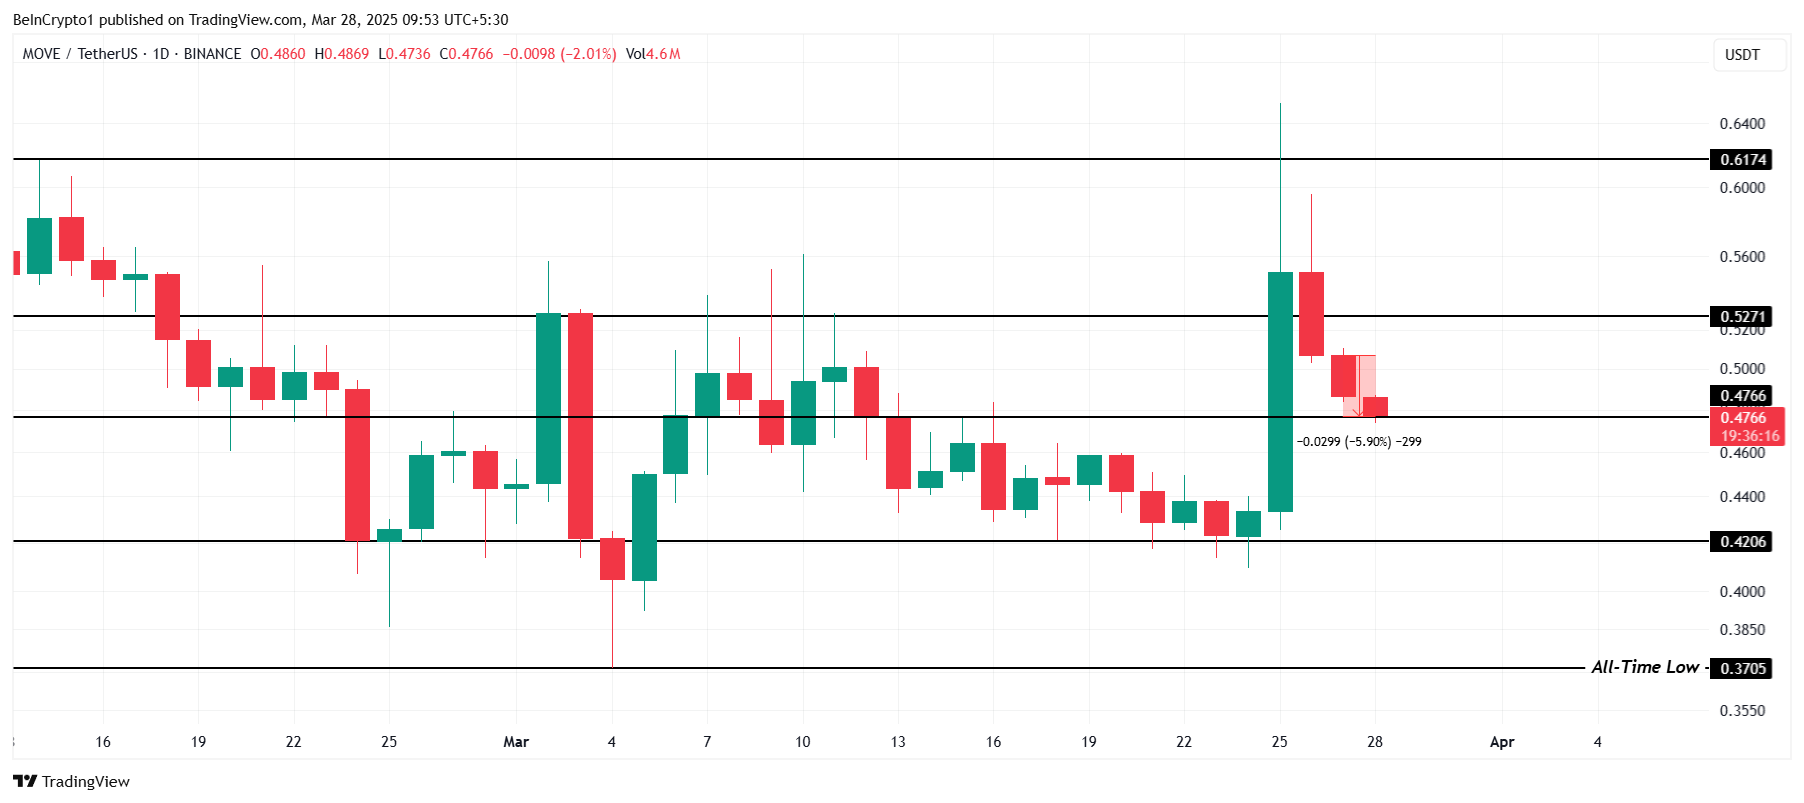 MOVE Price Analysis. Source: TradingView
If MOVE manages to bounce off the $0.476 support, it could push through the $0.527 resistance barrier. Successfully flipping this level into support would completely invalidate the bearish thesis, opening the door for further price appreciation and a potential reversal of recent losses.
0
0


 Verwalten Sie alle Ihre Kryptowährungen, NFTs und DeFi an einem Ort
Verbinden Sie sicher das Portfolio, das Sie zu Beginn verwenden möchten.

0
0


