These 4 Charts Suggest the Bitcoin Bull Run Is Not Over
5h ago•

bullish:
0
bearish:
0
Share

Several charts show that the Bitcoin bull run may not be over, with the report coming amid broader market fears. BTC recorded its all-time high of $73,777 on Binance in mid-March, with multiple attempts to reclaim this peak proving unsuccessful.
Alongside the latest Bitcoin price correction, global equity sell-offs, over $1 trillion wiped from the stock market, and the S&P and NASDAQ recording their worst dumps since 2022 have spooked markets.
Why Bitcoin Bull Run Remains Viable
Four charts suggest the Bitcoin bull run may still be viable despite market fears and BTC’s move drawing away from its 2024 peak.
MVRV Momentum
The Market Value to Realized Value (MVRV) Momentum indicator monitors a market trend’s resilience, strength, and direction. As long as this indicator (orange) stays above its 365-day moving average (blue), the Bitcoin price uptrend will prevail.
Accordingly, analysts looking for this signal to increase their holdings can capitalize on price corrections to buy BTC, provided the above condition is met.
Read more: How To Buy Bitcoin (BTC) and Everything You Need To Know
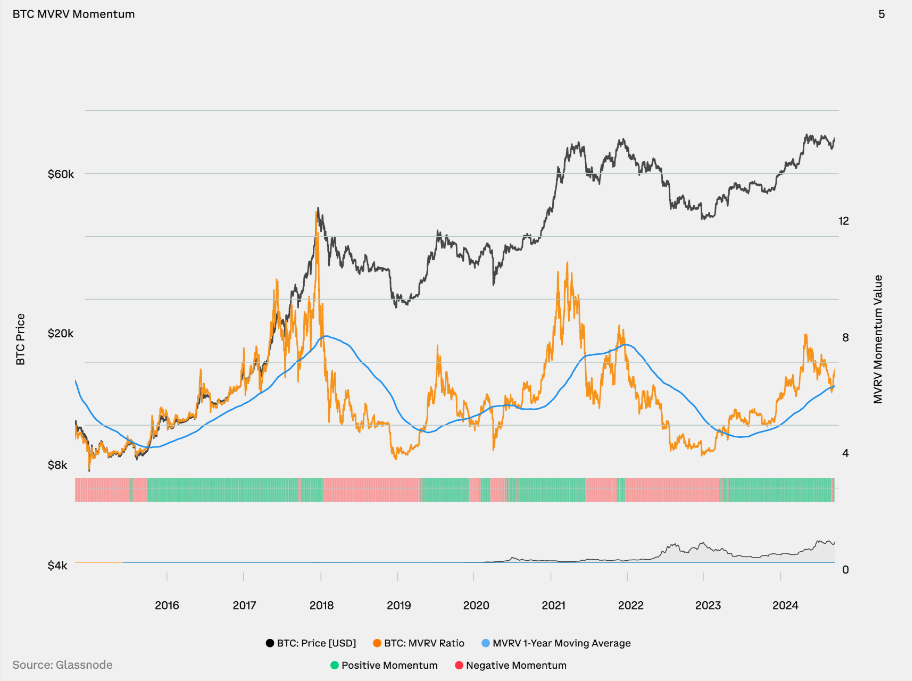 Bitcoin MVRV Momentum. Source: Coinbase
Nevertheless, if the MVRV crosses below its 365-day average, it would mean token holders are sitting on unrealized losses. They may often consider exiting their positions to avoid further losses.
“In early July, the MVRV ratio pulled back to and found support near its 365d moving average. This occurred near the correction lows, and suggests that the 2024 uptrend remains intact, with investor profitability remaining positive,” James Check, Lead Analyst at Glassnode, wrote.
BTC ETF Inflows vs. New Issuance Spot ETFs
Another reason the Bitcoin Bull Run may still be intact is the demand for spot BTC ETFs. Following the US Securities and Exchange Commission’s (SEC) decision to approve the financial instrument, institutional investors joined retail investors in the BTC market.
The ensuing demand pressure continues to provide tailwinds for Bitcoin’s price. A comparison of spot Bitcoin ETFs flow with new supply from miners since the financial instrument started trading on January 11 shows that demand for ETFs has significantly outpaced issuance.
Read more: How To Trade a Bitcoin ETF: A Step-by-Step Approach
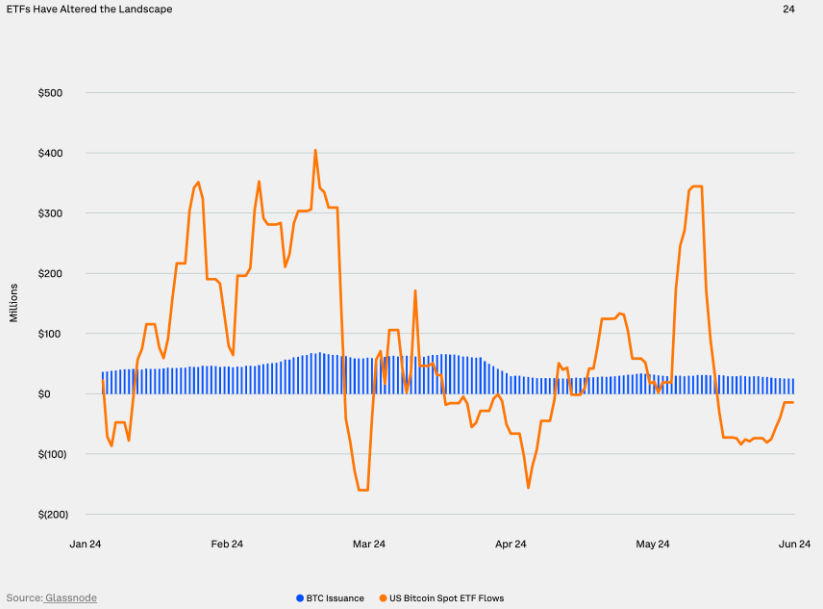 BTC ETF Inflows vs. New Issuance Spot ETFs. Source: Coinbase
Crypto and macro-finance data tracker SoSo Value shows that the cumulative total net inflow since January 11 is $17.50 billion
BTC Price Performance Since Halving
Bitcoin price performance since the fourth halving also bolsters the case for BTC Bull market viability, showing there is still some runway left. In hindsight, the pioneer crypto has chopped horizontally in the immediate aftermath of each halving cycle before rising significantly within the year.
- After first halving (orange line): Bitcoin climbed over 1,000% in the first 12 months.
- After the second halving (turquoise line), Bitcoin climbed 200% in the first 12 months.
- After the third halving (green line), Bitcoin gained more than 600% in the first 12 months.
Since the fourth halving (black line) on April 19, 2024, the price of Bitcoin has fallen 2%. BTC may have a meaningful move up in its sleeve if history rhymes, with almost nine months left for price discovery.
Read more: Bitcoin Halving History: Everything You Need To Know
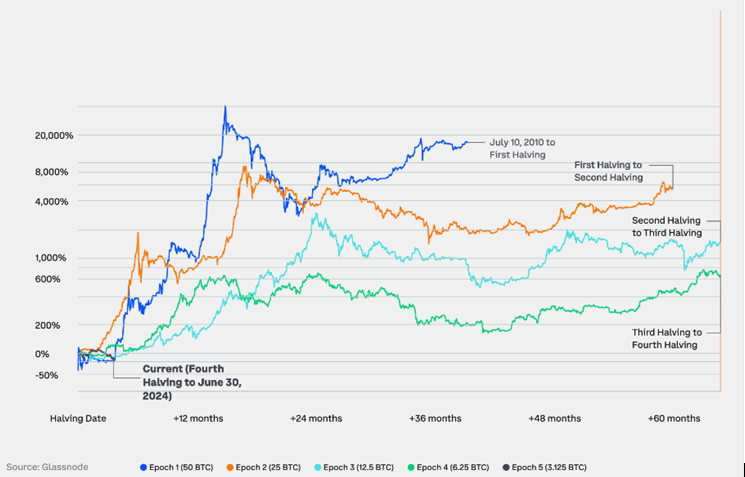 Bitcoin Market Cycle After Halving Epochs. Source: Coinbase
Asset Class Performance
The performance of Bitcoin based on history also supports the Bull Run potential. Looking back, Bitcoin has been the top-performing asset in eight of the past 11 years. It only underperformed in 2014, 2018, and 2022, with large drawdowns.
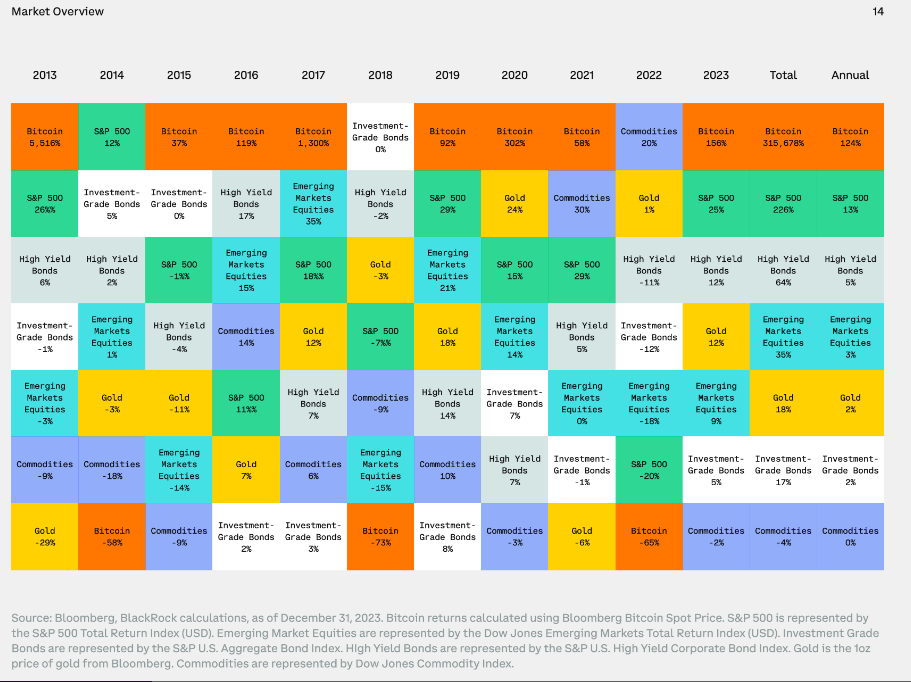 Bitcoin Performance Over the Year. Source: Coinbase
The chances of Bitcoin performing poorly in 2024 seem low, based on past trends like monthly performance. November has often been the best month for Bitcoin, and the fourth quarter also tends to be strong. From 2013 to 2022, Bitcoin’s average monthly returns were 5.91% in Q1, 32.83% in Q2, 4.21% in Q3, and 93.38% in Q4.
The Coinglass statistics show Bitcoin gains momentum between Q2 and Q4, with the latter proving to be the best at 93.38%. The adjacent tabulation corroborates the story, showing that Q2, with October and November also bearing promise.
Read more: Bitcoin (BTC) Price Prediction 2024/2025/2030
Nevertheless, while Bitcoin’s momentum could carry it to new heights, it may also face challenges. Regulatory developments, macroeconomic events, technological advancements, and market sentiment will influence its trajectory.
5h ago•
bullish:
0
bearish:
0
Share


 Manage all your crypto, NFT and DeFi from one place
Securely connect the portfolio you’re using to start.

bullish:
0
bearish:
0

bullish:
0
bearish:
0

bullish:
0
bearish:
0

bullish:
0
bearish:
0