Zilliqa (ZIL) Struggles Continue as Price Dips Below Critical Zone

0
0

ZIL, the utility token of the permissionless blockchain Zilliqa, has seen its price decrease by 37.29% this year. While holders may be hoping for a recovery, analysis suggests that decline may continue for some time.
In March, the token reached a yearly high of $0.040. But revisiting the region could be a difficult task, and here is why.
Zilliqa Bears Maintain Control Despite Rising Attention
As of this writing, ZIL’s price is $0.016. On the daily chart, it trades below the 20 EMA. EMA stands for Exponential Moving Average and is a technical indicator that tracks price changes of an asset within a set period.
In simple terms, when a cryptocurrency’s price is above the EMA, the trend is bullish. Conversely, if the price falls below the EMA, the trend is bearish. The ZIL/USD chart shows that the price remained above the 20 EMA until July 30.
The position at the time improved the hopes of recovery. Since it is now below it, that hope may have been shattered as ZIL may continue to trend downwards.
Read more: Zilliqa (ZIL) Staking: A Step-by-Step Guide for Beginners
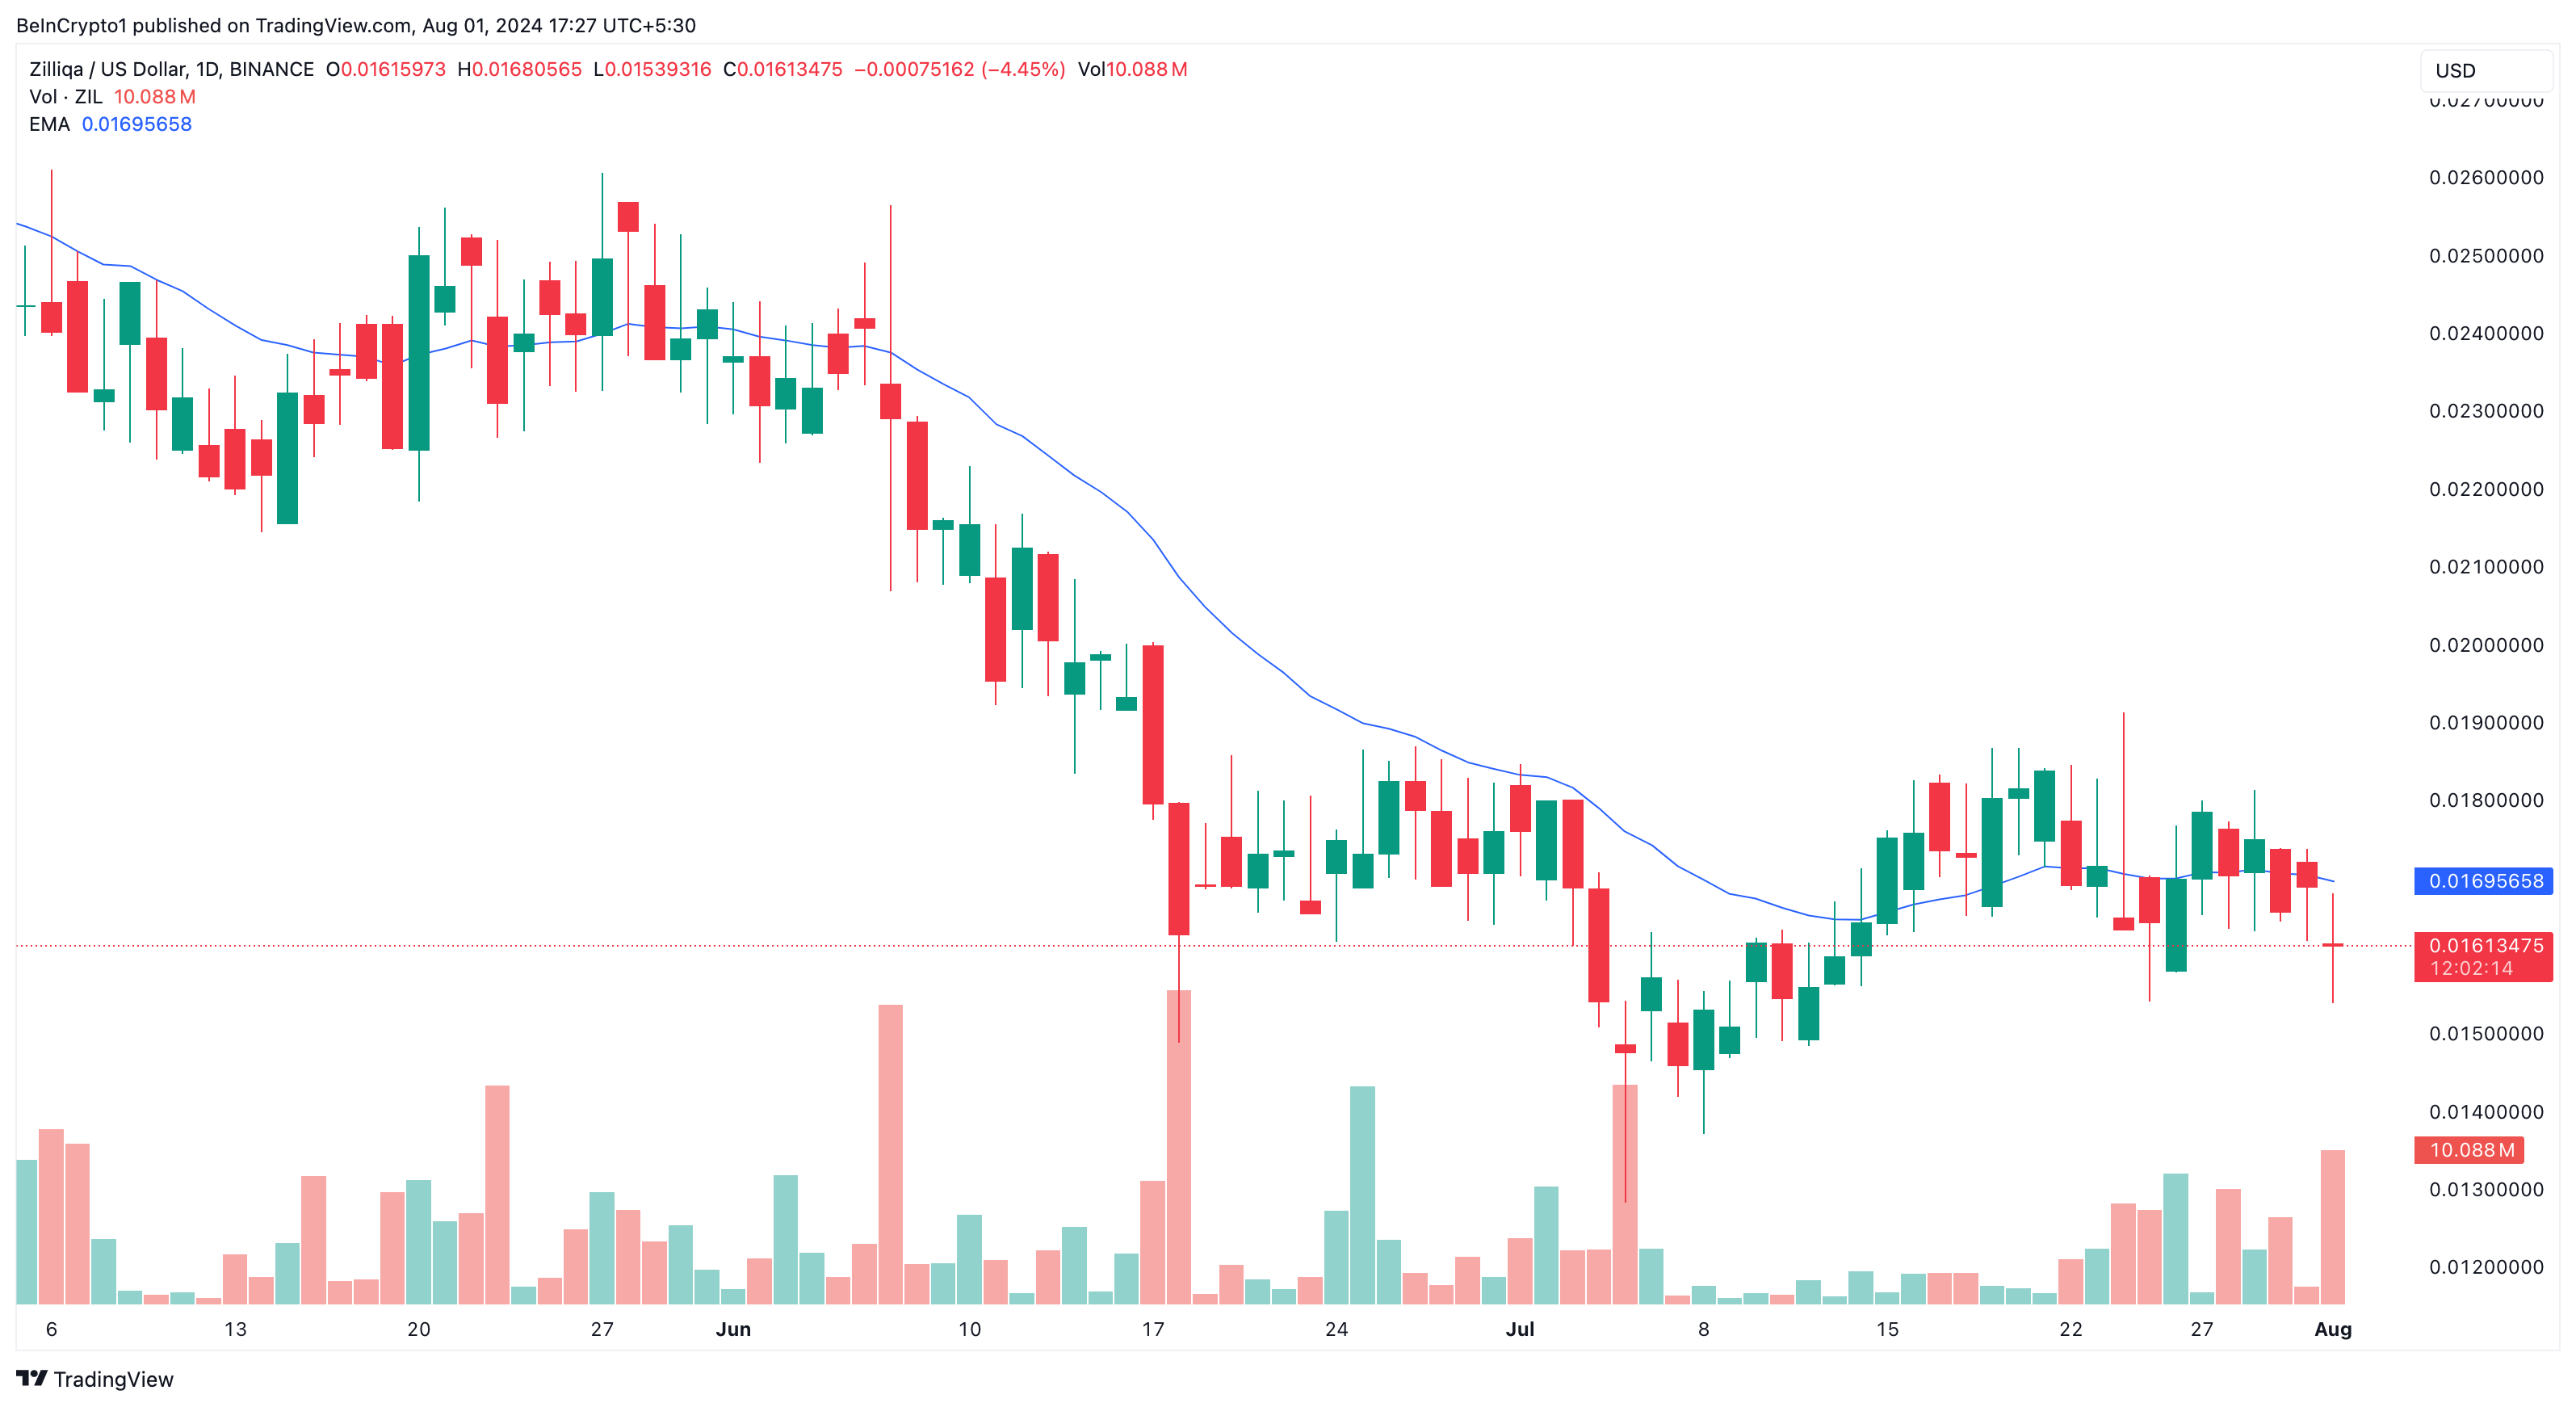 Zilliqa Daily Analysis. Source: TradingView
Despite the decline, Zilliqa’s social dominance has spiked. The social dominance metric compares the rate of discussions around a cryptocurrency to that of other projects.
A rise in social dominance means that crypto is getting a good dose of media coverage. On the other hand, a decline implies that other cryptocurrencies are getting more recognition.
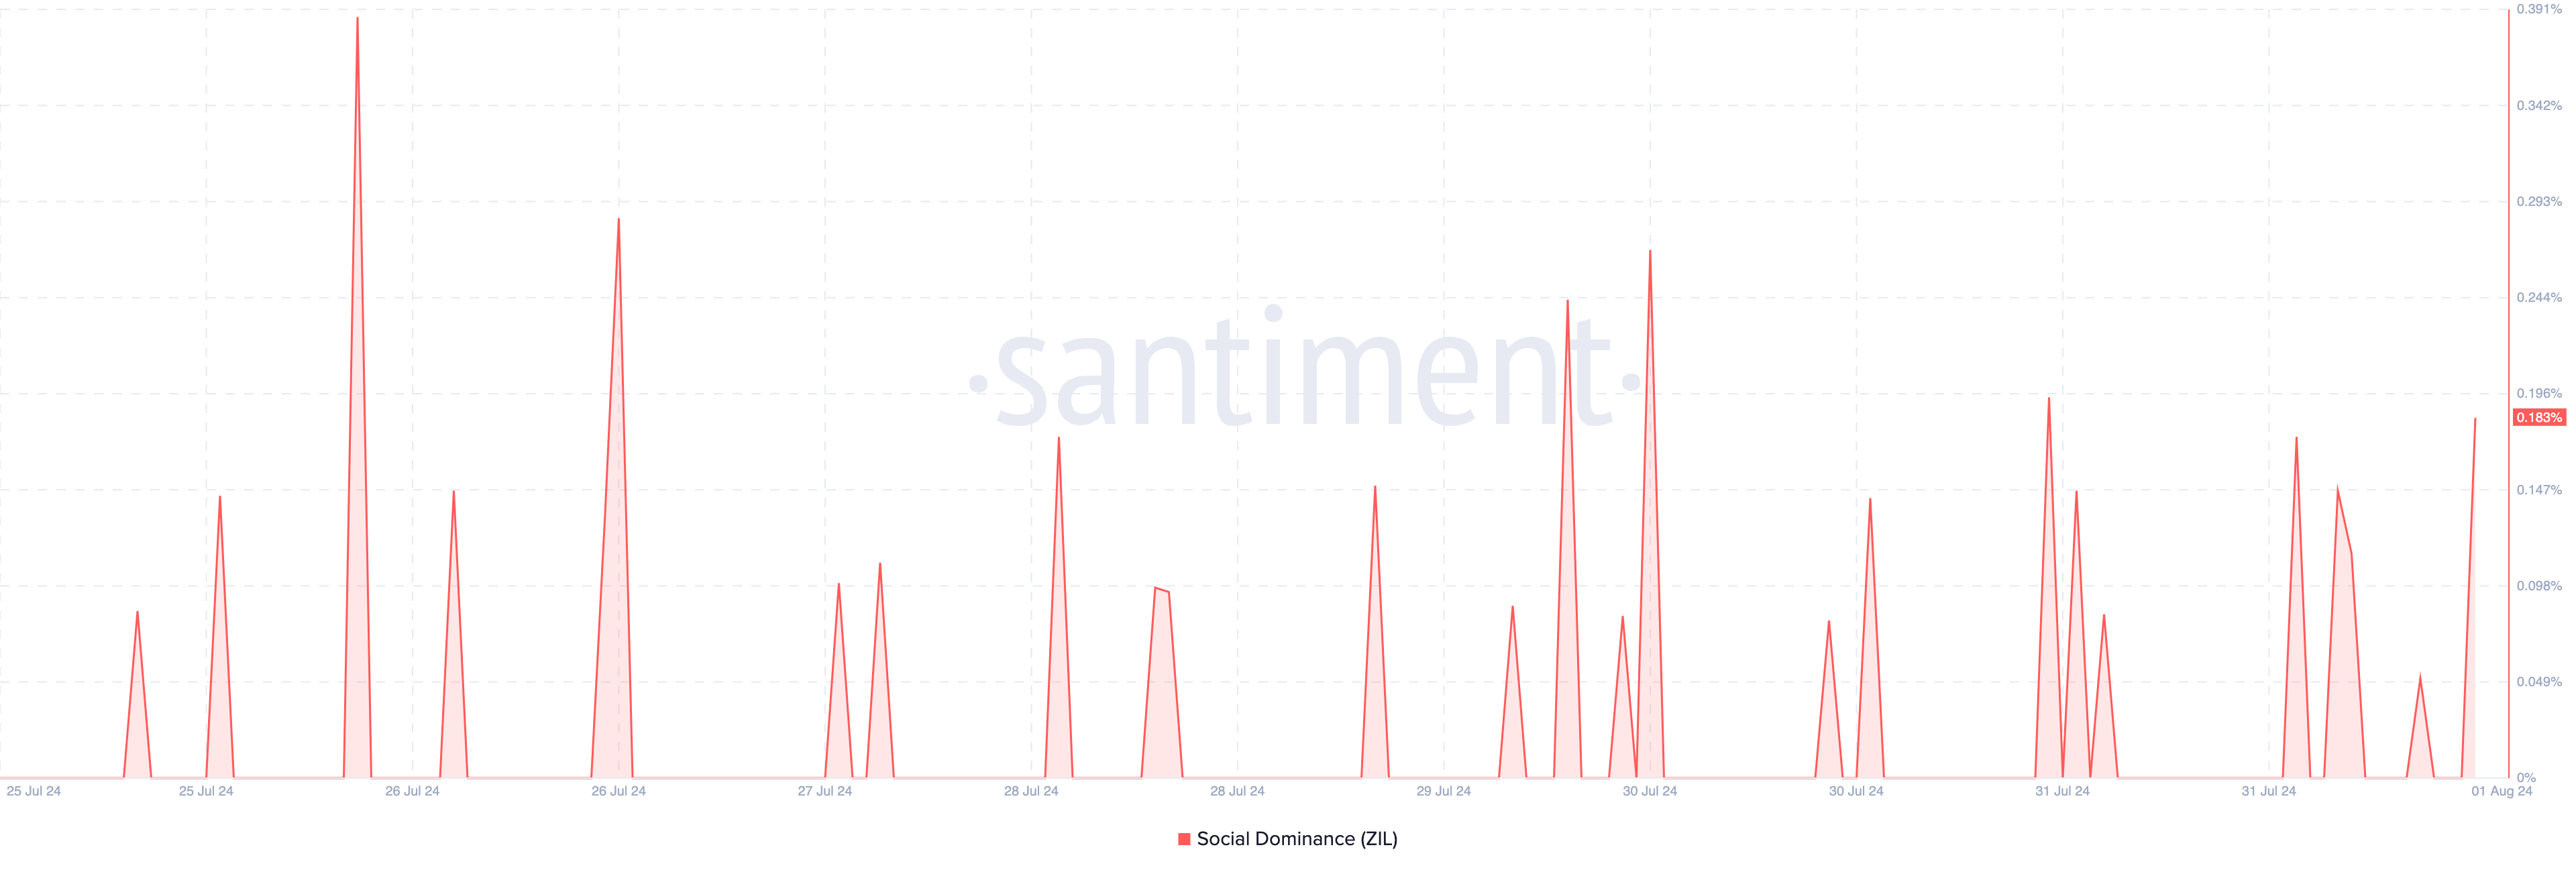 Zilliqa Social Dominance. Source: Santiment
Therefore, ZIL’s current condition aligns with an increase in messages and posts related to it. While ZIL may be receiving a relatively good level of market attention, this does not validate a price increase.
ZIL Price Prediction: Further Correction Ahead
Further assessment of ZIL’s price action shows that the token may experience consolidation over time. One of the grounds for this thesis is the Awesome Oscillator (AO). The AO compares the long and short-term price movement of a cryptocurrency to determine momentum.
When the indicator is above the midpoint, it means that momentum is increasing upwards. However, if the reading is in the red region, it suggests increasing downward momentum. The latter is the case with ZIL, especially with the appearance of a red histogram bar.
In addition, ZIL may struggle to exit the downturn. If selling pressure increases, the price may drop to $0.015. Failure to defend this point could force a correction to $0.012, especially if Bitcoin’s (BTC) price continues to fall.
Read more: Zilliqa (ZIL) Price Prediction 2024/2025/2030
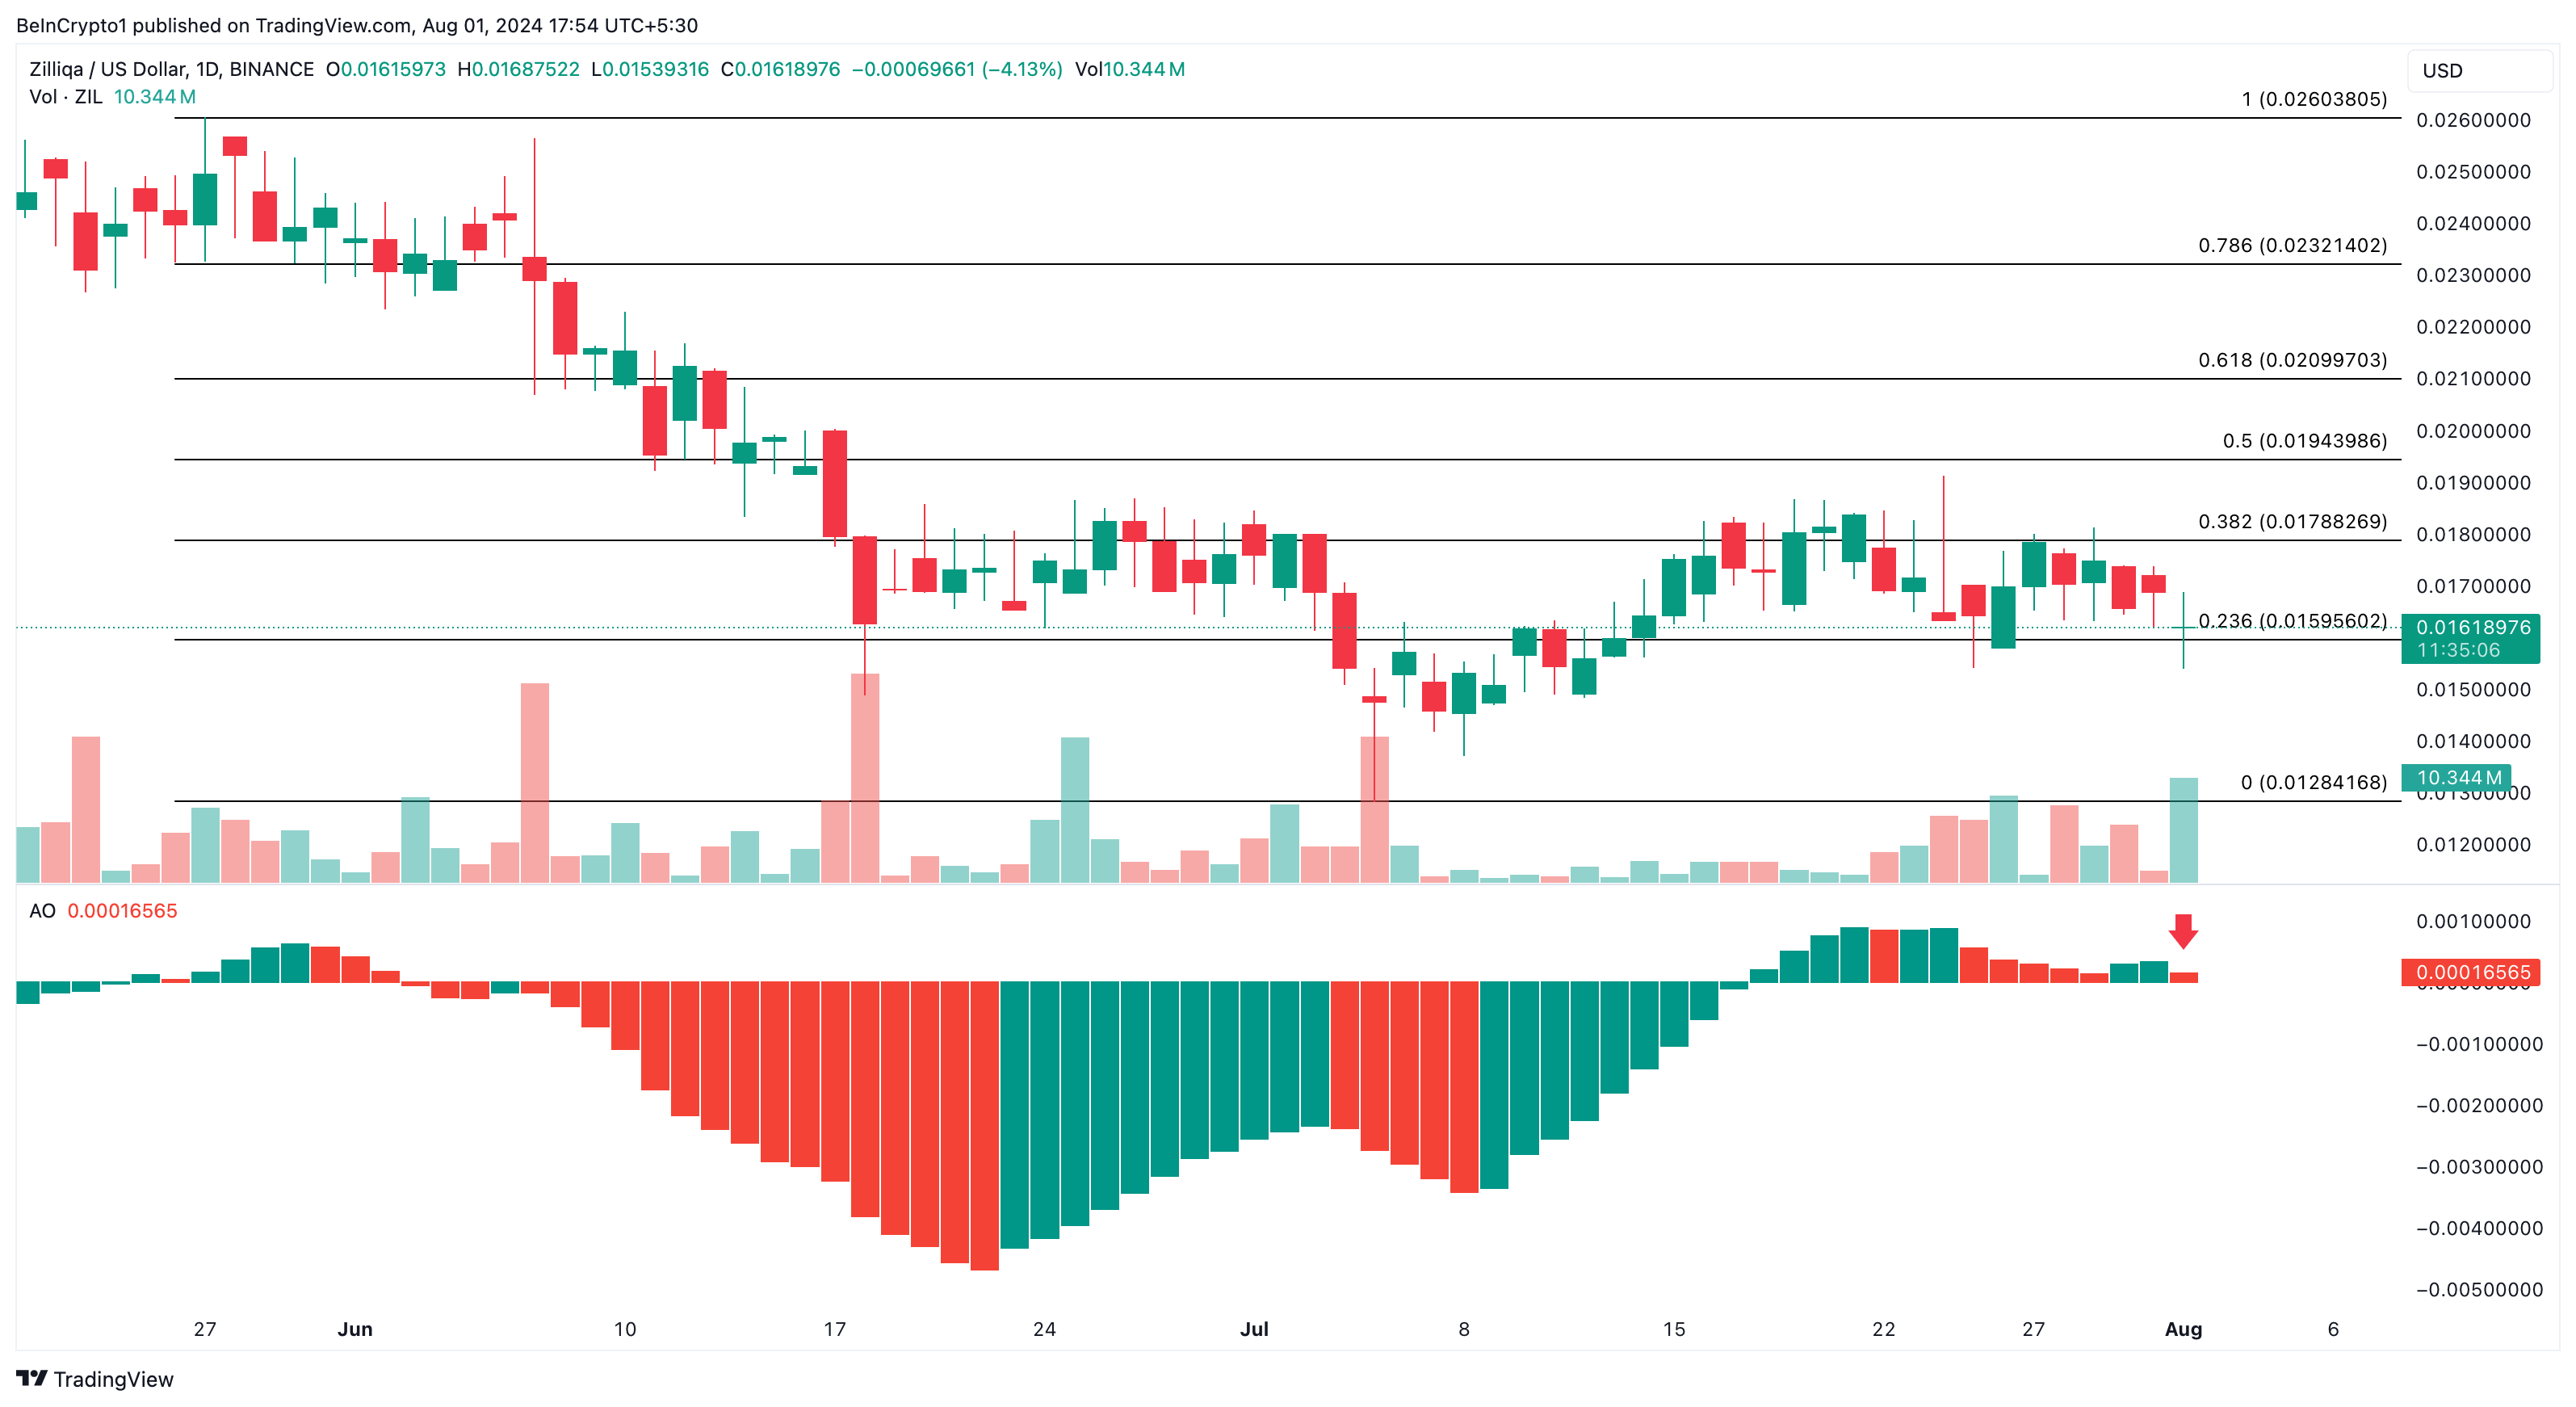 ZIL Daily Analysis. Source: TradingView
However, the token may evade reaching these targets if buying pressure increases. Should that be the case, ZIL’s price may drop to $0.17.
0
0


 Управляйте всей своей криптовалютой, NFT и DeFi из одного места
Безопасно подключите используемый вами портфель для начала.

0
0

0
0

