Daily Analysis: AVAX, ADA, JTO, QI, GFT

0
0

Markets are on bull activity today, with the global market cap sitting 0.91% above its previous 24-hour mark, as the total cap stands at $1.61T as of press time. The fear and greed index is 81, as greed now dominates. The global trading volume is 11% down in 24 hours, at $75.2B as of press time.
Avalanche Price Analysis
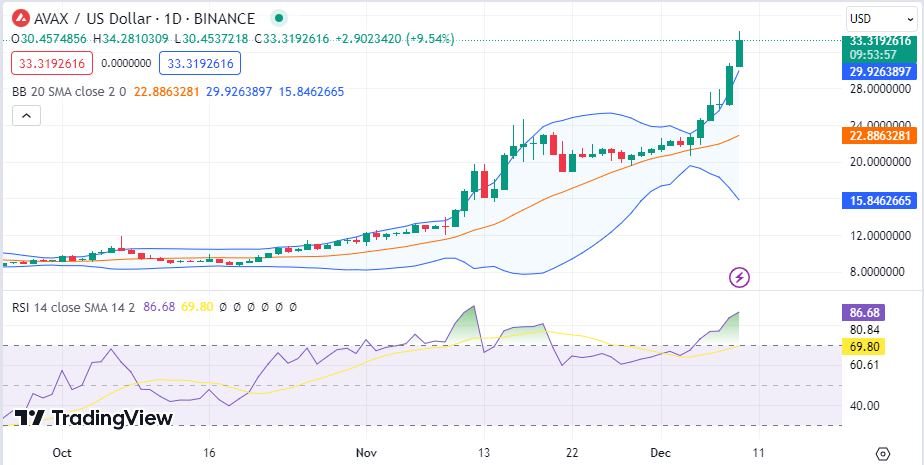
Avalance (AVAX) is riding on bull activity, as the Avalanche price stood at $33.2 as of press time after recording a daily increase of 21% and a weekly rise of 50%. As a result of the Avalanche price, the token’s trade volume dropped by 130% during the same period and is presently at $1.9B.
The Bollinger bands are diverging, showing high volatility levels on the Avalanche price. The Relative Strength Index (RSI) is above the average line in the overbought region, showing bull activity on the Avalanche price.
Cardano Price Analysis
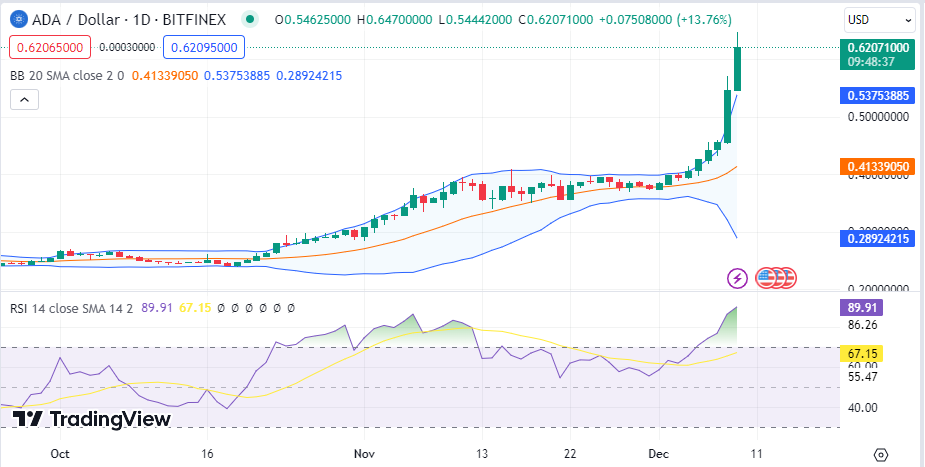
Cardano (ADA) is still riding on bull activity, as the Cardano price stood at $0.6224 as of press time after recording a daily increase of 19% and a weekly rise of 59%. As a result of the Cardano price, the token’s trade volume jumped by 164% during the same period and is presently at $2.7B.
The Bollinger bands are diverging, showing high volatility levels on the Cardano price. The Relative Strength Index (RSI) is above the average line, showing bull dominance on the Cardano price.
Jito Price Analysis
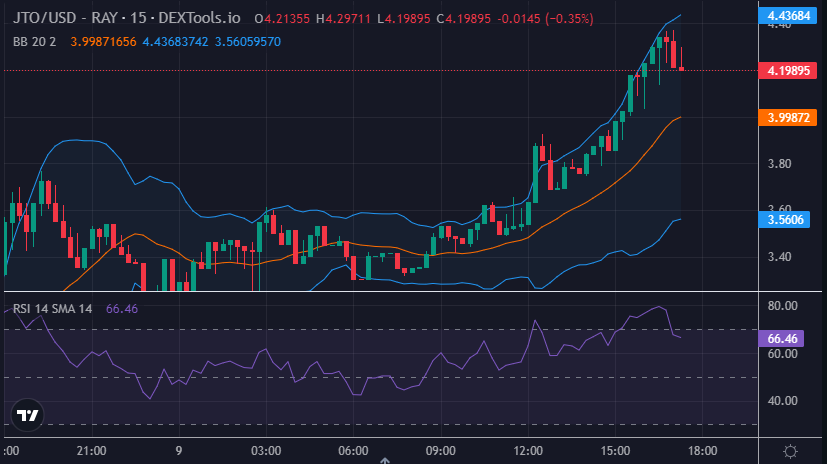
Jito (JTO) is still riding on bull activity, as the Jito price stood at $4.28 as of press time after recording a daily increase of 46.6% and a weekly rise of 157%. As a result of the Jito price, the token’s trade volume jumped by 46% during the same period and is presently at $1.3B.
LookiThe Bollinger bands are diverging, showing high volatility levels on the Jito price. The Relative Strength Index (RSI) is now on a downward trajectory as it exits te overbought region, showing bear activity on the Jito price.
BENQI Price Analysis
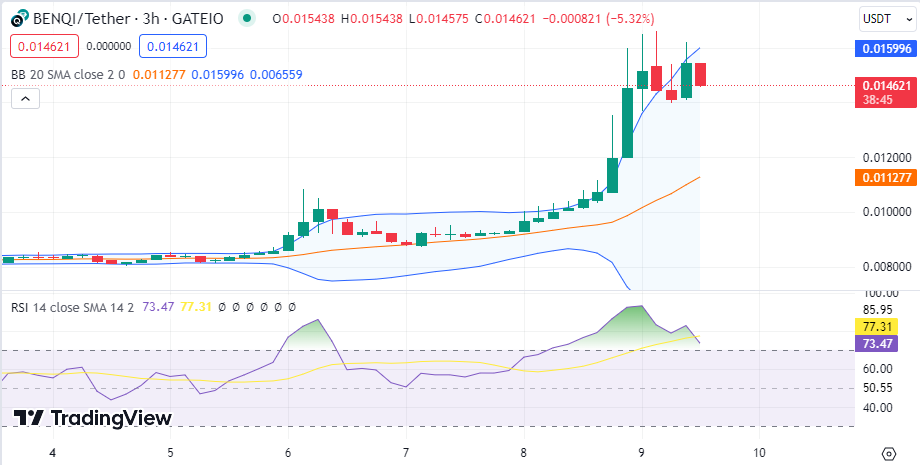
BENQI (QI) is also riding on bull activity, as the QI price stood at $0.0146 as of press time after recording a daily increase of 39% and a weekly rise of 78%. As a result of the BENQ price, the token’s trade volume jumped by 1040% during the same period and is presently at $83M
The Bollinger bands are diverging, showing high volatility levels on the BENQI price. Despite the rise, the Relative Strength Index (RSI) is below the average line, showing bear activity on the BENQI price.
Gifto Price Analysis
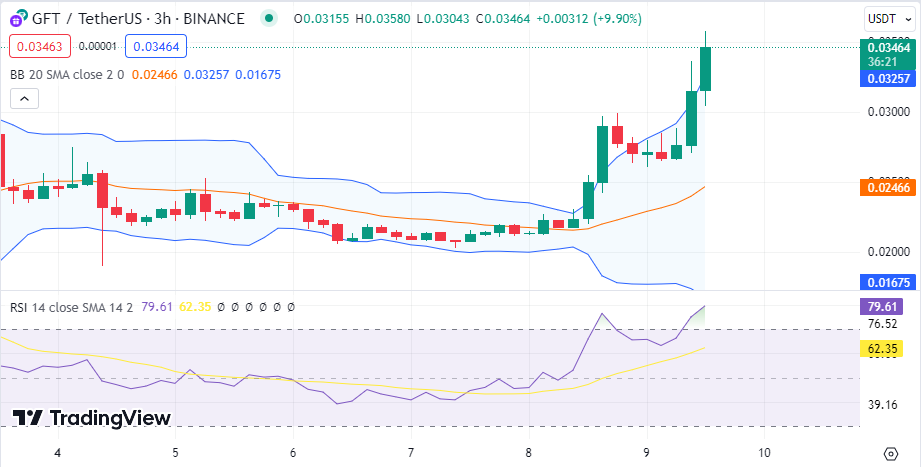
Gifto (GFT) is also riding on bull activity, as the Gifto price stood at $0.0346 as of press time after recording a daily decrease of 54% and a weekly rise of 46%. As a result of the Gifto price, the token’s trade volume jumped by 800% during the same period and is presently at $70.3M.
The Bollinger bands are diverging, showing high volatility levels on the Gifto price. The Relative Strength Index (RSI) is above the average line in the overbought region, showing bull dominance on the Gifto price.
0
0


 Administra todas tus criptomonedas, NFT y DeFi desde un solo lugar
Para comenzar, conecta de forma segura el portafolio que estés utilizando.