OXT Price Spikes 53% WTD, Analysts Predict Bull Run Will Continue

0
0

Key Takeaways:
- Orchid Protocol native token OXT confirmed a bullish technical pattern.
- OXT price rallied 53.3% WTD in the week beginning Sept. 11.
- OXT’s social media mentions spiked over the past seven days.
NEW DELHI (CoinChapter.com) — Orchid Protocol native token OXT price enjoyed a bullish rally in the week beginning Sept. 11, helping the token break out of a bullish technical pattern called the ‘Falling Wedge.’
The technical pattern forms when the price fluctuates inside a pair of falling trendlines that converge down the slope. The outcome of such downside patterns is typically a price breakout to the upside.
One key feature of the pattern is that volumes usually decline as the trendlines converge.
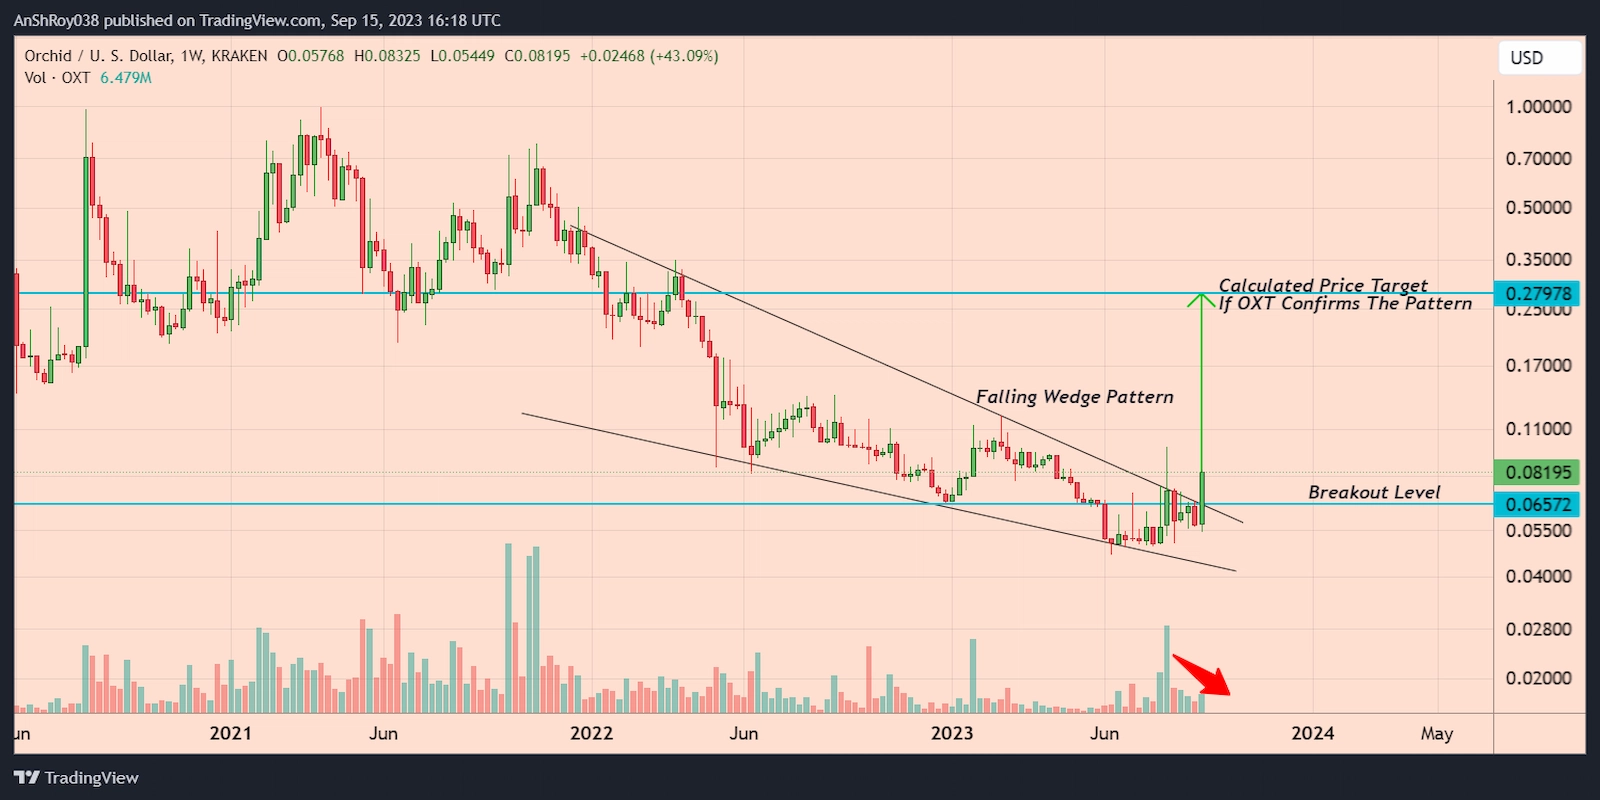
The upside target for the breakout is equal to the maximum distance between the falling wedge’s upper and lower trendlines. Hence, the pattern has set a theoretical price target of $0.28 for OXT, a spike of 326% from the pattern’s breakout level near $0.0657.
However, to confirm the breakout, OXT price would need to continue rallying to paint another green candle on the chart. If the rally fails, the crypto token’s price would risk re-entering the pattern, invalidating the recent breakout.
OXT Price Faces Overbought RSI Risks
The recent bull run helped OXT price rally over 53% since Sept. 11 to form a daily high near $0.0837 on Sept. 15. However, the rally also resulted in pushing OXT’s relative strength index into the overbought region.
Overbought RSI levels usually precede a bearish reversal for an asset. Hence, traders usually start booking profits as the RSI enter the overbought region, increasing the selling pressure.
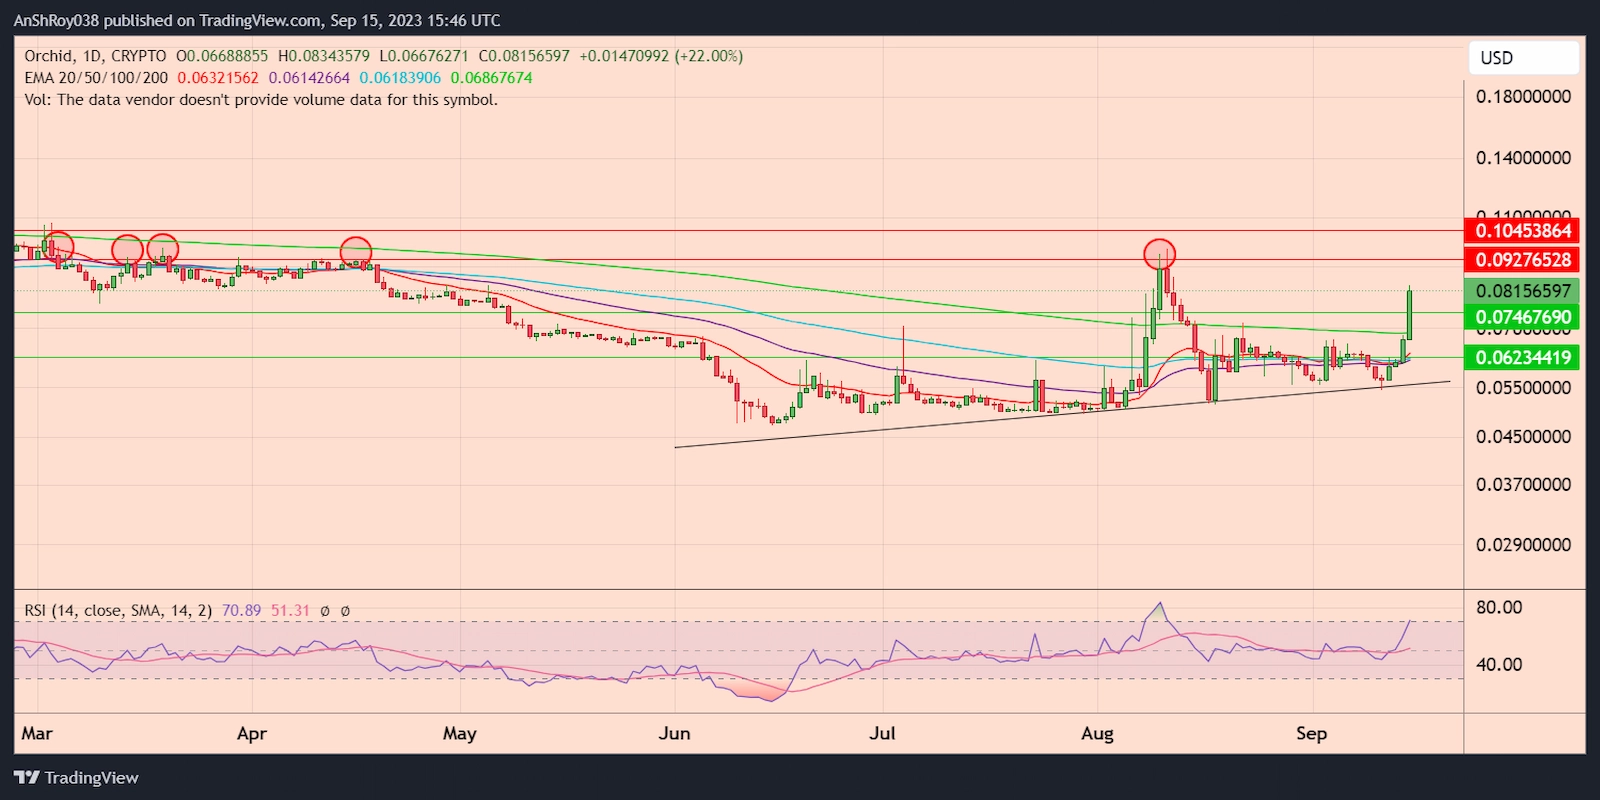
Should the rally stall, OXT price might drop to the support near $0.075. Failure of the immediate support level might force the Orchid Protocol token price to test the 100-day EMA (blue wave) and 50-day EMA (purple wave) support confluence near $0.0623.
However, if more buyers enter the market at this point, OXT price rally could continue to the resistance near $0.0927. OXT price has failed to flip its immediate resistance since March 2023 despite repeated attempts (red circles).
Breaking above the immediate resistance might help OXT price target the resistance near $0.1 before retreating.
Orchid Protocol’s Social Media Mentions Spike
Social media mentions for the OXT token spiked over the past seven days, per data from LunarCrush.
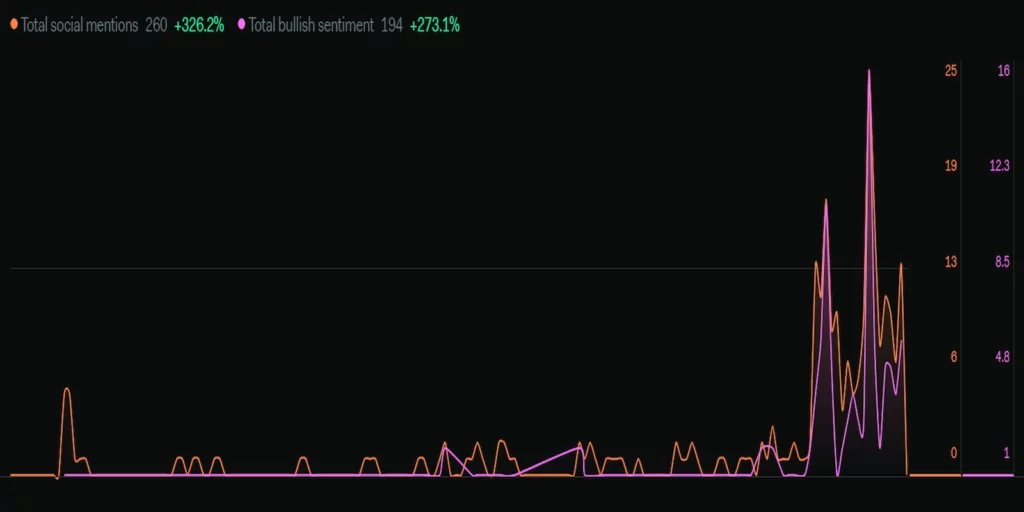
Furthermore, bullish sentiment for the token spiked during the same period. The spike in social media mentions was likely due to several analysts predicting a continued rally for the Orchid Protocol token.

A crypto analyst using the X handle World Of Charts speculated that OXT price could move towards $0.2 after confirming the bullish pattern.
Several crypto tokens rely on social media hype for bullish cues, which means the increased social media mentions could help the Orchid Protocol token price action.
The post OXT Price Spikes 53% WTD, Analysts Predict Bull Run Will Continue appeared first on CoinChapter.
0
0

 从同一位置管理所有加密资产、NFT 和 DeFi 资产
安全地关联您正在使用的投资组合,以开始交易。