
Recalibrate MVRV Now, Analysts: Why 3.5 Fails in the ETF Era

0
0


The MVRV ratio divides Bitcoin’s market cap by its realized cap, and the result tells you whether the average holder is sitting on a profit or a loss. A reading above 1.0 means the typical coin is worth more than the price it last moved at, which signals unrealized profit and, historically, growing sell pressure. Below 1.0, the average holder is underwater, a condition analysts often flag as a potential accumulation zone.
TL;DR:
- MVRV readings above 3.5 to 4.0 signal euphoria and high market top risk, but recent peaks near 2.5 suggest structural shifts reducing these signals.
- The MVRV Z-Score adjusts for market volatility, making it more reliable for comparing cycle extremes across different eras than raw MVRV.
- Short-term MVRV metrics focus on recent trader behavior, while long-term ones gauge holder conviction, and their differences can predict upcoming market shifts.
- Current MVRV above 1.0 indicates rising unrealized profits, while below 1.0 shows potential accumulation, but thresholds should be treated as flexible references.
- Live on-chain platforms like Glassnode and Santiment provide essential data for monitoring MVRV and its variants to inform timely trading decisions.
What Is MVRV and How Is It Calculated?
MVRV stands for market value to realized value. The formula is simple: MVRV = Market Cap ÷ Realized Cap. Market cap is the figure everyone already knows, current price multiplied by circulating supply. Realized cap is the more interesting number, and it’s what makes MVRV useful.

Realized cap values every coin in circulation at the price it last moved on-chain, rather than at today’s price. A coin that hasn’t changed wallets since it traded at $8,000 still counts as $8,000 in the realized cap calculation, even if Bitcoin is trading at $95,000 today. Sum that across the entire supply, and you get an aggregate cost basis for the network.
That distinction matters because market cap treats every coin as if it were bought today, while realized cap acts as a proxy for the network’s actual cost basis. The gap between the two is where MVRV lives.
- Market cap: price × circulating supply
- Realized cap: sum of (each coin’s value at its last on-chain transaction)
- MVRV: the ratio between them, expressed as a single number
A market cap roughly double the realized cap produces an MVRV of 2.0, meaning the average holder is sitting on an unrealized gain approximately equal to the initial investment.
What Do the Common MVRV Bands Mean?
MVRV readings cluster into bands that describe how much unrealized profit the market is carrying, and each band carries a distinct behavioral signal. You get the average holder’s unrealized profit percentage just by subtracting 1 from the ratio. An MVRV of 2.5 means the average coin holder is up 150% from their cost basis.
- Above 3.5 to 4.0 — Historically associated with euphoria and elevated market top risk, as large unrealized gains create strong incentive to sell.
- 2.0 to 3.0 — An extended, profit-heavy zone where bullish momentum is intact but profit-taking tends to accelerate.
- 1.0 to 2.0 — Modest profit territory, often seen during steady accumulation or early-to-mid bull phases.
- Below 1.0 — The average holder is underwater, a condition that has historically coincided with market bottoms and renewed accumulation.
These bands come from historical price behavior, not fixed physical law. Glassnode’s own documentation frames the thresholds as empirical patterns, tied to market structure at the time they were observed. As Bitcoin’s holder base and capital flows shift, particularly with institutional participation, those thresholds can compress or stretch. Treat them as a reference frame, not a trading trigger on their own.
How Does the MVRV Z-Score Normalize Extremes?
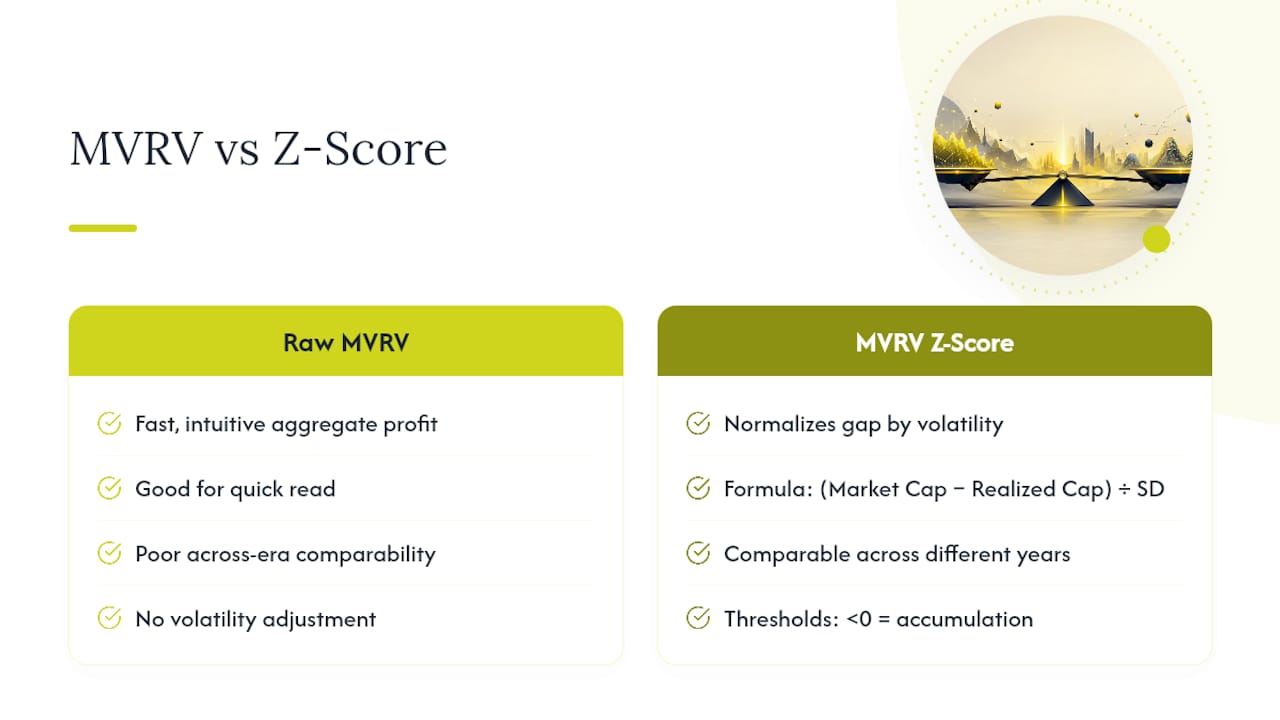
Raw MVRV works fine for a quick read, but it struggles to compare eras fairly. Bitcoin’s market cap has grown by orders of magnitude since 2013, and market-wide unrealized profit can swing more sharply in dollar terms even at a similar ratio. The MVRV Z-Score fixes that by adjusting for volatility.
The formula is:
Z-Score = (Market Cap − Realized Cap) ÷ Standard Deviation of Market Cap
Instead of just looking at the ratio between the two values, the Z-Score measures how many standard deviations the gap between market cap and realized cap sits from its historical norm. That normalization is why the Z-Score, not raw MVRV, tends to be the go-to metric for comparing cycle tops and bottoms across different years.
Typical MVRV Z-Score thresholds classify values above about 7 as euphoria, values between approximately 2 and 4 as extended but not extreme, and readings below 0 as associated with accumulation zones. When you need to judge “how extreme is this, relative to Bitcoin’s entire history,” reach for the Z-Score. When you want a fast, intuitive read on aggregate profit right now, raw MVRV does the job.
What Do Time-Bound MVRV Variants Show?
Standard MVRV includes every coin ever mined, even Bitcoin that hasn’t moved in a decade. Time-bound variants, like a 30-day or 365-day MVRV, restrict the calculation to coins that actually moved within that window. That filter isolates active supply and strips out the noise from dormant holders who aren’t going to sell regardless of price.
Santiment’s methodology documents these timebound metrics specifically to help distinguish short-term trader behavior from long-term holder conviction.
- Short-term MVRV (7d to 30d): flags whether recent buyers are sitting on quick gains or losses, useful for spotting short-term distribution.
- Long-term MVRV (365d+): reflects the resilience of holders who bought over the past year, a better gauge of underlying conviction.
- MVRV difference metrics: comparing short-term and long-term readings side by side can reveal when new entrants are taking profit while long-term holders stay put, a pattern that often precedes choppy, range-bound price action rather than a clean trend continuation.
How Should Analysts Actually Use MVRV?
MVRV works best as one input in a broader framework, never as a standalone trigger. Glassnode’s research explicitly frames it as a mean-reversion model best paired with a momentum indicator like the 1-year simple moving average. When MVRV is elevated and price is still above its 1-year SMA, momentum and valuation are agreeing, which is a different setup than an elevated MVRV paired with a price already rolling over.
MVRV also tends to flag regime extremes weeks or months before the actual price peak or trough, so treat it as an early warning system rather than a precise entry or exit signal.
A few limitations deserve real weight. MVRV doesn’t distinguish permanently lost coins from active supply, which biases the realized cap downward and the ratio upward. Some analysts correct for this using an adjusted realized cap that excludes coins dormant for extremely long periods, such as those untouched for more than seven years. Supply concentration among a small number of large wallets, and newer flows from spot ETFs, can also distort how the classic bands behave.
A practical checklist for building alerts around MVRV:
- It is recommended to consider alerts when raw MVRV crosses into ranges roughly above 3.0 or below 1.0, where historical market behavior tends to shift.
- Cross-check any alert against the 1-year SMA before treating it as a signal, not just a data point.
- Watch the short-term versus long-term MVRV difference for early signs of distribution.
- Never act on MVRV alone, confirm with volume, funding rates, or exchange flow data.
Pro Tip: Set your alert thresholds as a range around the canonical bands, not a single trigger price. Markets rarely respect a line to the decimal, and a range gives you time to check confirming indicators before you act.
Why Are 2025’s MVRV Readings Confusing Analysts?
Bitcoin’s rally into October 2025 should have pushed MVRV into classic euphoria territory if history repeated itself cleanly. It didn’t. The peak MVRV reading came in near 2.524, well below the 3.5 to 4.0 zone that marked prior cycle tops, and the corresponding Z-Score reading was similarly muted.
The gap between the 2025 peak and prior cycle extremes suggests something structural changed in how profit accumulates across the holder base, not just a smaller rally. Bit.com’s analysis points to spot ETF flows and programmatic institutional demand as the likely compressing force, since large, steady inflows behave differently than the retail-driven speculative waves that shaped earlier cycles.
Nobody has a settled answer yet on how permanent this shift is. What it means practically: fixed absolute thresholds, the “MVRV above 3.5 signals the top” style of rule, deserve more skepticism than they did a few cycles ago. A percentile-based or Z-score-relative approach, measured against Bitcoin’s own recent history rather than a static number, holds up better in an environment where ETF-era capital flows are reshaping baseline behavior.
Where Can You Track Live MVRV Data?
On-chain analytics platforms remain the most reliable source for real-time MVRV readings, since the calculation requires full historical transaction data to reconstruct realized cap accurately. Glassnode and Santiment both publish live charts, historical data, and API access built specifically for this kind of on-chain analysis, and each documents its methodology openly rather than treating the calculation as a black box.
For monitoring, enable overlays for raw MVRV, the Z-Score, the 1-year SMA, and at least one time-bound variant on the same chart. That combination lets you see divergence the moment it appears, rather than after the fact.
- Set band-breach alerts on both the 1.0 and 3.0 to 3.5 zones.
- Track the gap between short-term and long-term MVRV weekly, not just during obvious volatility.
- If you’re building automated signals, consider API polling on platforms like Bit.com’s data tools for consistent, programmatic access rather than manual chart checks.
The Bottom Line on Reading MVRV Today
MVRV above 1.0 signals average unrealized profit and rising sell incentive; below 1.0 signals average unrealized loss and potential accumulation. Monitor both raw MVRV and its Z-Score, confirm any signal with momentum data, and never execute a trade on MVRV alone.
For continuing coverage of how on-chain indicators are shaping Bitcoin’s current cycle, TechGaged’s ongoing market analysis tracks these shifts as they develop, alongside broader reporting at Techgaged.
Sources
- MVRV Ratio — Glassnode docs
- Mastering the MVRV Ratio — Glassnode Research
- MVRV — Santiment Academy
- Bit
FAQ
What Are the Typical MVRV Bands for Bitcoin?
Readings above 3.5 to 4.0 signal euphoria and elevated top risk, 2.0 to 3.0 marks an extended profit zone, 1.0 to 2.0 reflects modest profit, and below 1.0 indicates the average holder is underwater, a level historically tied to market bottoms.
What Is the MVRV Z-Score and How Is It Different From Raw MVRV?
The Z-Score normalizes the gap between market cap and realized cap by market cap’s standard deviation, making it better for comparing extremes across different eras, while raw MVRV gives a faster, unadjusted read on current aggregate profit.
What Does the NVT Ratio of Bitcoin Indicate?
The NVT ratio compares network value to on-chain transaction volume, functioning similarly to a price-to-earnings ratio by flagging when valuation is outpacing actual network usage.
What Is the Stock-to-Flow Ratio of Bitcoin?
Stock-to-flow measures existing supply against new production, used by some analysts as a scarcity-based valuation model, though it’s a separate framework from MVRV and doesn’t account for demand-side or holder-behavior signals the way MVRV does.
Why Did MVRV Behave Differently During the October 2025 Bitcoin Peak?
The October 2025 peak printed an MVRV near 2.524, well below prior cycle tops, likely because spot ETF and programmatic institutional demand compressed the historical extremes that shaped earlier cycle thresholds.
Recommended
- Wall Street Wants More From Ethereum — Fidelity’s Latest ETF Move Says It All
- Bitcoin ETFs now hold more assets than gold ETFs, data shows
- Experts say Bitcoin’s price recovery may be far away based on this important metric
- Bitcoin Derivatives Are Going Quiet — Is The Market Preparing For A Breakout?
The post Recalibrate MVRV Now, Analysts: Why 3.5 Fails in the ETF Era appeared first on TechGaged.com.
0
0


 Gestisci cripto, NFT e DeFi in un unico luogo
Connetti in sicurezza il portafoglio che usi per iniziare.


