Price Predictions 2/18: BTC, ETH, XRP, BNB, SOL, DOGE, BCH

0
0

XRP has been quite volatile since the week began, but has failed to register any significant improvement. A look at the 1-week chart shows more downside, but it is trading slightly above its opening price.
XRP is off to a good start on Wednesday, printing a green candle on the 1-day scale. It remains to be seen how the rest of the session will play out. However, its green start may indicate further uptick.
Aside from the altcoin, the global cryptocurrency market cap is slightly higher than it was at the start of the day. Indicators on the 4-hour chart suggest more increases ahead, with MACD displaying a bullish convergence.
The crypto market may be priming for further increases in the coming days. However, a previous analysis noted a trend over the last three weeks that may currently be at play. It identified the pattern of a rocky start to the week, translating to a notable decline over the next three days.
The market posted slight losses on Tuesday but is up slightly on Wednesday. The upward momentum may wane in the coming hours if the dominant trend repeats.
Regarding fundamentals, there are no strong releases for the third day of the current week. Let’s see how some assets will perform in the coming hours.
BTC/USD
Bitcoin retraced to its lowest value in the last four days on Tuesday. It dropped below $67k and ended the session down 2%.
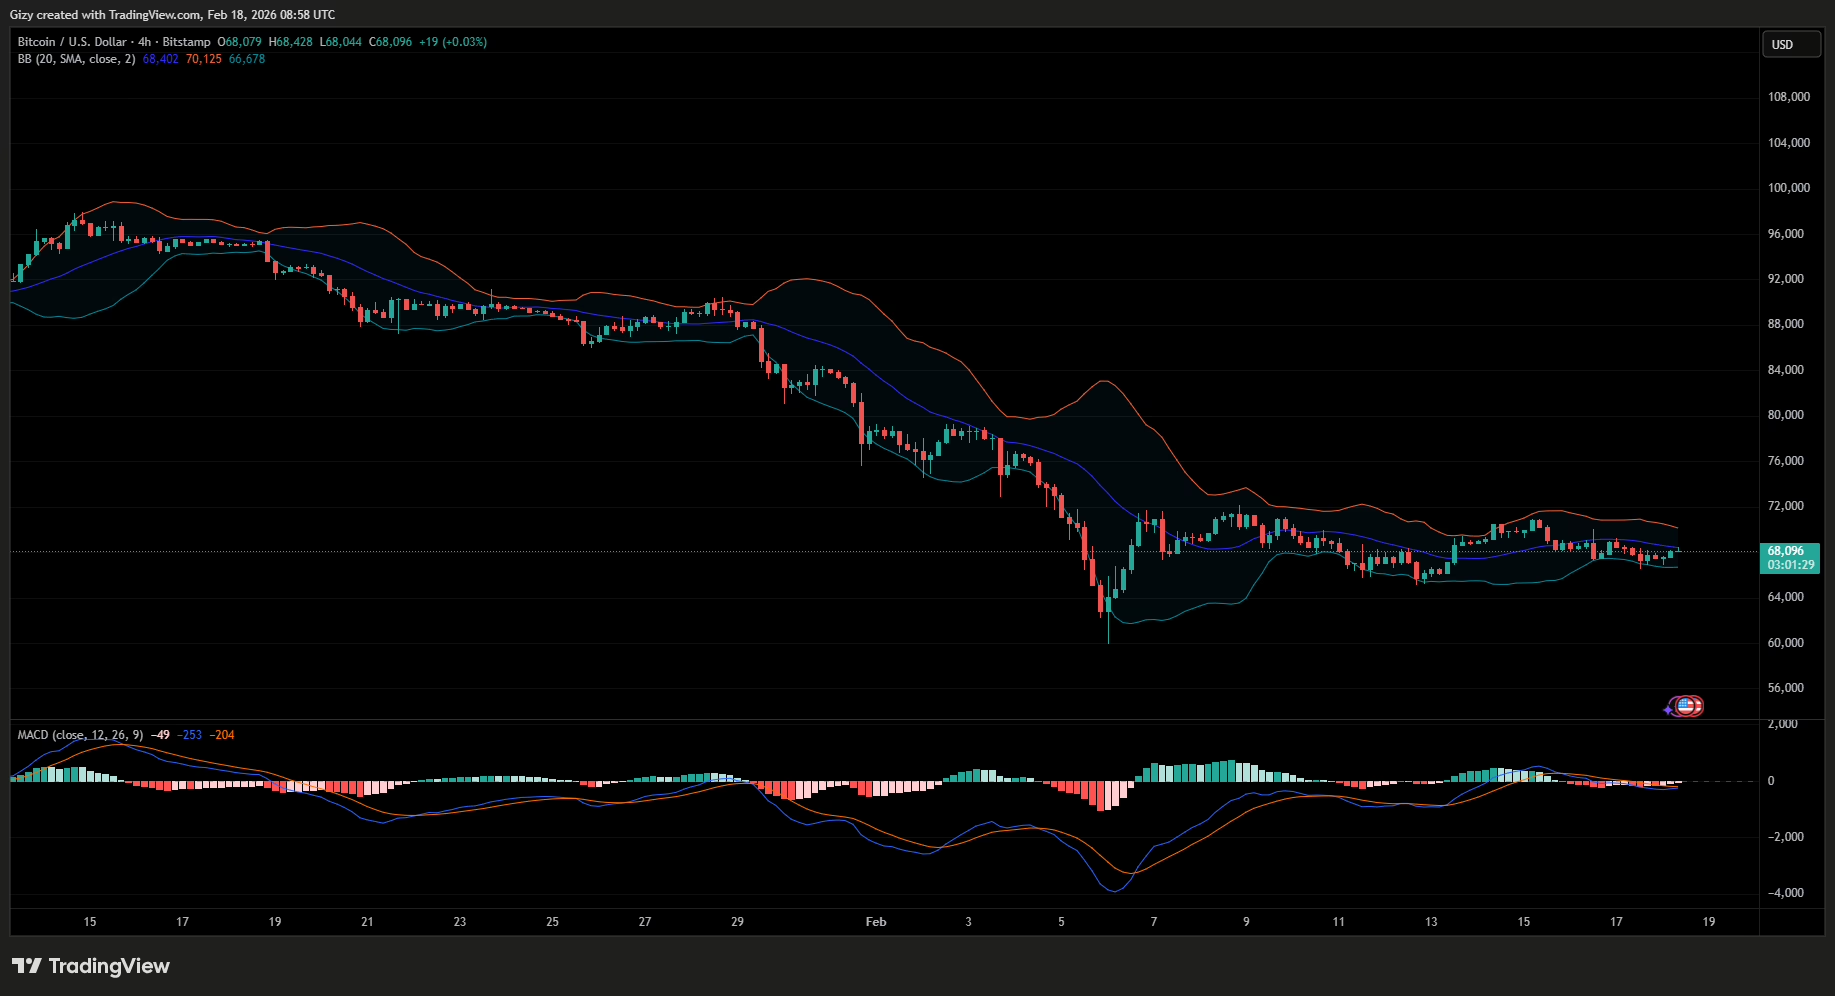
It’s off to a good start on Wednesday, reclaiming $68k a few hours ago. However, the current candle on the 4-hour chart suggests the upward momentum may be waning. If current selling pressure worsens, the apex coin will retrace further, potentially dropping to $65k.
Nonetheless, indicators hint at further increases. For example, the moving average convergence divergence prints shorter bars as the 12- and 26-EMA lines converge. A bullish crossover is imminent, which may signal more price hikes.
Aside from MACD, BTC recently bounced off bollinger’s lower band. Its recent attempt to break the SMA failed, resulting in the ongoing correction. Previous price movements do not indicate the next price direction; in some instances, prices retrace even lower after such a failed attempt.
In other cases, it decisively flips the middle band. If that happens this time, the apex coin retest $70k in the coming hours.
ETH/USD
Ethereum ended the previous intraday session with a doji following a slight decline. A closer look at the 1-day chart shows that it retested a level it has held since Friday.
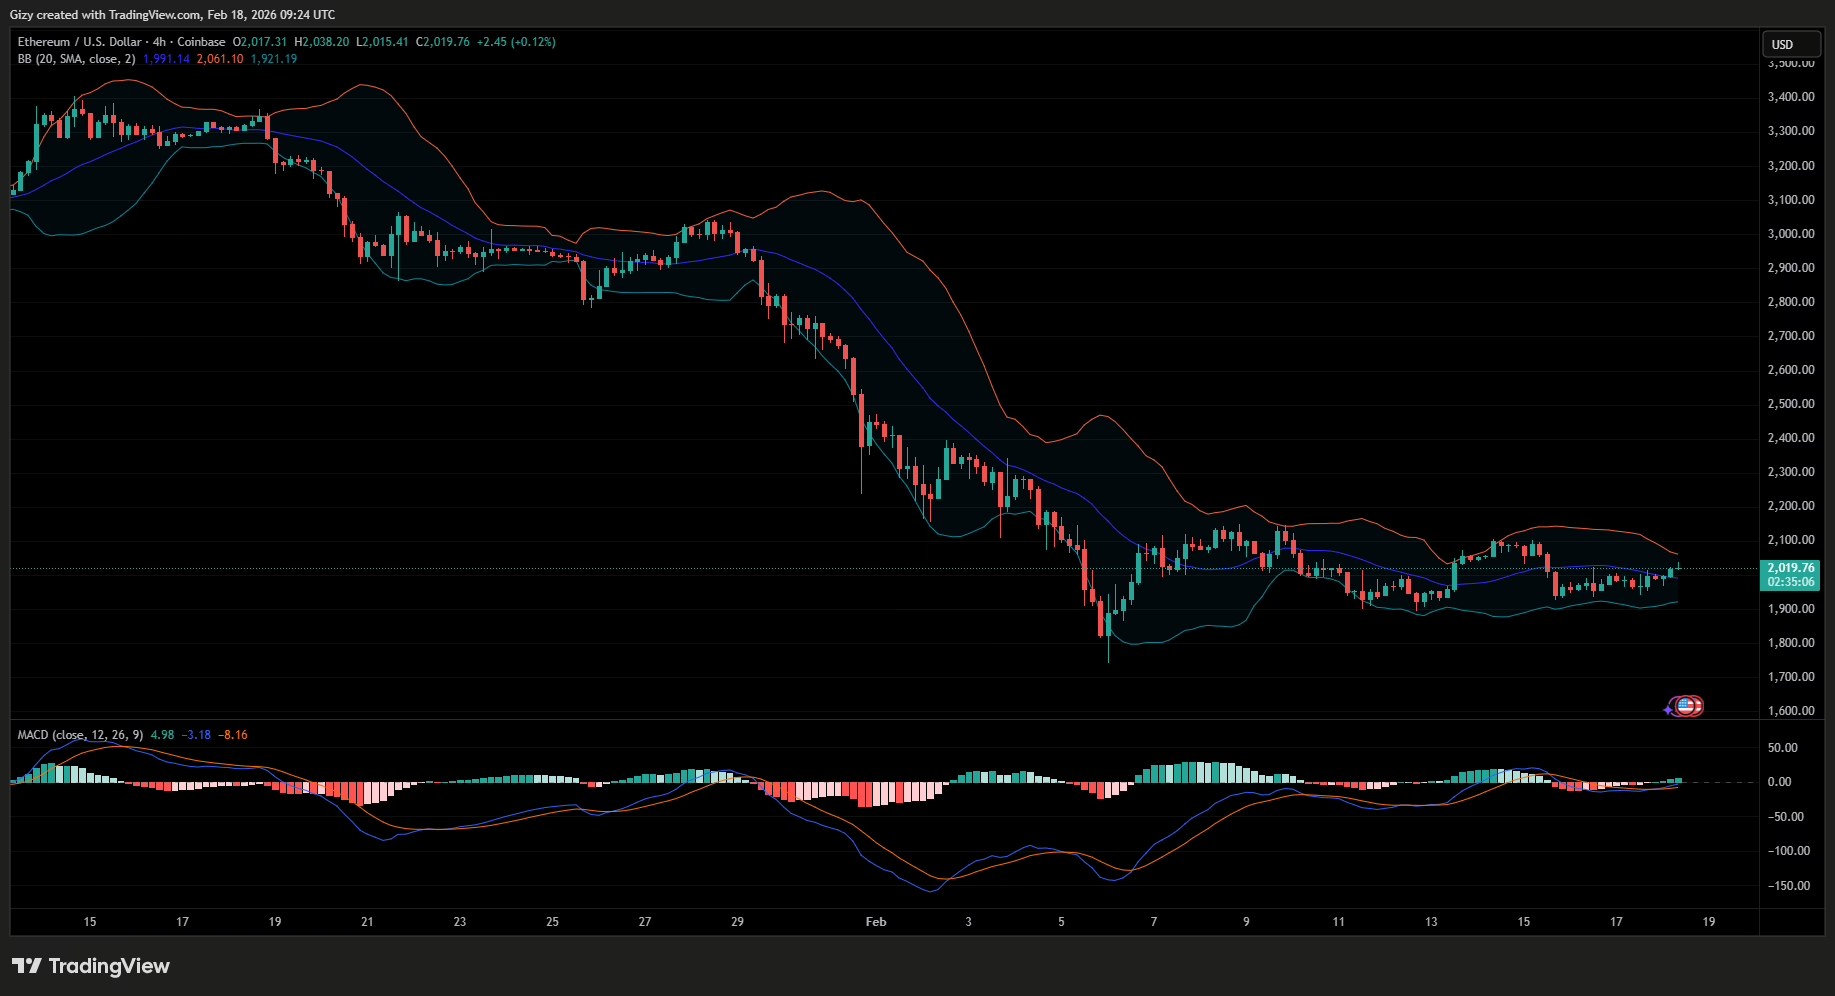
Nonetheless, the new candle suggests further upside in the coming days. ETH reached a new weekly high a few hours ago, peaking at $2,038. Although it is grappling with slight corrections at the time of writing, it trades above Monday’s peak.
The 4-hour chart also indicates a higher chance that the uptrend will continue—the bollinger bands on the scale show prices above the middle band. In most instances, the next target after flipping the SMA is the upper band. This means an attempt at $2,100 is likely.
Additionally, MACD also had a bullish crossover a few hours ago, increasing the likelihood of further uptick.
XRP/USD
XRP experienced a spike in buying pressure in the early hours of Wednesday, retesting the previous day’s high but failing to break it.
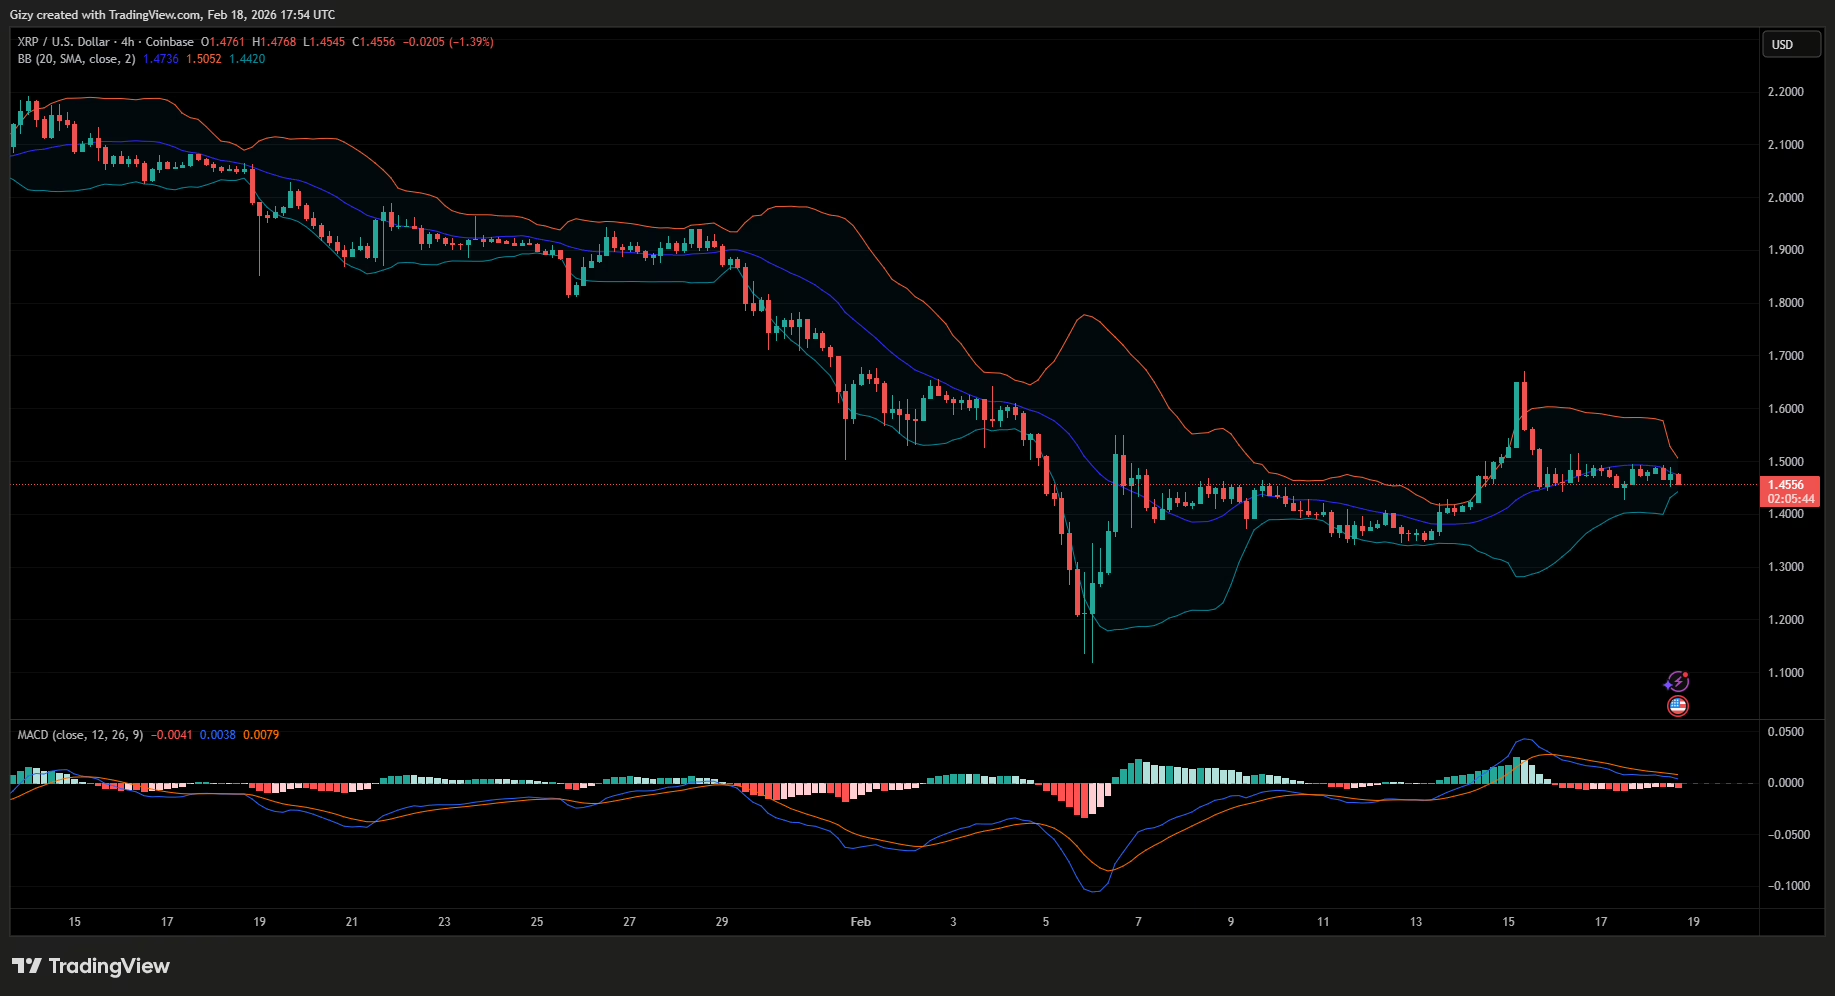
However, it has lost momentum and is currently in decline. The 4-hour chart shows that the moving average convergence divergence halted its impending bullish crossover in response.
While MACD continues its decline, the bollinger bands are contracting, suggesting that a breakout is imminent. The indicator points to an impending surge as XRP is currently trading close to the lower band. It may be gearing up to reclaim $1.55 in the coming days.
BNB/USD
The 4-hour chart shows that BNB has been range-bound since Sunday. To the top lies the $630 barrier, and below lies $605. It bounced between these two levels and is yet to break out.
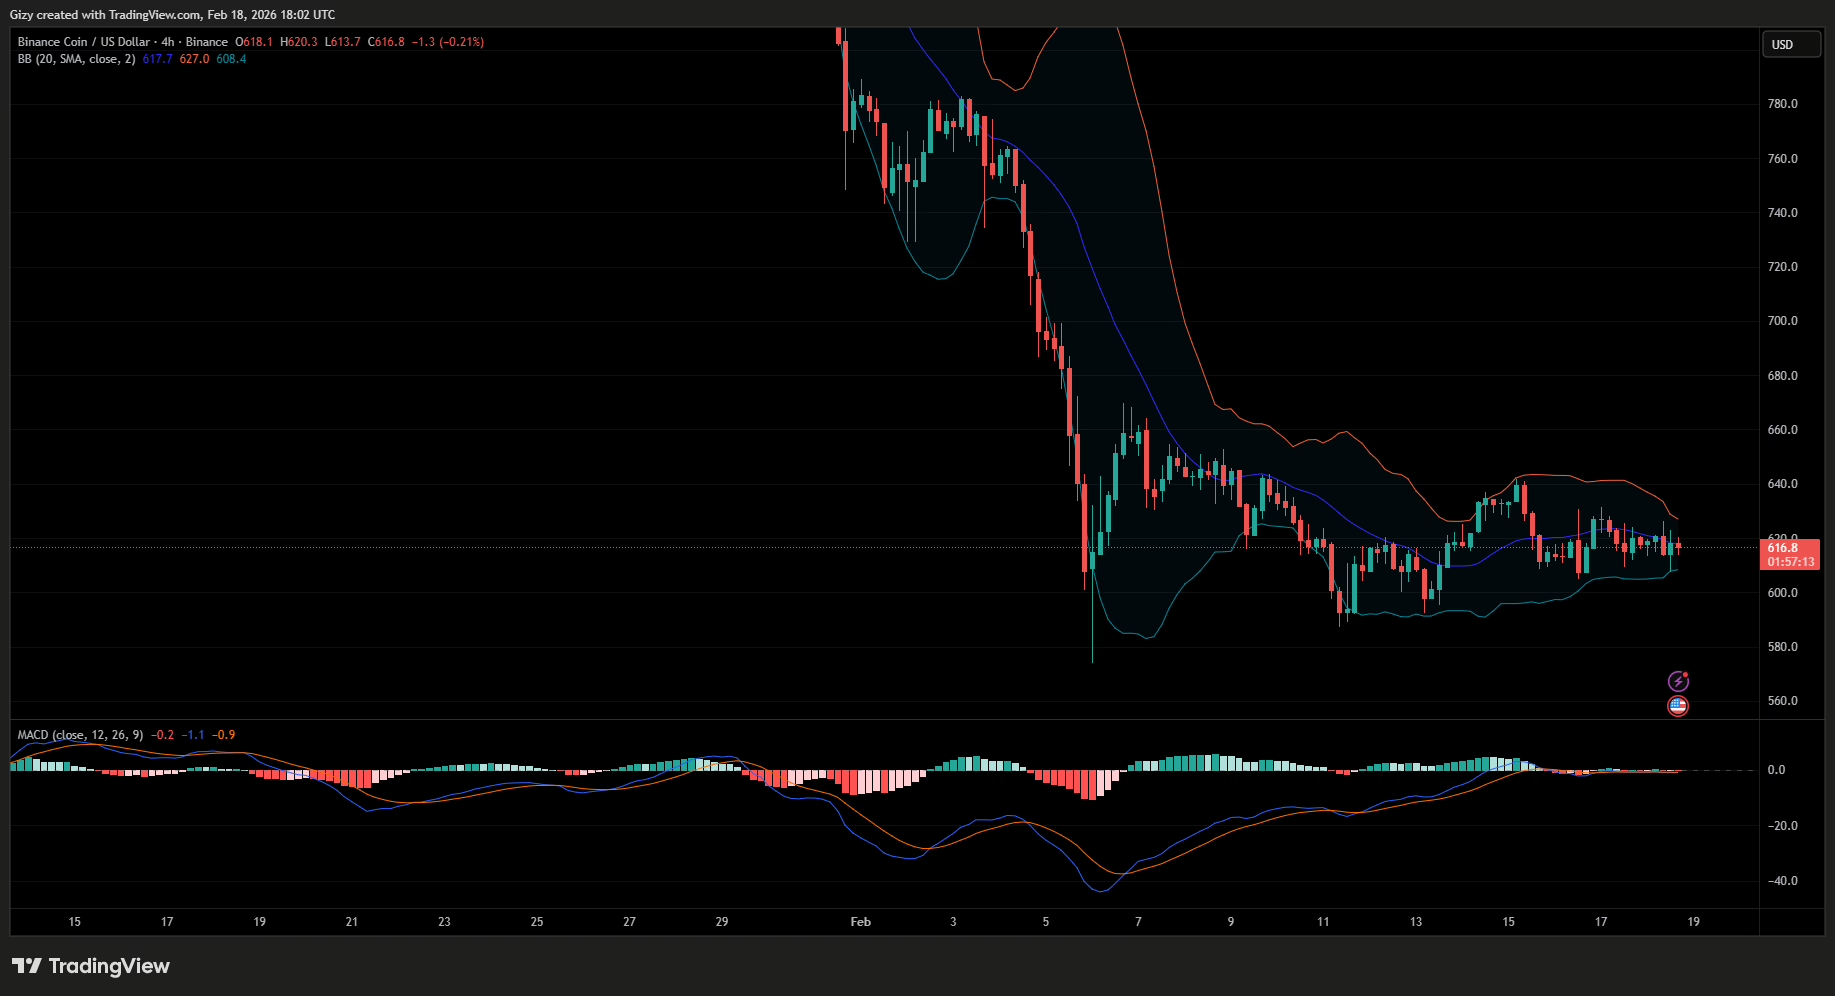
Nonetheless, the bollinger bands suggest that a breakout is imminent as the lower and upper bands are closing in. In response to the ranging, MACD has also failed to print any definitive signals. With both indicators pointing to an impending change to the current trend, it remains to be seen in what direction it will go.
A slip downward will result in the dropping below $590, and a surge above the current high will see BNB retest $650.
SOL/USD
Solana is currently grappling with notable selling pressure at the time of writing, trading almost $3 below its opening price. The 4-hour chart shows that most of the losses occurred in the session starting at 8:00 UTC.
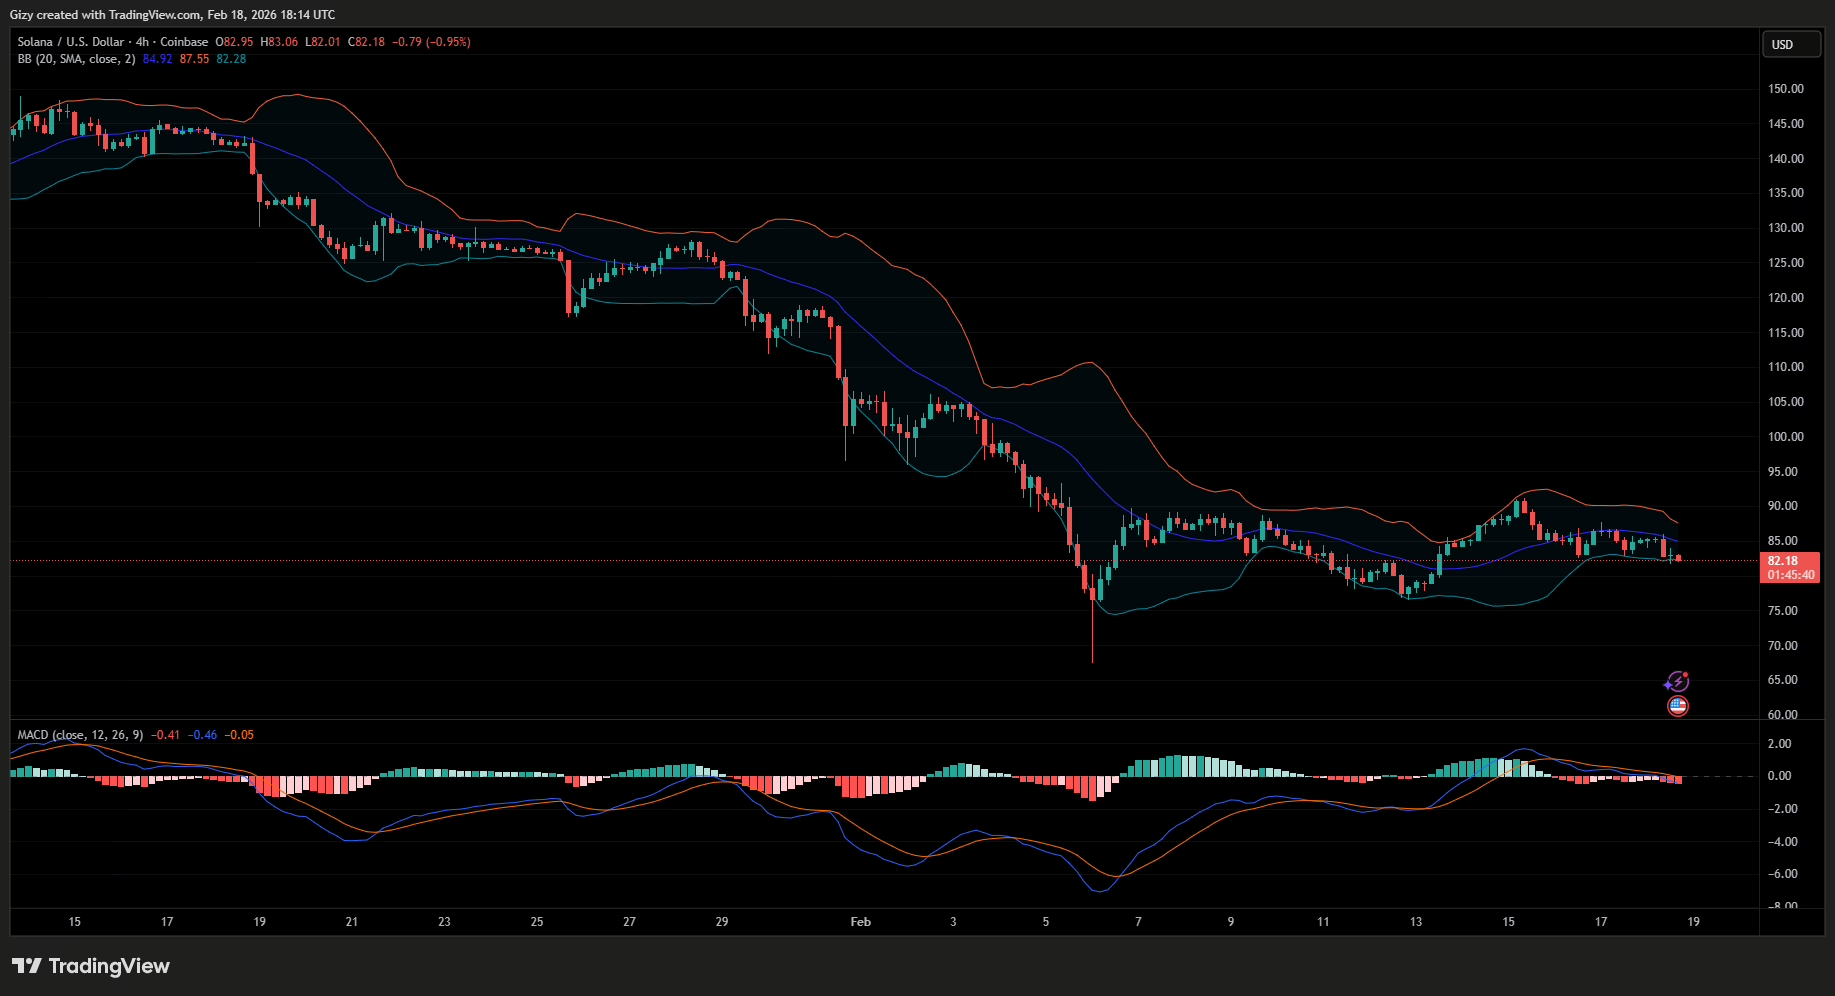
The asset has since failed to rebound, and its current candle is red, indicating that the decline is ongoing. However, it’s trading close to bollinger’s lower band, suggesting that a rebound is imminent.
Nonetheless, MACD puts a dent in claims of an impending rebound. It prints sell signals at the time of writing, hinting at a possible decline. SOL risks slipping below $80 if current trading conditions persist.
DOGE/USD
DOGE declined sharply on Sunday, shedding almost 8%. Since that volatile move, it has seen reduced trading volume, with the 1-day chart indicating ranging since Monday.
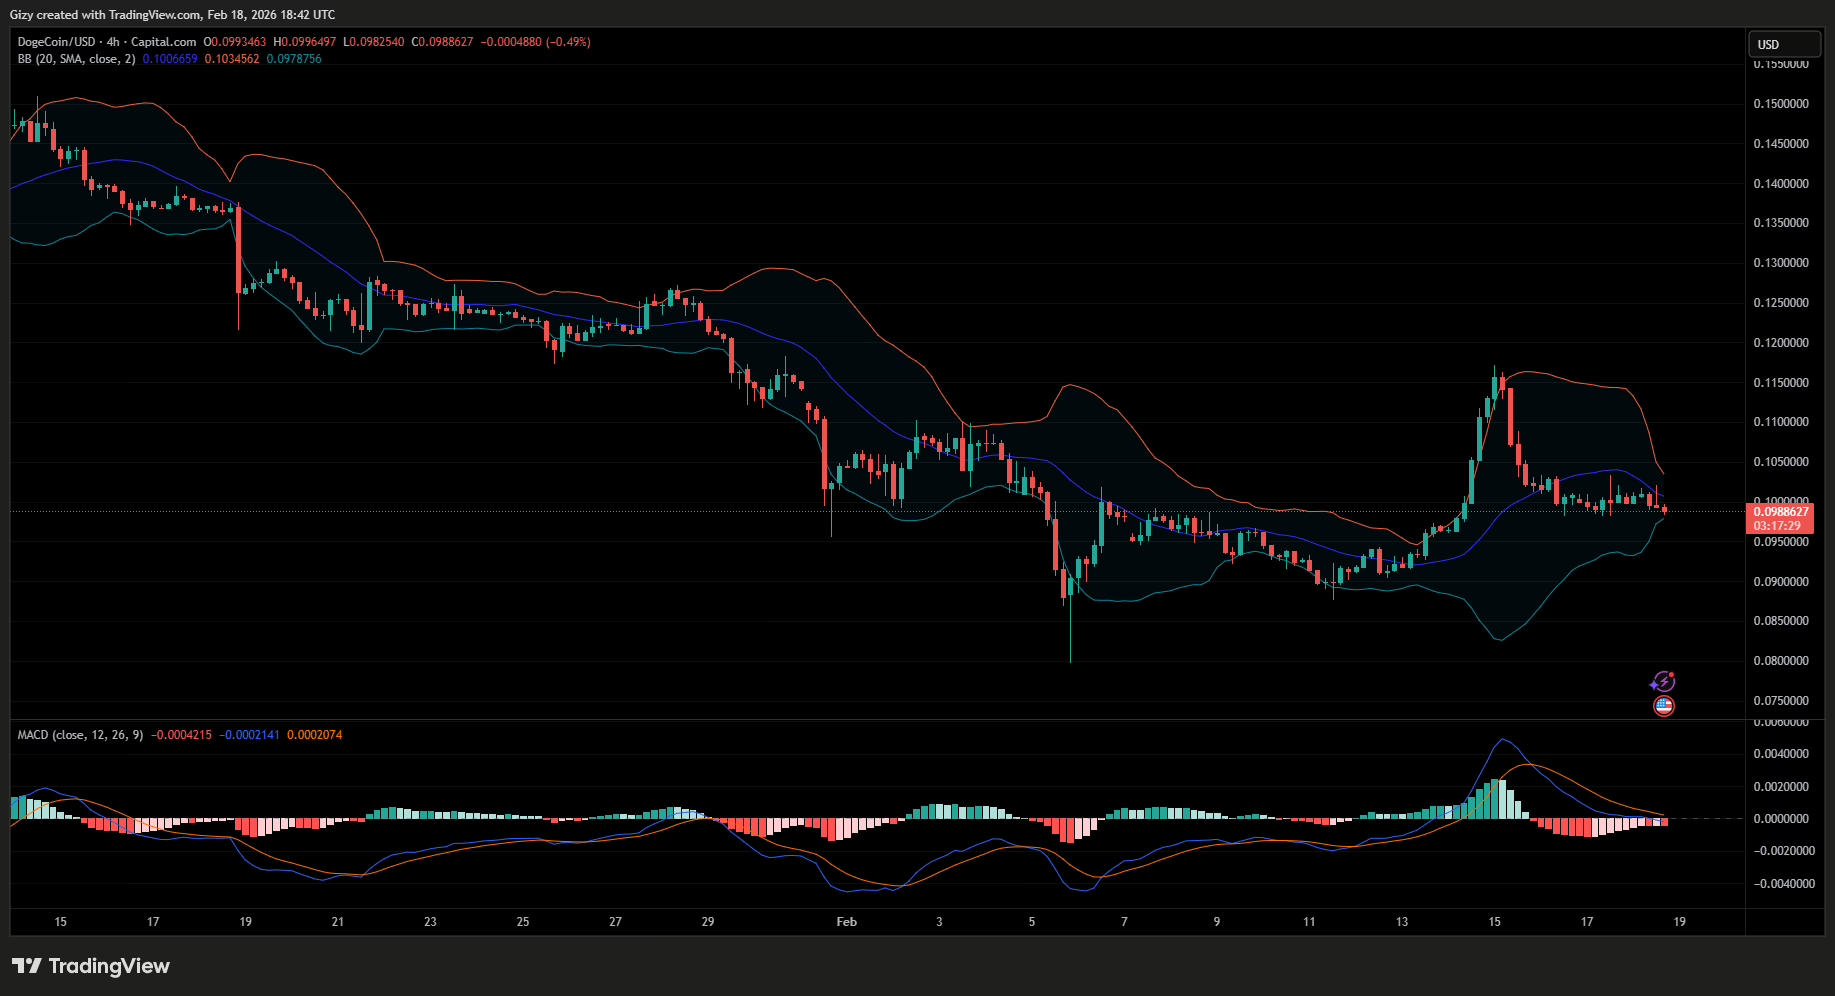
The same trend is evident on the 4-hour chart, with the asset struggling to surge. Nonetheless, the situation is worse as Dogecoin is trading at its four-day low. A close look at the chart shows it has rebounded to this level and may do so again.
Additionally, it’s trading at bollinger’s lower band, increasing the likelihood of a rebound. Conversely, if rebound fails at this level, DOGE may retest $0.90.
BCH/USD
Like XRP, BCH experienced a slight uptick in the early hours of Wednesday. However, the upward momentum waned, and it trades slightly below its opening price.
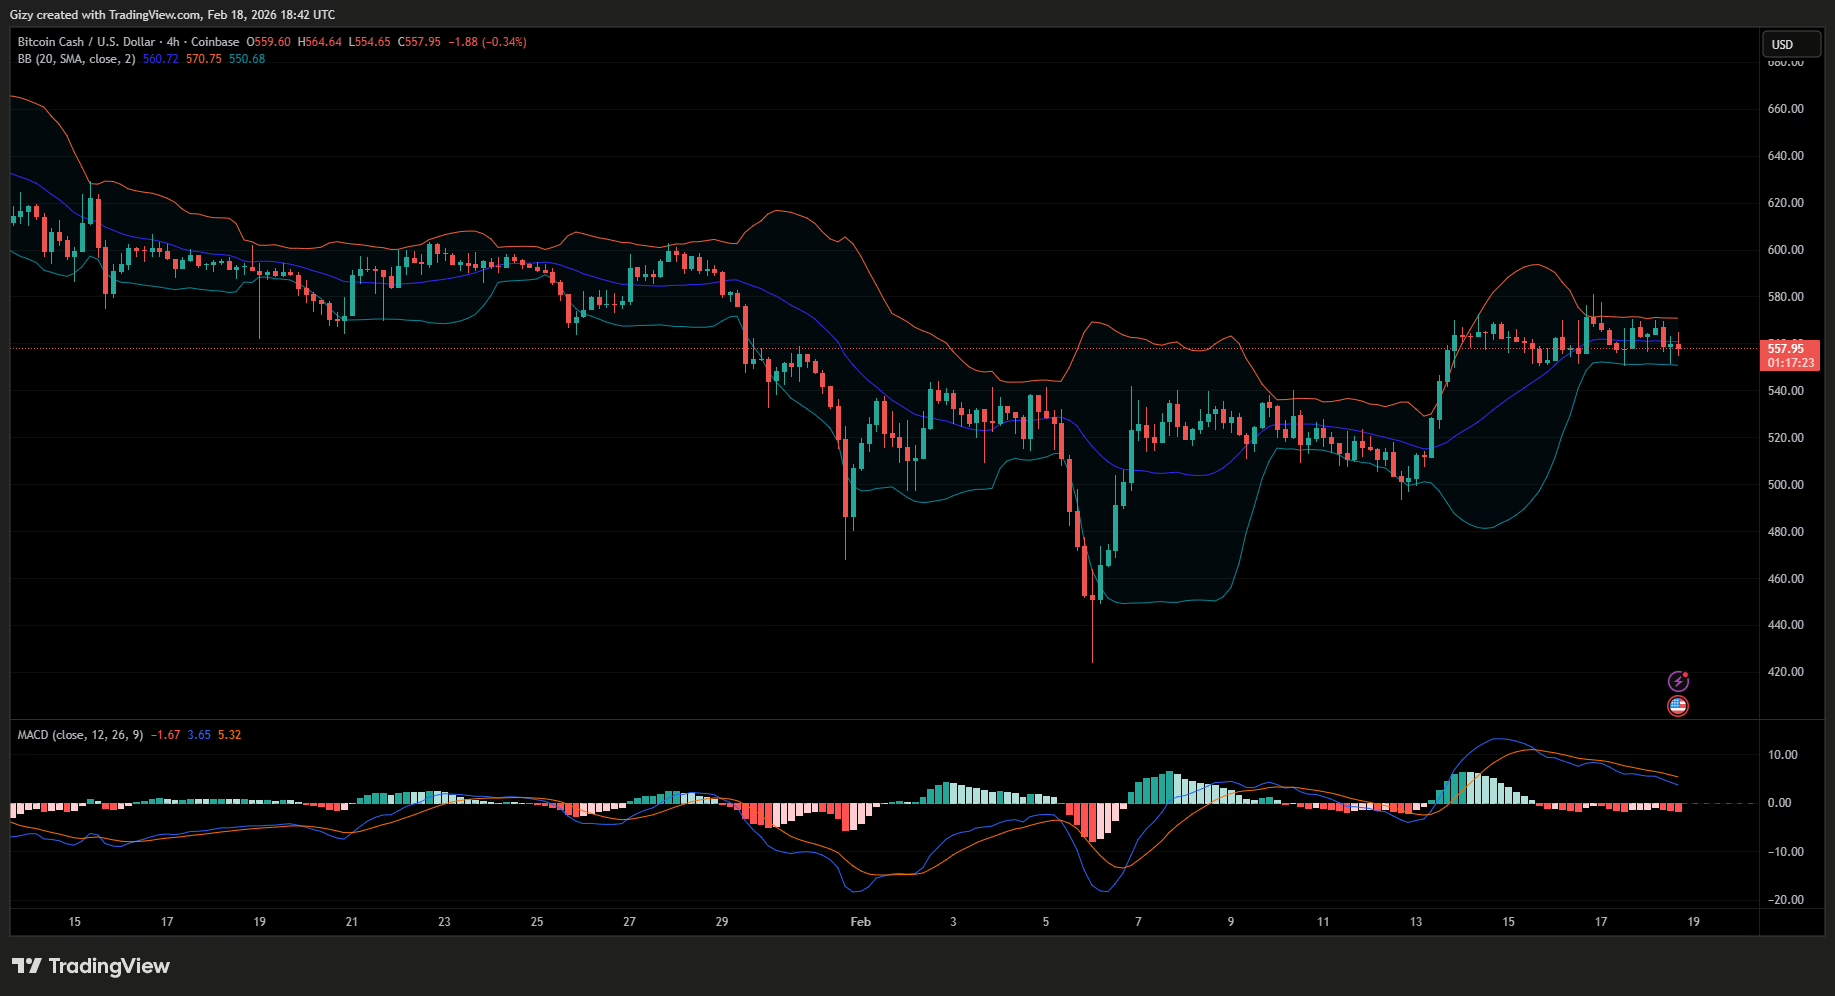
A closer look at the chart shows a new trend that may indicate an impending breakout. Since Monday, the altcoin has traded within the bollinger bands, staying within the bounds of the upper and lower bands.
While its current trend suggests that an end to its range-bound movement is imminent, it does not indicate the next price direction. If BCH breaks the upper band, it may attempt $600. Conversely, flipping the opposite line will result in a drop to $520.
The post Price Predictions 2/18: BTC, ETH, XRP, BNB, SOL, DOGE, BCH appeared first on CoinTab News.
0
0


 Beheer al jouw cryptovaluta, NFT en DeFi vanaf één plek
Verbind de portfolio die je gebruikt veilig om te beginnen.

0
0


0
0
