Fetch.ai (FET) in Opportunity Zone After 864 Million Tokens Join ASI Merge
9d ago•

bullish:
2
bearish:
0
Share

The decision to merge three AI-themed tokens into one has caused the price of Fetch.ai (FET) to fluctuate. At some point, the token’s price rallied and showed signs of retesting $2.
However, after a 7.25% since July 17, that attempt has been pulled back. Despite the challenge, on-chain analysis indicates that FET offers a rare opportunity for the long term.
The Merger Offers Fetch.ai Holders a Rare Chance
The Artificial Superintelligence (ASI) merger is currently in its first phase. So far, 640 million SingularityNET (AGIX) tokens have migrated.
Also, 224 million Ocean Protocol (OCEAN) tokens have done the same, making it 864 million tokens that have switched from their previous names to ASI.
When complete, these tokens will operate under the alliance headed by Fetch.ai. According to data from Santiment, the earlier price increase in FET’s price moved the 30-day MVRV ratio to 10.89%.
The MVRV ratio stands for Market Value to Realized Value, and it indicates whether crypto is undervalued or overvalued compared to its fair value.
Read More: How To Invest in Artificial Intelligence (AI) Cryptocurrencies?
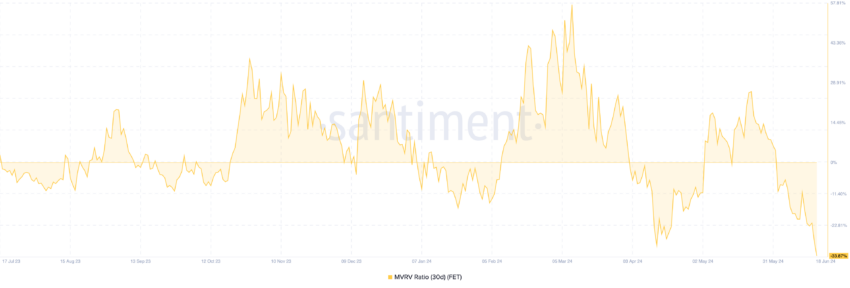 Fetch.ai 30-Day MVRV Ratio. Source: Santiment
The higher the ratio, the more unrealized profits holders have and the more they will be willing to sell. But when it decreases, it indicates more unrealized losses. In this case, most holders will prefer to HODL rather than sell.
At press time, the ratio is -33.78%. Historically, FET reaches an opportunity zone when the MVRV ratio is between -10.18% and -29.99%.
Therefore, the drop below zones imply that the token may have offered an optimum buying opportunity.
This Bulls And Bears indicator also backs this assertion. In this context, bulls are addresses that bought 1% of the total trading volume. Bears, on the other hand, are addresses that sold a similar amount.
Therefore, if there are more bears than bulls, it suggests a lower price. However, as of this writing, Fetch has eight more bulls than bears, indicating that a significant price increase may not be far away.
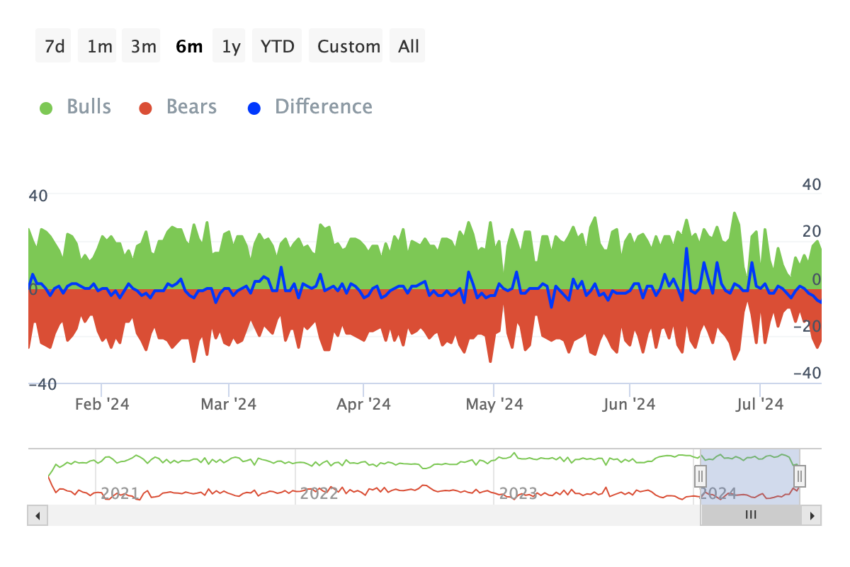 Fetch.ai Bulls And Bears. Source: TradingView
FET Price Prediction: Is Now the Time to Buy?
FET entered a steep correction phase after the price dropped by 42% between the last week of June and the first few days this month.
However, the token has, however, experienced a better period recently. Despite a slight drawback to $1.39, the Moving Average Convergence Divergence (MACD) reveals that the uptrend is not over.
The MACD helps traders identify price trends by analyzing the movement of two Exponential Moving Averages (EMAs). Usually, the EMAs involved are 12 (blue) and 26 (orange) EMAs. A net negative reading of the MACD implies bearish momentum.
Read More: Top 9 Artificial Intelligence (AI) Cryptocurrencies in 2024
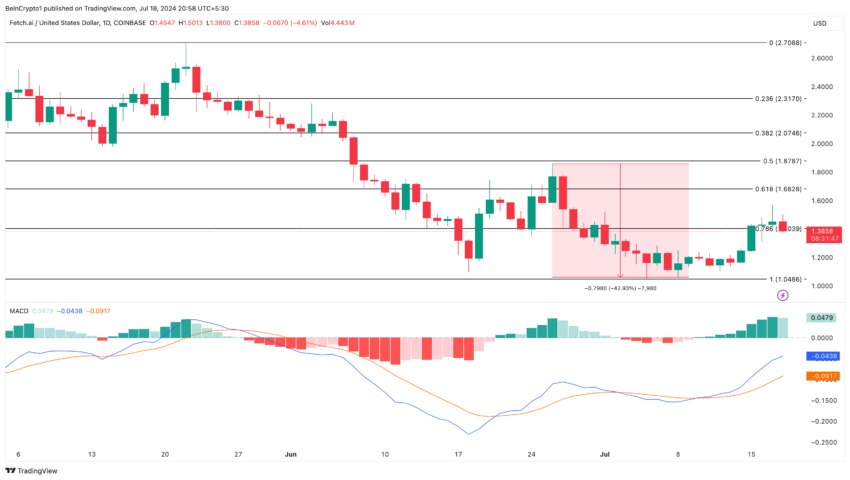 Fetch.ai Daily Analysis. Source: TradingView
However, for FET, it is bullish, indicating that the price could be ready to swing higher. If validated, the next area of interest for the token to reach is $1.68.
Should it cross that zone, then it may look at retesting $1.88. However, if selling pressure comes into play, this forecast could be neutralized. If that is the case, FET’s price may drop toward $1.04.
9d ago•
bullish:
2
bearish:
0
Share


 Manage all your crypto, NFT and DeFi from one place
Securely connect the portfolio you’re using to start.

bullish:
0
bearish:
0

bullish:
2
bearish:
0

bullish:
0
bearish:
0
