Why Is the Crypto Market Down Today?

0
0

The total crypto market capitalization (TOTAL) and Bitcoin extended their decline today, each falling by 1%. Bitcoin’s struggles below the $100,000 price mark have also impacted the altcoin market, with Hyperliquid’s HYPE emerging as the top loser.
In the news today:
- Donald Trump announced on Truth Social that former congressional candidate Bo Hines has been named Executive Director of the Presidential Council of Advisers for Digital Assets.
- Richard Heart, the founder of the HEX token, has been added to Interpol’s Red Notice list, facing allegations of tax fraud and violent assault.
The Crypto Market Continues Its Cooldown
The total crypto market capitalization has dropped $48 billion in the past 24 hours, now sitting at $3.18 trillion. This puts it below the $3.29 trillion resistance level—the key hurdle on its path to reclaiming the all-time high of $3.73 trillion.
This makes the $3.29 trillion price zone a crucial resistance level. Failure to break above it could trigger a deeper decline, potentially dragging TOTAL’s value below $3 trillion to $2.95 trillion.
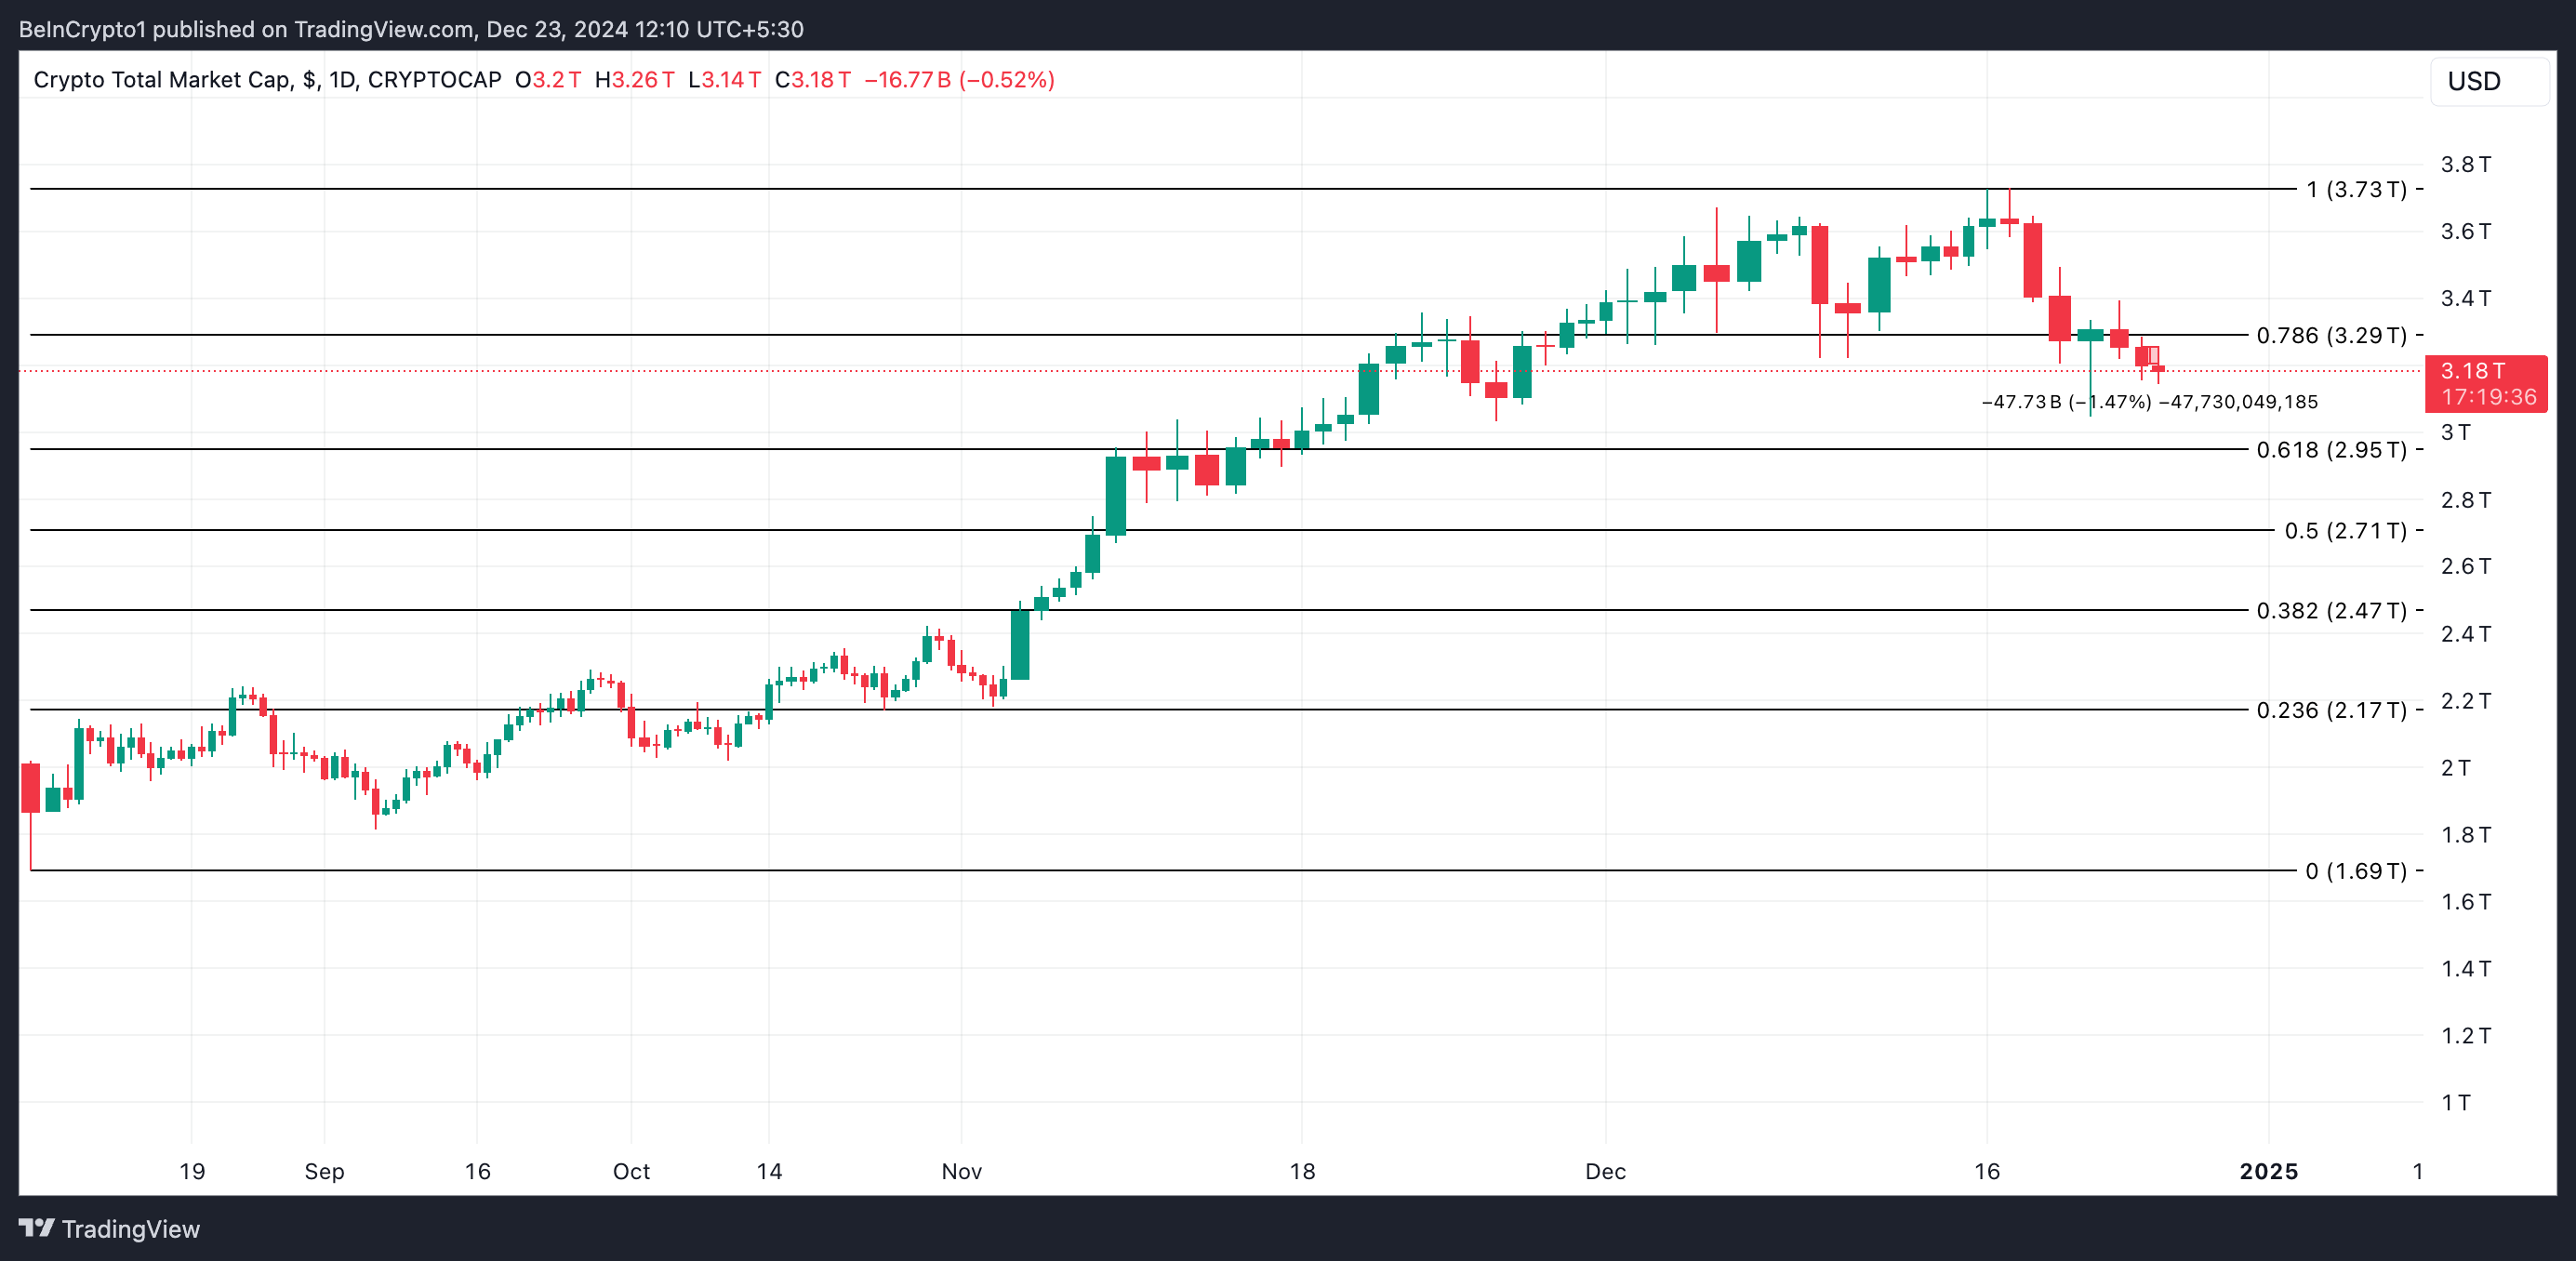 Total Crypto Market Cap Analysis. Source: TradingView
On the other hand, if trading activity regains momentum, this bearish outlook will be invalidated. TOTAL may successfully break above the key resistance level and attempt to revisit its all-time high.
Bitcoin Eyes More Decline
Since reaching a new all-time high of $108,230 on December 17, Bitcoin’s price has trended downward. Currently, the leading coin trades at $94,900, noting a 12% price fall in the past six days.
On the daily chart, BTC’s Super Trend indicator highlights the low demand for the king coin. For the first time since September 19, BTC’s price is below the red line of this indicator.
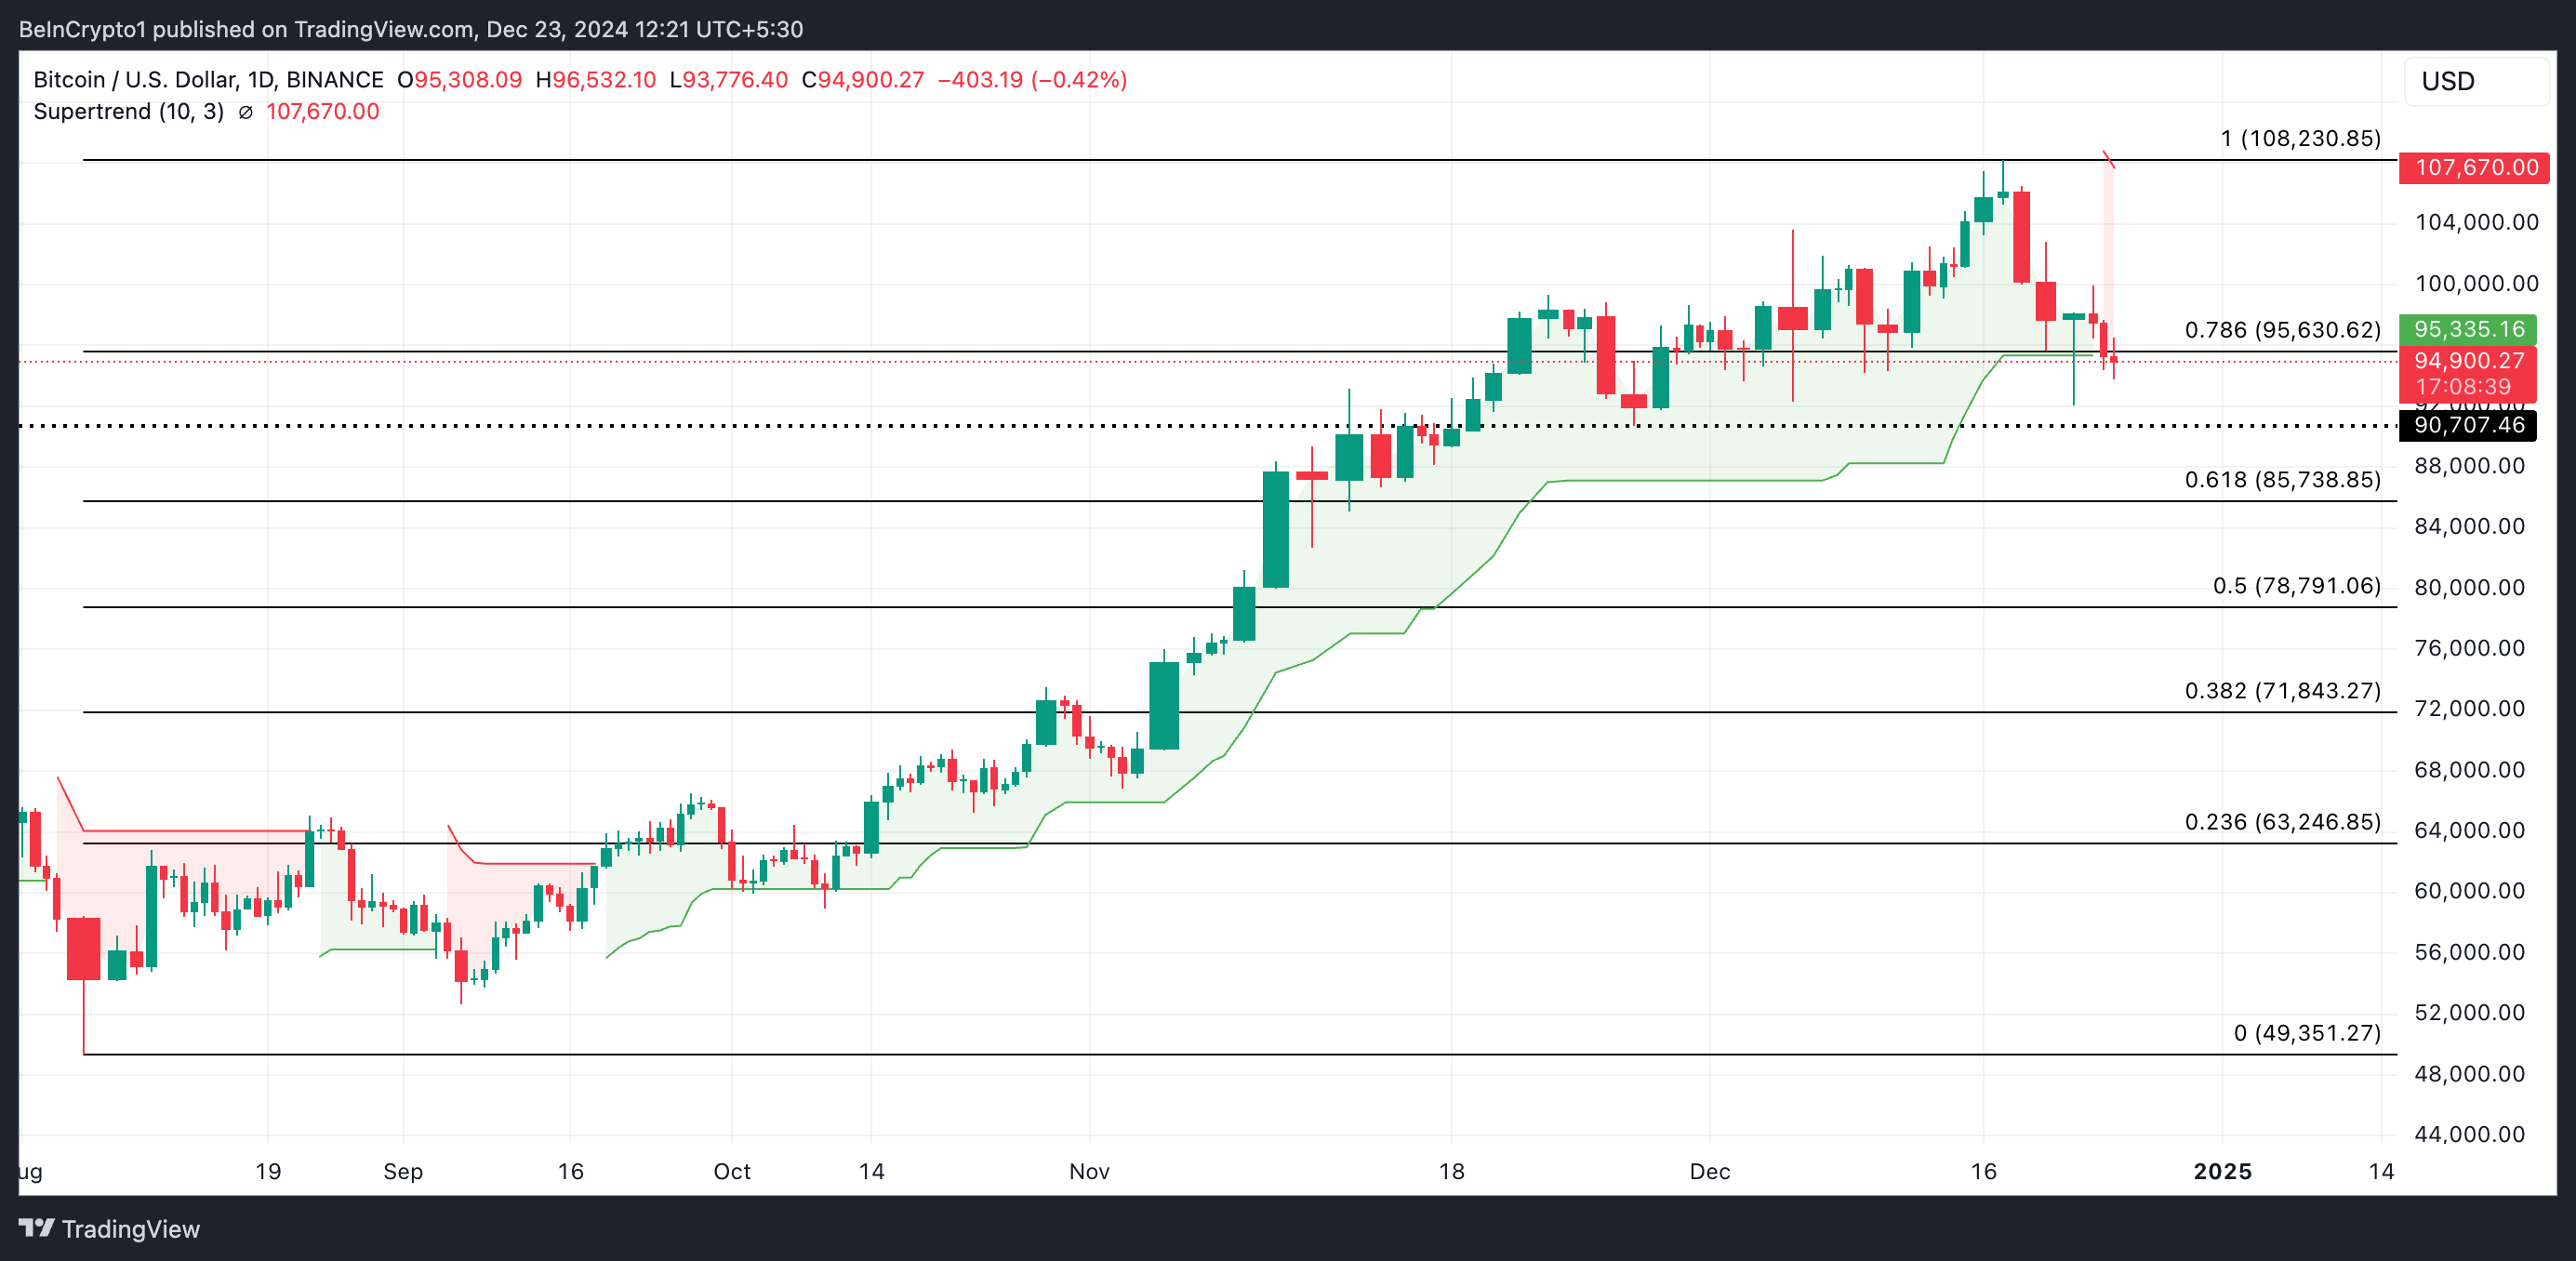 Bitcoin Price Analysis. Source: TradingView
The Super Trend indicator tracks the overall direction and strength of a trend in asset prices. It appears as a line on the price chart that changes color to reflect the trend direction. When the Super Trend line appears above the asset’s price, it indicates a downtrend, suggesting bearish momentum is likely to persist.
If this downtrend continues, BTC’s price may plunge toward $90,707.
On the other hand, if buying activity gains momentum, the coin’s price could break above the resistance formed at $95,630 and rally to its all-time high of $108,230.
Hypeliquid Drops By Double Digits
HYPE’s value has dropped by 22% in the past 24 hours, making it the altcoin with the most losses during that period.
This price decline is fueled by the surge in selling pressure as market participants take profits following the altcoin’s recent all-time high of $35.51 reached on December 22. If selloffs intensify, HYPE’s price will extend its decline and fall toward $22.90.
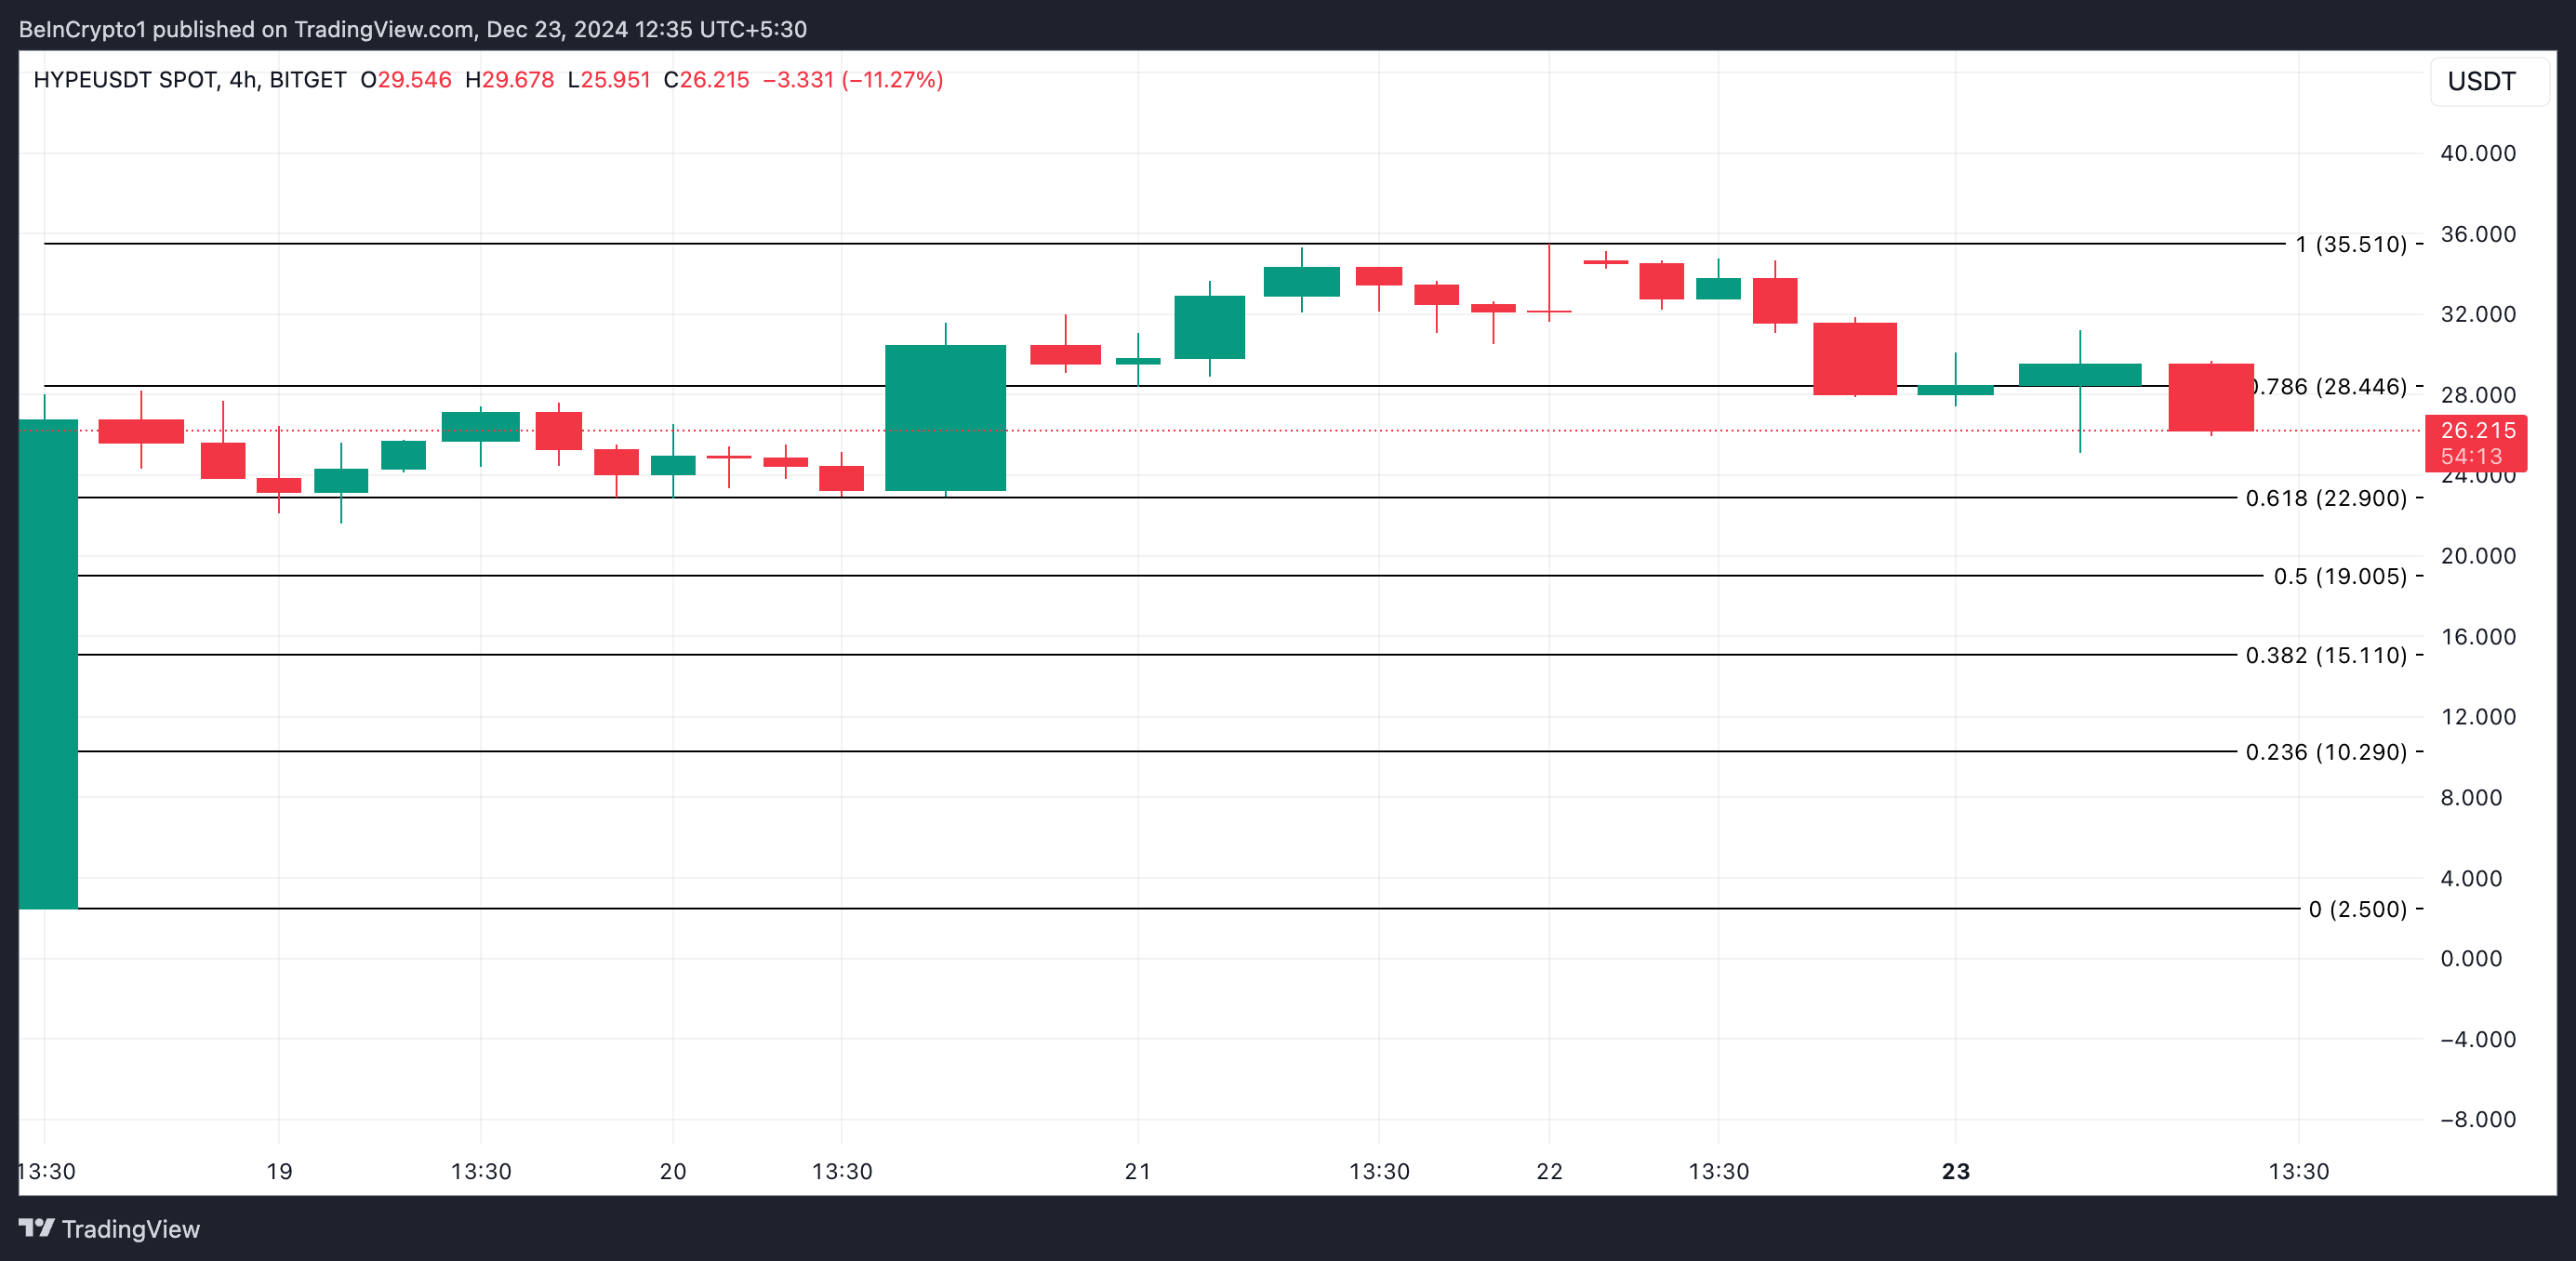 HYPE Price Analysis. Source: TradingView
Conversely, if buying activity recommences, this may propel HYPE’s price to reclaim its all-time high and potentially rally past it.
0
0


 从同一位置管理所有加密资产、NFT 和 DeFi 资产
安全地关联您正在使用的投资组合,以开始交易。


